






7521
Of your peers have already downloaded this article
15:52 Minutes
The most insightful time you'll spend today!

5310
Of your peers have already downloaded this article
7:30 Minutes
The most insightful time you'll spend today!
Sure, machine learning is becoming a business imperative, but how does it work in practice—and what are the benefits for IT managers?
That’s the subject of a new step-by-step guide to solving business and IT problems with artificial intelligence and ML, based on insights gathered by IDG Research Services.
Its publication comes at a time when technology departments face growing pressure to embrace these emerging technologies, yet many have questions about how to get started.
It has real-life examples such as the health services company that used ML to reduce support ticket-resolution time from 48 minutes to six.
In another section, a financial services VP explains that cloud-based ML services enable his company to avoid spending money on computing resources that sit idle.
The guide also includes concrete tips for new ML adopters. For example, a real-estate CIO recommends the use of third-party tools that rely on AI and ML technologies, while a financial services VP highlights the challenge and potential of incorporating unstructured data into ML initiatives.
Download the guide now!
Google Cloud’s Virtual Appointment Scheduling Tool (VAST) Helps State of Arizona Recover from Unemployment Situation

6537
Of your peers have already read this article.
2:00 Minutes
The most insightful time you'll spend today!
When the world was forced to go primarily online, state governments also faced the reality of needing to provide community services without the health risk of meeting in person. Old systems that relied on interpersonal contact could not keep up. An unprecedented number of displaced workers swamped every unemployment system. The capacity challenges weren’t limited to state labor departments either. Everything from birth certificates and marriage licenses to apostilles and court system services that could usually be handled by a simple walk-in had to be scheduled in advance. Both internal and external communication suffered.
To meet these challenges, many organizations turned to new technology solutions and innovative approaches.
How VAST helped Arizona get back to work
The State of Arizona had tens of thousands of constituents who relied on pandemic unemployment insurance and would also need tools to reenter the workforce.Tim Tucker, Deputy Administrator of the Workforce Development Administration for the Arizona Department of Economic Security, started preparing in late 2020. He collaborated with Google Cloud and SADA to introduce the Virtual Appointment Scheduling Tool (VAST) to State of Arizona staff members. Using VAST reduced the excessive workload taken on by the Workforce Development Administration as they got Arizona back to work. VAST lets constituents book an appointment, upload documents and forms, and conduct career counseling virtually. This helped constituents move through the system faster so they could successfully reenter the workforce.
That preparation paid off. As of September 2021, Arizona had recovered the majority of the jobs lost during the pandemic. It has also seen one of the smallest percent change in employment compared with pre-pandemic numbers. Even more impressive, Arizona is one of only five states where unemployment claims are now lower than pre-pandemic numbers. Using VAST helped them get people back to work faster and has become a permanent part of their unemployment program.
Bringing streamlined services to the community
To fully realize a solution to the challenges faced by our public sector customers, we focused on three key areas in which we knew we needed VAST to excel:
- Efficient staff allocation
- Streamlined internal meetings
- Confident constituent interactions
We also knew our customers needed to get VAST online fast, and it needed to work with existing infrastructure without requiring a total overhaul. These areas informed the design of VAST’s features and have allowed us to meet the challenges faced by agencies such as the Arizona Department of Economic Security.
Virtual Agent support and integrations
VAST gives constituents 24×7 virtual agent support powered by Google Cloud’s contact center AI virtual agents. Virtual agents are custom programmed to fit the specific needs of each agency and community they serve. It’s easy to add new options and information whenever an update is needed. Virtual agents can be designed to understand the user’s intent and serve up relevant content for a smooth user experience on both ends of the system. Virtual agents run at scale and offer multi-language support, ensuring they can serve everyone in the community. By pairing these with VAST, constituents can experience seamless self-service.
6 week deployment time
Most of our public sector clients needed a solution yesterday. VAST can be deployed rapidly, taking about six weeks from start to finish, which includes everything–even staff training time.
Integration with Google Workspace and Chrome
VAST securely integrates with other Google solutions, such as Google Workspace and Chromebooks. We work to ensure VAST is fully functional within your existing systems.
Collaboration and support
SADA collaborates with each organization to ensure that the design, development, and functionality of VAST align with their needs. SADA specializes in helping public sector customers migrate to Google Cloud.
Analytics
Application administrators have access to analytic data gathered by VAST and options to customize and add additional datasets.This data helps organizations find blind spots in coverage, fix service bottlenecks, and better organize internal resources. Leveraging this data gives organizations the power to make changes, resulting in everything from a smoother customer experience to cost savings.
To learn more about how Google Cloud has supported Arizona during the pandemic, check out this blog on how their vaccination distribution system leveraged Google Cloud to get the vaccine to more people. For more information on how VAST can streamline a customer experience.
Rubin Observatory Leverages Google Cloud to Power Astronomical Research

6061
Of your peers have already read this article.
2:00 Minutes
The most insightful time you'll spend today!
This week, the Vera C. Rubin Observatory is launching the first preview of its new Rubin Science Platform (RSP) for an initial cohort of astronomers. The observatory, which is located in Chile but managed by the U.S. National Science Foundation’s NOIRLab in Tucson, AZ and SLAC in California, is jointly funded by the NSF and the U.S. Department of Energy. The platform provides an easy-to-use interface to store and analyze the massive datasets of the Legacy Survey of Space and Time (LSST), which will survey a third of the sky each night for ten years, detecting billions of stars and galaxies, and millions of supernovae, variable stars, and small bodies in our Solar System.
The LSST datasets are unprecedented in size and complexity, and will be far too large for scientists to download to their personal computers for analysis. Instead, scientists will use the RSP to process, query, visualize, and analyze the LSST data archives through a mixture of web portal, notebook, and other virtual data analysis services. An initial launch with simulated data, called Data Preview 0, builds on the Rubin Observatory’s three-year partnership with Google to develop an Interim Data Facility (IDF) on Google Cloud to prototype hosting of the massive LSST dataset. This agreement marks the first time a cloud-based data facility has been used for an astronomy application of this magnitude.
Bringing the stars to the cloud
For Data Preview 0, the IDF leverages Cloud Storage, Google Kubernetes Engine (GKE), and Compute Engine to provide the Rubin Observatory user community access to simulated LSST data in an early version of the RSP. The simulated data were developed over several years by the LSST Dark Energy Science Collaboration to imitate five years of an LSST-like survey over 300 square degrees of the sky (about 1,500 times the area of the moon). The resulting images are very realistic: they have the same instrumental characteristics, such as pixel size and sensitivity to photons, that are expected from the Rubin Observatory’s LSST Camera, and they were processed with an early version of the LSST Science Pipelines that will eventually be used to process LSST data. “This will be the first time that these workloads have ever been hosted in a cloud environment. Researchers will have an opportunity to explore an early version of this platform,” says Ranpal Gill, senior manager and head of communications at the Rubin Observatory.
Broadening access for more researchers
Over 200 scientists and students with Rubin Observatory data rights were selected to participate in Data Preview 0 from a pool of applicants that represents a wide range of demographic criteria, regions, and experience level. Participants will be supported with resources such as tutorials, seminars, communication channels, and networking opportunities—and they will be free to pursue their own science at their own pace using the data in the RSP.
“The revolutionary nature of the future LSST dataset requires a commensurately innovative system for data access and analysis paired with robust support for scientists,” says Melissa Graham, lead community scientist for the Rubin Observatory and research scientist in the astronomy department at the University of Washington. “I’m personally excited to enhance my own skills by using the RSP’s tools for big data analysis, while also helping others to learn and to pursue their LSST-related science goals during Data Preview 0.”
At the same time, the fact that the RSP is hosted in the cloud provides researchers at smaller institutions access to state-of-the-art astronomy infrastructure that is comparable to that of the largest national research centers.
The launch benefits the observatory too: the development team can learn what researchers are interested in while also testing and debugging the platform. Graham says that “the platform is still in active development so researchers using it will be able to follow along in the progress, and provide feedback on ways that we can optimize the development of the tools.”
Next steps
The LSST aims to begin the ten-year survey in 2023-24 and expects it to include 500 petabytes of data. Through the cloud, Google aims to help make this extraordinary project scalable and accessible to researchers everywhere. To learn more about Data Preview 0, watch this video.
Want to ramp up your own research in the cloud? We offer research credits to academics using Google Cloud for qualifying projects in eligible countries. You can find our application form on Google Cloud’s website or contact our sales team.
The Query Execution Graph: Your Key to Better BigQuery Analytics

3073
Of your peers have already read this article.
2:30 Minutes
The most insightful time you'll spend today!
BigQuery offers strong query performance, but it is also a complex distributed system with many internal and external factors that can affect query speed. When your queries are running slower than expected or are slower than prior runs, understanding what happened can be a challenge.
The query execution graph provides an intuitive interface for inspecting query execution details. By using it, you can review the query plan information in graphical format for any query, whether running or completed.
You can also use the query execution graph to get performance insights for queries. Performance insights provide best-effort suggestions to help you improve query performance. Since query performance is multi-faceted, performance insights might only provide a partial picture of the overall query performance.
Execution graph
When BigQuery executes a query job, it converts the declarative SQL statement into a graph of execution, broken up into a series of query stages, which themselves are composed of more granular sets of execution steps. The query execution graph provides a visual representation of the execution stages and shows the corresponding metrics. Not all stages are made equal. Some are more expensive and time consuming than others. The execution graph provides toggles for highlighting critical stages, which makes it easier to spot the potential performance bottlenecks in the query.
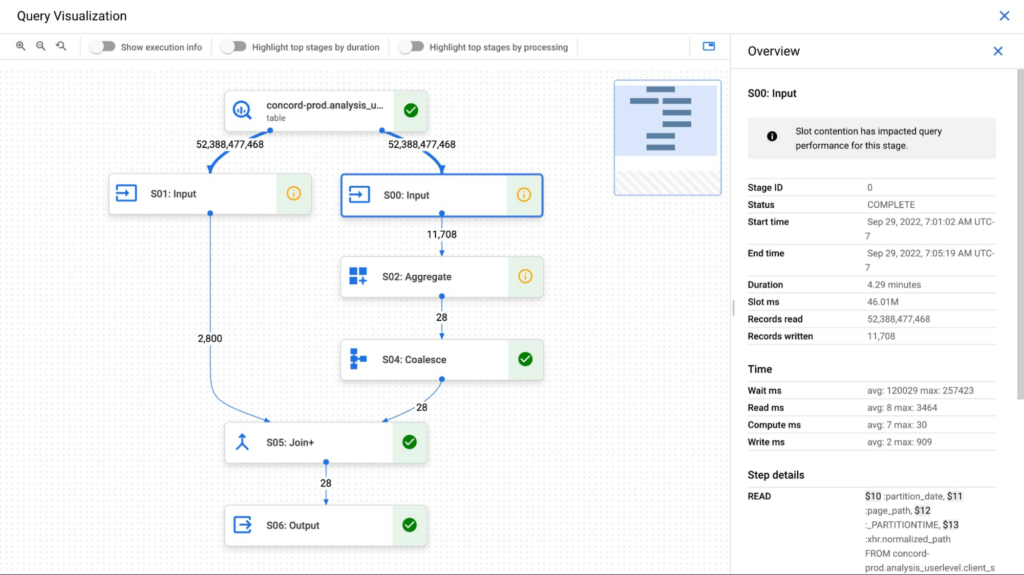
Query performance insights
In addition to the detailed execution graph BigQuery also provides specific insights on possible factors that might be slowing query performance.
Slot contention
When you run a query, BigQuery attempts to break up the work needed by your query into tasks. A task is a single slice of data that is input into and output from a stage. A single slot picks up a task and executes that slice of data for the stage. Ideally, BigQuery slots execute tasks in parallel to achieve high performance. Slot contention occurs when your query has many tasks ready for slots to start executing, but BigQuery can’t get enough available slots to execute them.
Insufficient shuffle quota
Before running your query, BigQuery breaks up your query’s logic into stages. BigQuery slots execute the tasks for each stage. When a slot completes the execution of a stage’s tasks, it stores the intermediate results in shuffle. Subsequent stages in your query read data from shuffle to continue your query’s execution. Insufficient shuffle quota occurs when you have more data that needs to get written to shuffle than you have shuffle capacity.
Data input scale change
Getting this performance insight indicates that your query is reading at least 50% more data for a given input table than the last time you ran the query and hence experiencing query slowness. You can use table change history to see if the size of any of the tables used in the query has recently increased.
What’s next?
We continue to work on improving the visualization of the graph. We are working on adding additional metrics to each step and adding more performance insights that will make query diagnosis significantly easier. We are just getting started.
6395
Of your peers have already watched this video.
2:00 Minutes
The most insightful time you'll spend today!
CCAI Insights: Answer Customers’ Queries & Understand Them Better with Conversation Data
With CCAI Insights, businesses can drive contact center efficiency, solve customer problems and leverage data from customer interactions to understand them better!
CCAI Insights, a core piece of the Google Cloud’s Contact Center AI product suite is built to help contact center management dive into data to adjust business needs, preempt problems with timely analysis of customer conversations and keep agents prepared. Additionally, businesses can automatically feed data into Insights from other areas of CCAI like Dialogflow CX or another product sources. Watch the video to find out more benefits and capabilities of CCAI Insights in elevating CX.
More Relevant Stories for Your Company

Google Cloud named a leader in the Forrester Wave: Streaming Analytics
There’s a lot of pressure on companies today to become data-driven, but they need high-performing technology to make that a reality. As part of Google's larger cloud data analytics platform, Cloud Pub/Sub and Cloud Dataflow are designed for ease of use, scalability, and performance. Google Cloud unifies streaming analytics and batch processing the way

You Can Quantify and Maximize Value of Your Org’s AI/ML and Analytics Teams!
Investing in Artificial Intelligence (AI) can bring a competitive advantage to your organization. If you’re in charge of an AI or Data Science team, you’ll want to measure and maximize the value that you’re providing. Here is some advice from our years of experience in the field. A checklist to

Getting Started with BigQuery: 10 Quick Steps
BigQuery is Google's fully managed, petabyte scale, low cost analytics data warehouse. BigQuery is NoOps—there is no infrastructure to manage and you don't need a database administrator—so you can focus on analyzing data to find meaningful insights, use familiar SQL, and take advantage of our pay-as-you-go model. That's great, right? So

Customer Voices: How Firms from Across Industries Leverage Google Cloud
From powering everyday operations and accelerating application innovation, to providing tools for specific business needs and executing on big ideas, to advancing the security of technology solutions, companies from across industries have leveraged Google Cloud for business benefits. Companies from across industries have turned to Google Cloud for transforming their
