





Updating Twitter’s Ad Engagement Analytics Platform for the Modern Age

3095
Of your peers have already read this article.
3:30 Minutes
The most insightful time you'll spend today!
As part of the daily business operations on its advertising platform, Twitter serves billions of ad engagement events, each of which potentially affects hundreds of downstream aggregate metrics. To enable its advertisers to measure user engagement and track ad campaign efficiency, Twitter offers a variety of analytics tools, APIs, and dashboards that can aggregate millions of metrics per second in near-real time.
In this post, you’ll get details on how the Twitter Revenue Data Platform engineering team, led by Steve Niemitz, migrated their on-prem architecture to Google Cloud to boost the reliability and accuracy of Twitter’s ad analytics platform.
Deciding to migrate
Over the past decade, Twitter has developed powerful data transformation pipelines to handle the load of its ever-growing user base worldwide. The first deployments for those pipelines were initially all running in Twitter’s own data centers. The input data streamed from various sources into Hadoop Distributed File System (HDFS) as LZO-compressed Thrift files in an Elephant Bird container format. The data was then processed and aggregated in batches by Scalding data transformation pipelines. Then, aggregation results were output into Manhattan, Twitter’s homegrown distributed key-value store, for serving. Additionally, a streaming system using Twitter’s homegrown systems Eventbus (a messaging tool built on top of DistributedLog), Heron (a stream processing engine), and Nighthawk (a sharded Redis deployment) powered the real-time analytics that Twitter had to provide, filling the gap between the current time and the last batch run.
While this system consistently sustained massive scale, its original design and implementation was starting to reach some limits. In particular, some parts of the system that had grown organically over the years were difficult to configure and extend with new features. Some intricate, long-running jobs were also unreliable, leading to sporadic failures. The legacy end-user serving system was very expensive to run and couldn’t support large queries.
To accommodate for the projected growth in user engagement over the next few years and streamline the development of new features, the Twitter Revenue Data Platform engineering team decided to rethink the architecture and deploy a more flexible and scalable system in Google Cloud.
Platform modernization: First iteration
In the middle of 2017, Steve and his team tackled the first redesign iteration of its advertising data platform modernization, leading to Twitter’s collaboration with Google Cloud.
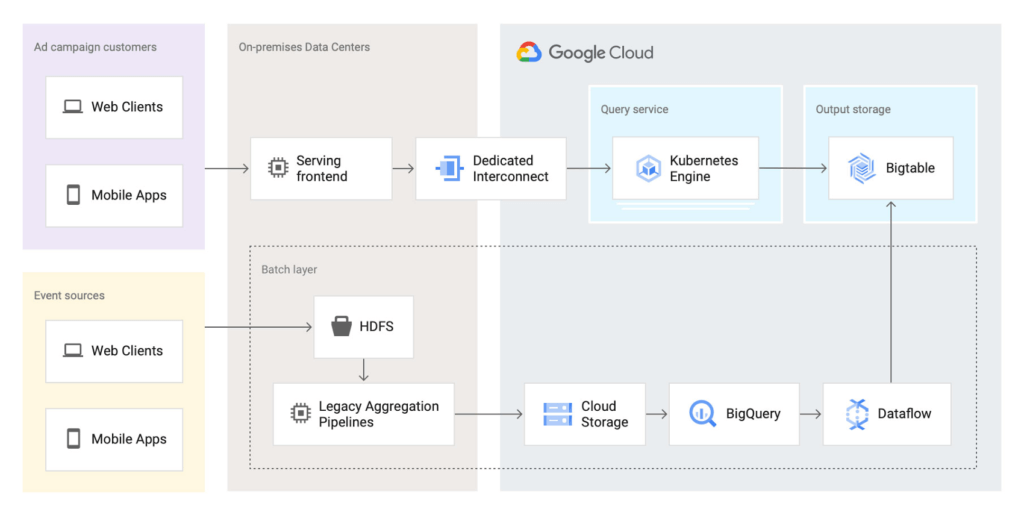
At first, the team left the data aggregation legacy Scalding pipelines unchanged and continued to run them in Twitter’s data centers. But the batch layer’s output was switched from Manhattan to two separate storage locations in Google Cloud:
- BigQuery—Google’s serverless and highly scalable data warehouse, to support ad-hoc and batch queries.
- Cloud Bigtable—Google’s low-latency, fully managed NoSQL database, to serve as a back end for online dashboards and consumer APIs.
The output aggregations from the Scalding pipelines were first transcoded from Hadoop sequence files to Avro on-prem, staged in four-hour batches to Cloud Storage, and then loaded into BigQuery. A simple pipeline deployed on Dataflow, Google Cloud’s fully managed streaming and batch analytics service, then read the data from BigQuery and applied some light transformations. Finally, the Dataflow pipeline wrote the results into Bigtable.
The team built a new query service to fetch aggregated values from Bigtable and process end-user queries. They deployed this query service in a Google Kubernetes Engine (GKE) cluster in the same region as the Bigtable instance to optimize for data access latency.
Here’s a look at the architecture:
This first iteration already brought many important benefits:
- It de-risked the overall migration effort, letting Twitter avoid migrating both the aggregation business logic and storage at the same time.
- The end-user serving system’s performance improved substantially. Thanks to Bigtable’s linear scalability and extremely low latency for data access, the serving system’s P99 latencies decreased from 2+ seconds to 300ms.
- Reliability increased significantly. The team now rarely, if ever, gets paged for the serving system anymore.
Platform modernization: second iteration
With the new serving system in place, in 2019 the Twitter team began to redesign the rest of the data analytics pipeline using Google Cloud technologies. The redesign sought to solve several existing pain points:
- Because the batch and streaming layers ran on different systems, much of the logic was duplicated between systems.
- While the serving system had been moved into the cloud, the existing pain points of the Hadoop aggregation process still existed.
- The real-time layer was expensive to run and required significant operational attention.
With these pain points in mind, the team began evaluating technologies that could help solve them. They considered several open-source stream processing frameworks initially: Apache Flink, Apache Kafka Streams, and Apache Beam. After evaluating all possible options, the team chose Apache Beam for a few key reasons:
- Beam’s built-in support for exactly-once operations at extremely large scale across multiple clusters.
- Deep integration with other Google Cloud products, such as Bigtable, BigQuery, and Pub/Sub, Google Cloud’s fully managed, real-time messaging service.
- Beam’s programming model, which unifies batch and streaming and lets a single job operate on either batch inputs (Cloud Storage), or streaming inputs (Pub/Sub).
- The ability to deploy Beam pipelines on Dataflow’s fully managed service.
The combination of Dataflow’s fully managed approach and Beam’s comprehensive feature set let Twitter simplify the structure of its data transformation pipeline, as well as increase overall data processing capacity and reliability.
Here’s what the architecture looks like after the second iteration:
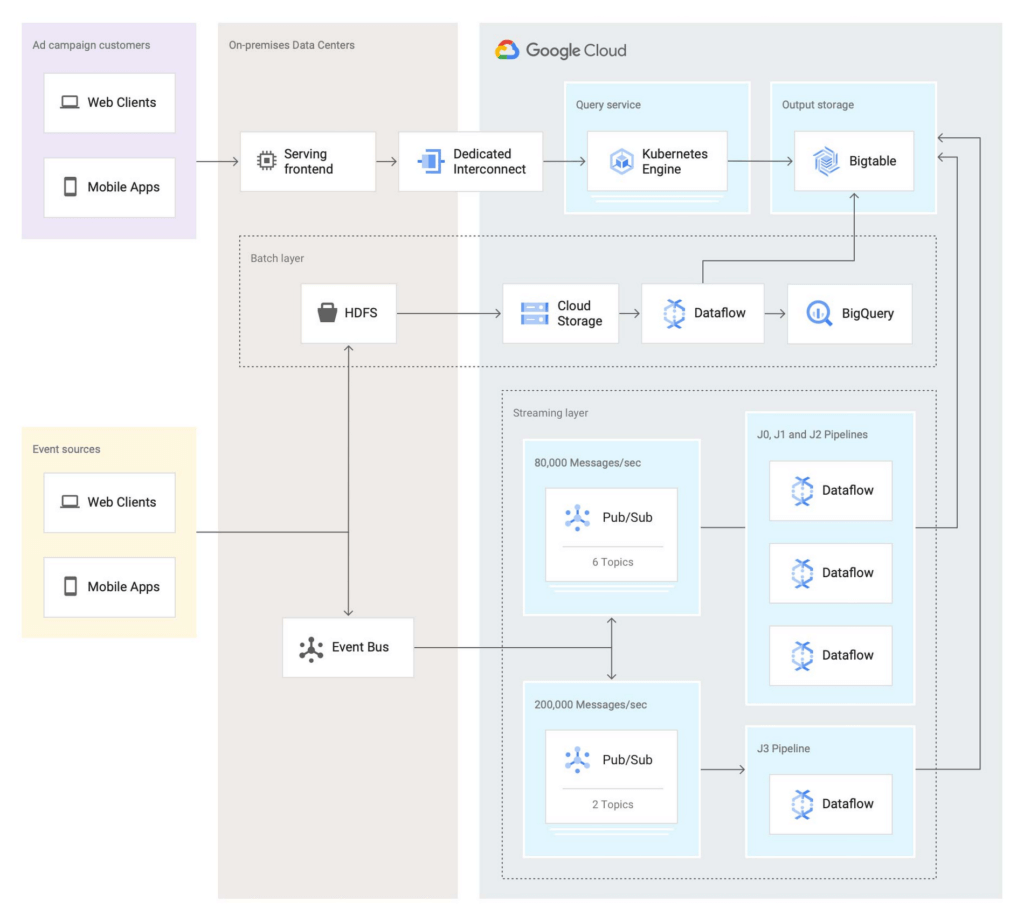
In this second iteration, the Twitter team re-implemented the batch layer as follows: Data is first staged from on-prem HDFS to Cloud Storage. A batch Dataflow job then regularly loads the data from Cloud Storage, processes the aggregations, and dual-writes the results to BigQuery for ad-hoc analysis and Bigtable for the serving system.
The Twitter team also deployed an entirely new streaming layer in Google Cloud. For data ingestion, an on-prem service now pushes two different streams of Avro-formatted messages to Pub/Sub. Each message contains a bundle of multiple raw events and affects between 100 and 1,000 aggregations. This leads to more than 3 million aggregations per second performed by four Dataflow jobs (J0-3 in the diagram above). All Dataflow jobs share the same topology, although each job consumes messages from different streams or topics.
One stream, which contains critical data, enters the system at a rate of 200,000 messages per second and is partitioned in two separate Pub/Sub topics. A Dataflow job (J3 in the diagram) consumes those two streams, performs 400,000 aggregations per second, and outputs the results to a table in Bigtable.
The other stream, which contains less critical but higher volume data, enters the system at a rate of around 80,000 messages per second and is partitioned into six separate topics. Three Dataflow jobs (J0, J1, and J2) share the processing of this larger stream, with each of them handling two of the available six topics in parallel, then also outputting the results to a table in Bigtable. In total, those three jobs process over 2 million aggregations/second.
Partitioning the high-volume stream into multiple topics offers a number of advantages:
- The partitioning is organized by applying a hash function on the aggregation key and then dividing the function’s result by the number of available partitions (in this case, six). This guarantees that any per-key grouping operation in downstream pipelines is scoped to a single partition, which is required for consistent aggregation results.
- When deploying updates to the Dataflow jobs, admins can drain and relaunch each job individually in sequence, allowing the remaining pipelines to continue uninterrupted and minimizing impact on the end users.
- The three jobs can each handle two topics without issue currently, and there is still room to scale horizontally up to six jobs if needed. The number of topics (six) is arbitrary, but is a good balance at the moment based on current needs and potential spikes in traffic.
To assist with job configuration, Twitter initially considered using Dataflow’s template system, a powerful feature that enables the encapsulation of Dataflow pipelines into repeatable templates that can be configured at runtime. However, since Twitter needed to deploy jobs with topologies that might change over time, the team decided instead to implement a custom declarative system where developers can specify different parameters for their jobs in a pystachio DSL: tuning parameters, data sources to operate on, sink tables for aggregation outputs, and the jobs’ source code location. A new major version of Dataflow templates, called Flex Templates, will remove some of the previous limitations with the template architecture and allow any Dataflow job to be templatized.
For job orchestration, the Twitter team built a custom command line tool that processes the configuration files to call the Dataflow API and submit jobs. The tool also allows developers to submit a job update by automatically performing a multi-step process, like this:
- Drain the old job:
- Call the Dataflow API to identify which data sources are used in the job (for example, a Pub/Sub topic reader).
- Initiate a drain request.
- Poll the Dataflow API for the watermark of the identified sources until the maximum watermark is hit, which indicates that the draining operation is complete.
- Launch the new job with the updated code.
This simple, flexible, and powerful system allows developers to focus on their data transformation code without having to be concerned about job orchestration or the underlying infrastructure details.
Looking ahead
Six months after fully transitioning its ad analytics data platform to Google Cloud, Twitter has already seen huge benefits. Twitter’s developers have gained in agility as they can more easily configure existing data pipelines and build new features much faster. The real-time data pipeline has also greatly improved its reliability and accuracy, thanks to Beam’s exactly-once semantics and the increased processing speed and ingestion capacity enabled by Pub/Sub, Dataflow, and Bigtable.
Twitter engineers have enjoyed working with Dataflow and Beam for several years now, since version 2.2, and plan to continue expanding their usage. Most importantly, they’ll soon merge the batch and streaming layers into a single, authoritative streaming layer.
Throughout this project, the Twitter team collaborated very closely with Google engineers to exchange feedback and discuss product enhancements. We look forward to continuing this joint technical effort on several ongoing large-scale cloud migration projects at Twitter. Stay tuned for more updates!
Data Cloud Skills to Pick Up in 2022: Google Experts Recommended

4957
Of your peers have already read this article.
3:00 Minutes
The most insightful time you'll spend today!
It’s 2022 and nanosatellites, NFTs, and autonomous cars that deliver your pizza are in full force. In a world where people rely on simple technology to untangle complex problems, companies must deliver simple experiences to be successful in today’s landscape. For many cloud providers this means enabling tightly integrated data offerings that simplify the data delivery process without losing sight of the sophisticated needs of the modern data consumer.
But while the name of the game is helping companies reach informed decisions from their data simpler and faster, what about the data practitioners – data analysts, data engineers, database administrators, developers, etc – who use these cloud data tools and technologies everyday? To proactively stay ahead of data cloud market trends in 2022 should data practitioners invest their time in specializing their data cloud skill sets (e.g. go deep in, say, data pipelining skills) or instead invest their time generalizing their data cloud skill sets (e.g. growing proficiencies in a mix of data analytics, databases, AI/ML, and more domains)?
Skill deep or wide with data – that is the question
For Abdul Razack, VP, Solutions Engineering, Technology Solutions and Strategy at Google Cloud, the answer is a bit of both.
“Data practitioners need to be broad in terms of their technology skills, but specialized with respect to the domain or domains in which they apply them. The reason why is because many things that used to be separate skill sets are now converging – like business analytics, streaming, machine learning, data pipelines, and data warehousing. Data practitioners need to be able to implement end-to-end workflows that solve specific business problems using skills from each category.”
It’s true, thousands of customers are choosing Google’s data cloud because it offers a unified and open approach to cloud that enables their practitioners to break down silos, begin and end projects without leaving the data platform, and innovate faster across their organization.
The data practitioners who mirror Google data cloud’s frame of mind of being smart and agile across data domains in their skilling and learning will reap the benefits of solving more nuanced problems – building out internet-scale applications, fine tuning smart processes with analytics and AI, constructing data meshes that make product building simple, etc – at a larger scale than they would if they specialized in just one or two areas alone.
“Of course at the end of the day it depends on what tools a data practitioner is using to complete their workflows. There’s only so much you can learn and skills you can develop when you’re using limited tools. Growing data proficiencies across the board is made a lot easier when you’re using a data platform like BigQuery to address all these needs. BigQuery eliminates the choices you have to make – for instance you don’t have to choose between streaming data and data at rest, batch and realtime, or business intelligence and data science. This freedom gives data professionals a huge advantage when they’re building their skill sets and taking on more complex projects.” -Abdul Razack – VP, Solutions Engineering, Technology Solutions and Strategy, Google Cloud
Knowing your value is half the battle when upskilling
While some experts think technology is the limiting factor of whether or not you can even go wide or go deep in the first place, others like Google Cloud’s Head of Data and Analytics Bruno Aziza purport that it also depends on who you are, who you wish to be, and what investments your company is making to ensure you can become that person.
“If you wish to set yourself up to be a Chief Data Officer, then you’ll want to understand how technologies fit together across your data estate first” said Aziza. “Only after you feel like you’re the go-to ‘data person’ can you then decide which part of the technology stack you want to double-down on.”
But technology isn’t everything. Aziza notes, “Make sure you focus on the business impact that your data work provides. You want to spend as much time as you can with your business counterparts to understand their business goals and challenges. The Harvard Business Review provides great guidance on how to succeed as a Chief Data Officer.”
Even if you don’t have your sights set on a C-suite role, both Aziza and Razack contend that the number one skill data practitioners should tackle in 2022 is actually a broad and perhaps abstract one: develop and exercise the curiosity to solve problems with a data-driven strategy.
That is, today’s data practitioners should always be interested in educating themselves in the industry and continually upskilling in something. And their employers should also be invested in helping practitioners develop those interests, most likely through exposure to learning materials, engaging in career conversations, subsidized courses, or incentives attached to pursuing a new certification or skill.
“Every industry is going through a digital transformation and the ability to identify what data to collect, how to prepare the data, and how to derive insights from it is critical. Therefore, the ability to find business challenges and formulate a data-driven approach to address those problems is the most important skill to have.” Abdul Razack – VP, Solutions Engineering, Technology Solutions and Strategy, Google Cloud.
Take the example of the “Data Mesh” I just wrote about in VentureBeat. You’ll find 3 types of attitudes towards this new concept. There are Disciples who encourage continued learning only from the source – like the author of a new book or the creator of a theory. There are Distractors who tell you that new skills, trends, and technologies are fake news. And there are Distorters like vendors who will sell you one easy fix solution. But it’s the data practitioner who needs to proceed with caution when interacting with all three types and forge their own path to discovering the truth when they’re learning and building skills. And for better or worse, this comes with trial and error, experimentation, and an eagerness to grow relative to where they began.”
Ready to start data upskilling? Start here.
For those interested in keeping up their data curiosities, check out our Data Journeys video series. Each week Bruno Aziza investigates a new authentic customer’s data journey – from migrating to cloud or building a data platform to carrying out new data for good initiatives. Learn how they did it, their data dos and don’ts, and what’s next for them on their journey. These videos include a flavor of both specializing your data competencies and broadening your data competencies.
For those interested in deepskilling, connect with Google’s data community at our upcoming virtual event: Latest Google Cloud data analytics innovations. Register and save your spot now to get your data questions answered live by GCP’s top data leaders and watch demos from our latest products and features including BigQuery, Dataproc, Dataplex, Dataflow, and more.
If you have any questions or need support along your learning journey – we’re here for you! Sign up to be a Google Cloud Innovator, and join the Google Cloud Data Analytics Community.
Google Cloud’s Virtual Appointment Scheduling Tool (VAST) Helps State of Arizona Recover from Unemployment Situation

6536
Of your peers have already read this article.
2:00 Minutes
The most insightful time you'll spend today!
When the world was forced to go primarily online, state governments also faced the reality of needing to provide community services without the health risk of meeting in person. Old systems that relied on interpersonal contact could not keep up. An unprecedented number of displaced workers swamped every unemployment system. The capacity challenges weren’t limited to state labor departments either. Everything from birth certificates and marriage licenses to apostilles and court system services that could usually be handled by a simple walk-in had to be scheduled in advance. Both internal and external communication suffered.
To meet these challenges, many organizations turned to new technology solutions and innovative approaches.
How VAST helped Arizona get back to work
The State of Arizona had tens of thousands of constituents who relied on pandemic unemployment insurance and would also need tools to reenter the workforce.Tim Tucker, Deputy Administrator of the Workforce Development Administration for the Arizona Department of Economic Security, started preparing in late 2020. He collaborated with Google Cloud and SADA to introduce the Virtual Appointment Scheduling Tool (VAST) to State of Arizona staff members. Using VAST reduced the excessive workload taken on by the Workforce Development Administration as they got Arizona back to work. VAST lets constituents book an appointment, upload documents and forms, and conduct career counseling virtually. This helped constituents move through the system faster so they could successfully reenter the workforce.
That preparation paid off. As of September 2021, Arizona had recovered the majority of the jobs lost during the pandemic. It has also seen one of the smallest percent change in employment compared with pre-pandemic numbers. Even more impressive, Arizona is one of only five states where unemployment claims are now lower than pre-pandemic numbers. Using VAST helped them get people back to work faster and has become a permanent part of their unemployment program.
Bringing streamlined services to the community
To fully realize a solution to the challenges faced by our public sector customers, we focused on three key areas in which we knew we needed VAST to excel:
- Efficient staff allocation
- Streamlined internal meetings
- Confident constituent interactions
We also knew our customers needed to get VAST online fast, and it needed to work with existing infrastructure without requiring a total overhaul. These areas informed the design of VAST’s features and have allowed us to meet the challenges faced by agencies such as the Arizona Department of Economic Security.
Virtual Agent support and integrations
VAST gives constituents 24×7 virtual agent support powered by Google Cloud’s contact center AI virtual agents. Virtual agents are custom programmed to fit the specific needs of each agency and community they serve. It’s easy to add new options and information whenever an update is needed. Virtual agents can be designed to understand the user’s intent and serve up relevant content for a smooth user experience on both ends of the system. Virtual agents run at scale and offer multi-language support, ensuring they can serve everyone in the community. By pairing these with VAST, constituents can experience seamless self-service.
6 week deployment time
Most of our public sector clients needed a solution yesterday. VAST can be deployed rapidly, taking about six weeks from start to finish, which includes everything–even staff training time.
Integration with Google Workspace and Chrome
VAST securely integrates with other Google solutions, such as Google Workspace and Chromebooks. We work to ensure VAST is fully functional within your existing systems.
Collaboration and support
SADA collaborates with each organization to ensure that the design, development, and functionality of VAST align with their needs. SADA specializes in helping public sector customers migrate to Google Cloud.
Analytics
Application administrators have access to analytic data gathered by VAST and options to customize and add additional datasets.This data helps organizations find blind spots in coverage, fix service bottlenecks, and better organize internal resources. Leveraging this data gives organizations the power to make changes, resulting in everything from a smoother customer experience to cost savings.
To learn more about how Google Cloud has supported Arizona during the pandemic, check out this blog on how their vaccination distribution system leveraged Google Cloud to get the vaccine to more people. For more information on how VAST can streamline a customer experience.
Google Cloud Tools Help U.S. Forest Department Generate Years of Insights into Earth’s Natural Resources

5008
Of your peers have already read this article.
3:00 Minutes
The most insightful time you'll spend today!
For 117 years, the U.S. Department of Agriculture’s Forest Service has been a steward of America’s forests, grasslands, and waterways. It directly manages 193 million acres and supports sustainable management on a total of 500 million acres of private, state, and tribal lands. Its impact reaches far beyond even that, offering its research and learning freely to the world.
At Google, we’re big admirers of the Forest Service’s mission. So we were thrilled to learn in 2011 that its scientists were using Google Earth Engine, our planetary-scale platform for Earth Science data and analysis, to aid its research, understanding, and effectiveness. In the years since, Google has worked with the Forest Service to meet its unique requirements for visual information about the planet. Using both historical and current data, the Forest Service built new products, workflows, and tools that help more effectively and sustainably manage our natural resources. The Forest Service also uses Earth Engine and Google Cloud to study the effects of climate change, forest fires, insects and disease, helping them create new insights and strategies.
Besides gaining newfound depths of insight, the Forest Service has also sped up its research dramatically, enabling everyone to do more. Using Google Cloud and Earth Engine, the Forest Service reduced the time it took to analyze 10 years worth of land-cover changes from three months to just one hour, using just 100 lines of code. The agency built new models for coping with change, then mapped these changes over time, in its Landscape Change Monitoring System (LCMS) project.
Emergency responders can now work better on new threats that arise after wildfires, hurricanes, and other natural disasters. Forest health specialists can detect and monitor the impacts of invasive insects, diseases, and drought. More Forest Service personnel can use new tools and products within Earth Engine, thanks to numerous training and outreach sessions within the Forest Service.
Researchers elsewhere also benefited when the Forest Service created new toolkits, and posted them to GitHub for public use. For example, there’s geeViz, a repository of Google Earth Engine Python code modules useful for general data processing, analysis, and visualization.
This is only the start. Recently, the Forest Service started using Google Cloud’s processing and analysis tools for projects like California’s Wildfire and Forest Resilience Action Plan. Forest Service researchers also use Google Cloud to better understand ecological conditions across landscapes in projects like Fuelcast, which provides actionable intelligence for rangeland managers, fire specialists, and growers, and the Scenario Investment Planning Platform for modeling local and national land management scenarios.
The Forest Service is a pioneer in building technology to help us better understand and care for our planet. With more frequent imaging, rich satellite data sets, and sophisticated database and computation systems, we can view and model the Earth as a large-scale dynamic system.
We are honored and excited to respond to the unique set of requirements of the scientists, engineers, rangers, and firefighters of the USFS, and look forward to years of learning about — and better caring for — our most precious resources.
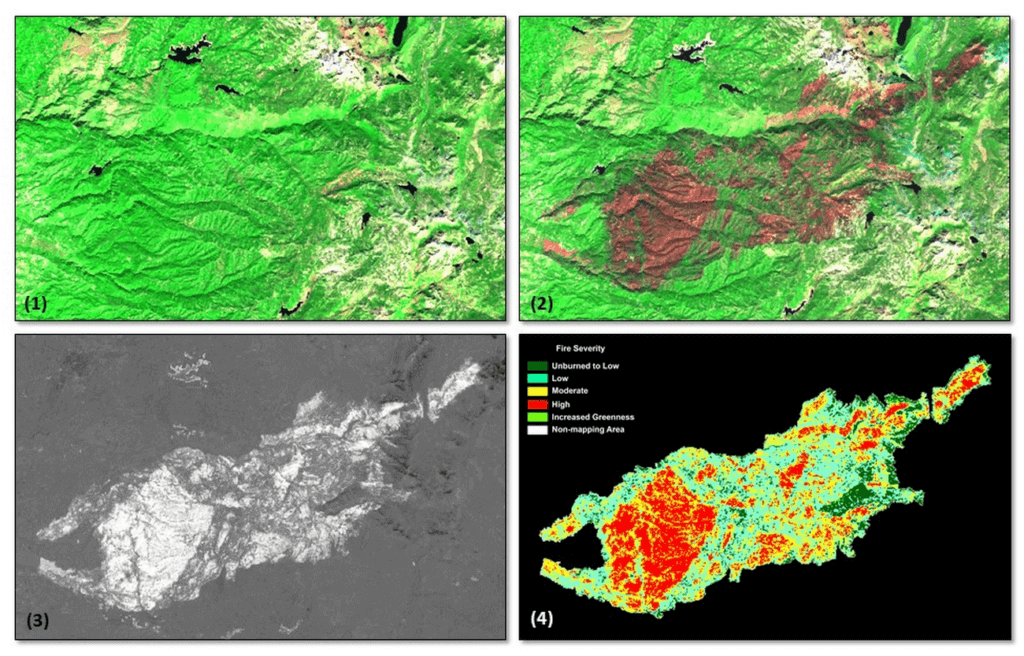
*Image 1: The USDA Forest Service (USFS) Geospatial Technology and Applications Center (GTAC) uses science-based remote sensing methods to characterize vegetation and soil condition after wildland fire events. The results are used to facilitate emergency assessments to support hazard mitigation, to inform post-fire restoration planning, and to support the monitoring of national fire policy effectiveness. GTAC currently conducts these mapping efforts using long-established geospatial workflows. However, GTAC has adapted its post-fire mapping and assessment workflows to work within Google Earth Engine (GEE) to accommodate the needs of other users in the USFS. The spatially and temporally comprehensive coverage of moderate resolution multispectral data sources (e.g., Landsat, Sentinel 2) and analytical power provided by GEE allows users to create geospatial burn severity products quickly and easily. Box 1 shows a pre-fire Sentinel-2 false color composite image. Box 2 shows a post-fire Sentinel-2 false color composite image with the fire scar apparent in reddish brown. Box 3 shows a differenced Normalized Burn Ratio (dNBR) image showing the change between the pre- and post-fire images in Boxes 1 and 2. Box 4 shows a thresholded dNBR image of the burned area with four classes of burn severity (unburned to high severity), which is the final output delivered to forest managers.
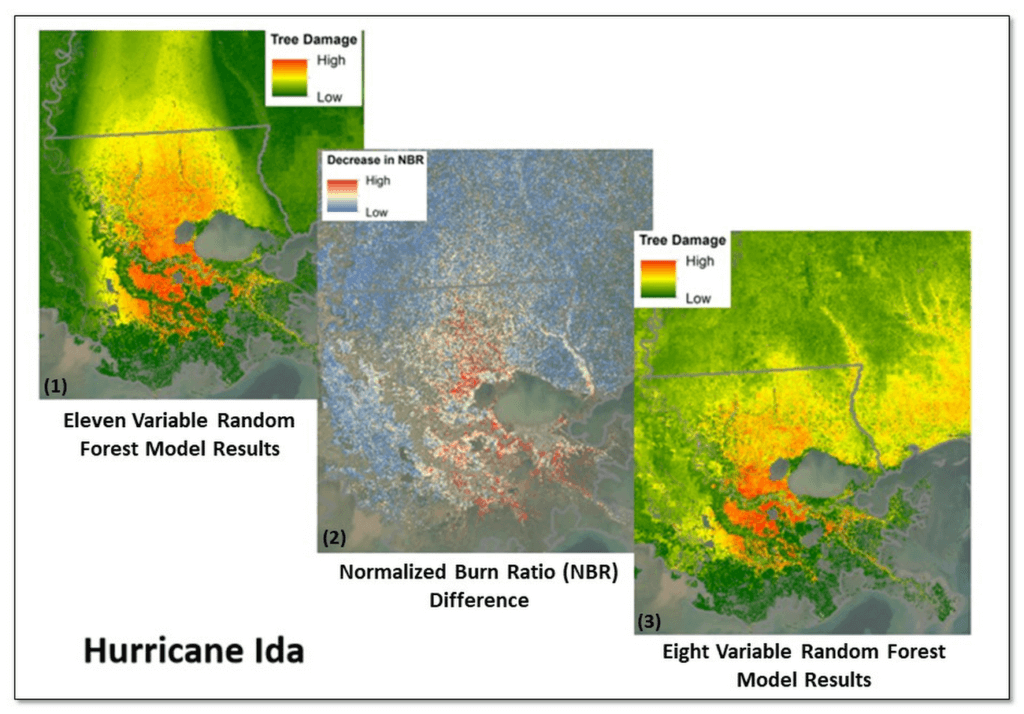
*Image 2: Leveraging Google Earth Engine (GEE), the USDA Forest Service (USFS) Geospatial Technology and Applications Center (GTAC) and USFS Region 8, developed the Tree Structure Damage Impact Predictive (TreeS-DIP) modeling approach to predict wind damage to trees resulting from large hurricane events and produce spatial products across the landscape. TreeS-DIP results become available within 48 hours following landfall of a large storm event to allow allocation of ground resources to the field for strategic planning and management. Boxes 1 and 3 above show TreeS-DIP modeled outputs with varying data inputs and parameters. Box 2 shows changes in greenness (Normalized Burn Ratio; NBR) that was measured with GEE during the recovery from Hurricane Ida and is shown as a visual comparison to the rapidly available products from TreeS-DIP.
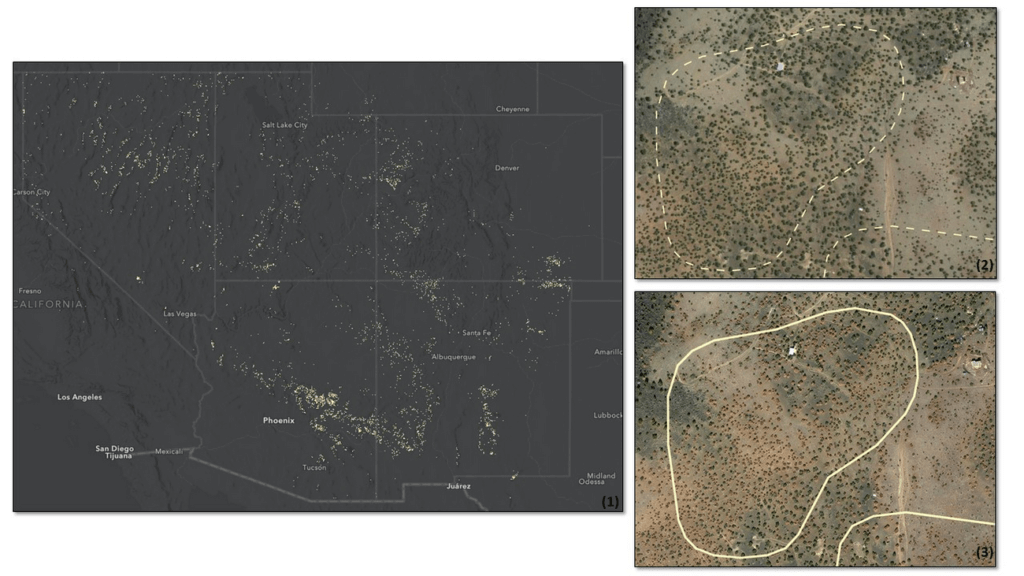
*Image 3: Severe drought conditions across the American West prompted concern about the health and status of pinyon-juniper woodlands, a vast and unique ecosystem. In a cooperative project between the USDA Forest Service (USFS) Geospatial Technology and Applications Center (GTAC) and Forest Health Protection (FHP), Google Earth Engine (GEE) was used to map pinyon pine and juniper mortality across 10 Western US States. The outputs are now being used to plan for future work including on-the-ground efforts, high-resolution imagery acquisitions, aerial surveys, in-depth mortality modeling, and planning for 2022 field season work.
Box 1 contains remote sensing change detection outputs (in white) generated with GEE, showing pinyon-juniper decline across the Southwestern US. Box 2 shows NAIP imagery from 2017 with, with box 3 showing NAIP imagery from 2021. NAIP imagery from these years shows trees changing from healthy and green in 2017 to brown and dying in 2021. In addition, box 2 and box 3 show change detection outputs from Box 1 for a location outside of Flagstaff, AZ converted to polygons (in white). The polygon in box 2 is displayed as a dashed line to serve as a reference, while the solid line in box 3 shows the measured change in 2021. Converting rasters to polygons allows the data to be easily used on tablet computers, as well as the ability to add information and photographs from field visits.
5115
Of your peers have already watched this video.
1:47 Minutes
The most insightful time you'll spend today!
How adidas’s Marketing Team Benefits from Google Cloud Marketing Platform
We live in a world where the consumer journey is no longer linear, making it difficult to know when to deliver a brand message or a product message.
“We talk a lot about the consumer journey no longer being linear. It’s very difficult to know when the consumer is going to come in contact with your message. And because of that it makes it much harder to deliver the right message at the right time,” says Chris Murphy, Head of Digital Experience, adidas.
To solve the problem, adidas turned to the Google Cloud Marketing Platform to use audience insights to inform the art of storytelling and help teams, from brand marketing to retail to e-commerce, deliver relevant messages across channels.
“In a singular environment like Google Cloud Marketing Platform, when you’re able to see audience insights and information…we know when someone should be receiving a brand message versus a product message — when they’re thinking about buying or when they’re actually ready to purchase,” says Murphy.
It wasn’t easy at the start. “Being in brand marketing for so long, there was this initial pushback on data and the science behind it, because it was an art. But what we’re seeing now is the ability for data and insights to really inform the art of storytelling. It allows us to understand the impact that we’re having in real time,” says Kelly Olmstead, VP, Brand Activation for North America, adidas.
Today adidas’ marketing team depends more heavily on data and analysis to guide its strategy. “Starting every meeting with data and insights, that’s something that we want to take outside of just the marketing organization, and really infuse it across our culture here at adidas,” says Olmstead.
Watch how adidas benefits from using the Google Cloud Marketing Platform.
2843
Of your peers have already watched this video.
31:00 Minutes
The most insightful time you'll spend today!
Tools to Simplify Streaming Analytics
Streaming analytics is transforming how companies interact with their customers and operate with agility.
Dataflow supports a number of features to guide you through your journey to adopt streaming, including notebooks for writing your first pipeline, SQL to accelerate your streaming deployments, Flex Templates to scale streaming in your organization, and enhanced monitoring for operating your pipelines at scale.
In this video Mehran Nazir, Product Manager, Google Cloud, introduces Beam and Dataflow, and other tools, and how to start, how to scale and how to optimize. See how these capabilities can set you up for streaming success.
More Relevant Stories for Your Company

How to Enhance Incremental Pipeline Performance while Ingesting Data into BigQuery
When you build a data warehouse, the important question is how to ingest data from the source system to the data warehouse. If the table is small you can fully reload a table on a regular basis, however, if the table is large a common technique is to perform incremental

Build Open Data Platform on GCP with Delta Lake, Presto and Dataproc
Organizations today build data lakes to process, manage and store large amounts of data that originate from different sources both on-premise and on cloud. As part of their data lake strategy, organizations want to leverage some of the leading OSS frameworks such as Apache Spark for data processing, Presto as a query engine and
Google Cloud Helped Digitec Galaxus Personalize Over 2 Million Newsletters in a Week
Digitec Galaxus AG is the biggest online retailer in Switzerland, operating two online stores: Digitec, Switzerland's online market leader for consumer electronics and media products, and Galaxus, the largest Swiss online shop with a steadily growing range of consistently low-priced products for almost all daily needs. Known for its efficient, personalized shopping experiences,

A Pre-ML Checklist That Will Save You Hours of Work
One of the toughest challenges for data scientists, and big data engineers is gathering, preparing, and transforming data, and creating data pipelines. Gathering data for a machine learning or big data initiative can be hard work. The mere act of getting it all together can leave data teams so excited
