





4901
Of your peers have already watched this video.
11:30 Minutes
The most insightful time you'll spend today!
Driving Business Transformation in Manufacturing, Industrial, and Transportation Using Google Cloud and AI/ML
Google Cloud partners closely with manufacturing, industrial, and transportation organizations to drive business transformation.
In this video, Mandeep Waraich, Head of Product – Industrial AI, Google Cloud, shares customer stories as well as Google Cloud’s differentiated AI products and solutions.
Waraich covers the current state of automation and industrial efficiency and how artificial intelligence is revealing an entirely new universe of possibilities.
He also speaks about Google Cloud’s approach to bringing these AI technologies to the market, and Google Cloud’s “deploy anywhere” methodology that helps achieve the impact of AI at a global enterprise scale.
Google Cloud VMware Engine Achieves HIPAA Compliance
6979
Of your peers have already read this article.
1:30 Minutes
The most insightful time you'll spend today!
We are excited to announce that as of April 1, 2021, Google Cloud VMware Engine is covered under the Google Cloud Business Associate Agreement (BAA), meaning it has achieved HIPAA compliance. Healthcare organizations can now migrate and run their HIPAA-compliant VMware workloads in a fully compatible VMware Cloud Verified stack running natively in Google Cloud with Google Cloud VMware Engine, without changes or re-architecture to tools, processes, or applications.
Healthcare organizations increasingly use cloud platforms to personalize patient care, analyze large datasets more effectively, enhance research and development collaboration, and share medical knowledge. Leveraging cloud platforms can also help healthcare organizations increase the privacy and security of information systems, including protected health information (PHI), and, as a result, better comply with applicable laws and regulations while reducing the burden of compliance. For PHI, the Health Insurance Portability and Accountability Act of 1996 (HIPAA) set standards in the United States to protect individually identifiable health information. HIPAA applies to health plans, most healthcare providers, and healthcare clearinghouses that manage PHI electronically, and to persons or entities that perform certain functions on their behalf.
With Google Cloud, organizations can leverage solutions that enable secure, continuous patient care and data-driven clinical and operational decisions with ease, while being empowered with collaboration and productivity tools. Further, Google Cloud Platform supports HIPAA compliance. We offer HIPAA-regulated customers the same products at the same pricing that is available to all customers, unlike many other cloud providers.
For healthcare organizations that leverage VMware on-premises, having a consistent, cloud-integrated platform that provides seamless access to native cloud services unlocks the opportunity to extend, migrate, and modernize healthcare IT infrastructure and applications in a fast, low-risk manner at their own pace. This is especially important for mission-critical healthcare provider workloads, where having a low-risk way to adopt the cloud is important. Google Cloud VMware Engine offers that solution. By achieving coverage under Google Cloud’s BAA, Google Cloud VMware Engine enables healthcare organizations to realize the benefits of cloud computing and stay on track with their HIPAA compliance efforts without additional complexity. This is very relevant in hybrid scenarios, where customers would like to leverage other native cloud services such as analytics and big data processing, without having to enter into multiple BAAs.
Google Cloud VMware Engine offers dedicated, isolated software-defined datacenter environments with fully redundant and dedicated 100 Gbps networking that are suitable for healthcare organizations to run applications storing and processing PHI data. Customers have the ability to encrypt their virtual storage area network (vSAN) using an external key management server. Healthcare customers can run their workloads in a native VMware environment—vSphere, vCenter, vSAN, NSX-T, and HCX—while benefiting from Google Cloud’s highly performant infrastructure to meet the needs of their workloads. Customers can connect their VMware applications to native Google Cloud services such as BigQuery and artificial intelligence (AI) to derive new insights from existing data and quickly make informed decisions.
Protecting against and mitigating the impact of ransomware attacks is top-of-mind for Healthcare organizations. This requires building a cyber resilience program and back-up strategy to prepare for how users can restore core systems or assets affected by a security (in this case, ransomware) incident. This is a critical function for supporting recovery timelines and lessening the impact of a cyber event so organizations can get back to operating their business. Google Cloud VMware Engine in combination with Google Cloud first party solutions such as Actifio Go, or partner solutions such as NetApp CVO can provide an efficient way to recover incremental point-in-time backups along with on-demand provisioning of new compute to recover both data and infrastructure from Ransomware attacks quickly and efficiently.
Healthcare customers can also use Google Cloud VMware Engine as a disaster recovery (DR) target for their on-premises VMware workloads. Healthcare organizations also need a business continuity plan for their mission critical applications. When a disaster occurs, hospitals need their data protected so they can quickly get back to treating patients. It is a HIPAA requirement that healthcare organizations must be able to recover from a natural disaster. Google Cloud VMware Engine offers a like-for-like cost-effective DR target for these customers. The DR environment can be operated without new training using the same tools as their on-premises deployment. Google Cloud VMware Engine is currently available in 12 regions across the globe including three regions in the US, which means our regional and multi-national customers can take advantage of this service for geographic diversification as well.
If you are interested in understanding more and taking advantage of Google Cloud VMware Engine, contact your Google sales team now.
For details, see HIPAA compliance on Google Cloud Platform.
Trading and Investment Companies will Increase Consumption of Cloud Services: Study Confirms

4898
Of your peers have already read this article.
3:00 Minutes
The most insightful time you'll spend today!
While some traditional financial services companies have more slowly transitioned to the cloud, capital markets firms have embraced cloud computing across their entire value chains — front-, middle-, and back-office. We wanted to understand the dynamics behind this rapid adoption, the most common use cases, and the types of technology most in use, particularly as it relates to market data. Google Cloud commissioned Coalition Greenwich to survey 102 institutional capital markets professionals — at exchanges, trading systems, data aggregators, data producers, asset managers, hedge funds, and investment banks — in the United States, Canada, France, Germany, Italy, the Netherlands, Switzerland, and the United Kingdom.
Our research found that while there are many drivers, demand for easier accessibility is fueling widespread adoption of cloud-based market data services, and associated trading infrastructures, across the buy side and sell side. In fact, 68% of sell-side and buy-side users find it critical for market data providers to offer public cloud-based data services. At the same time, exchanges, market data providers, aggregators, and trading systems are embracing the cloud as a delivery model by offering access to data directly via their own cloud services, APIs or partners.
Here were five noteworthy takeaways from the study:
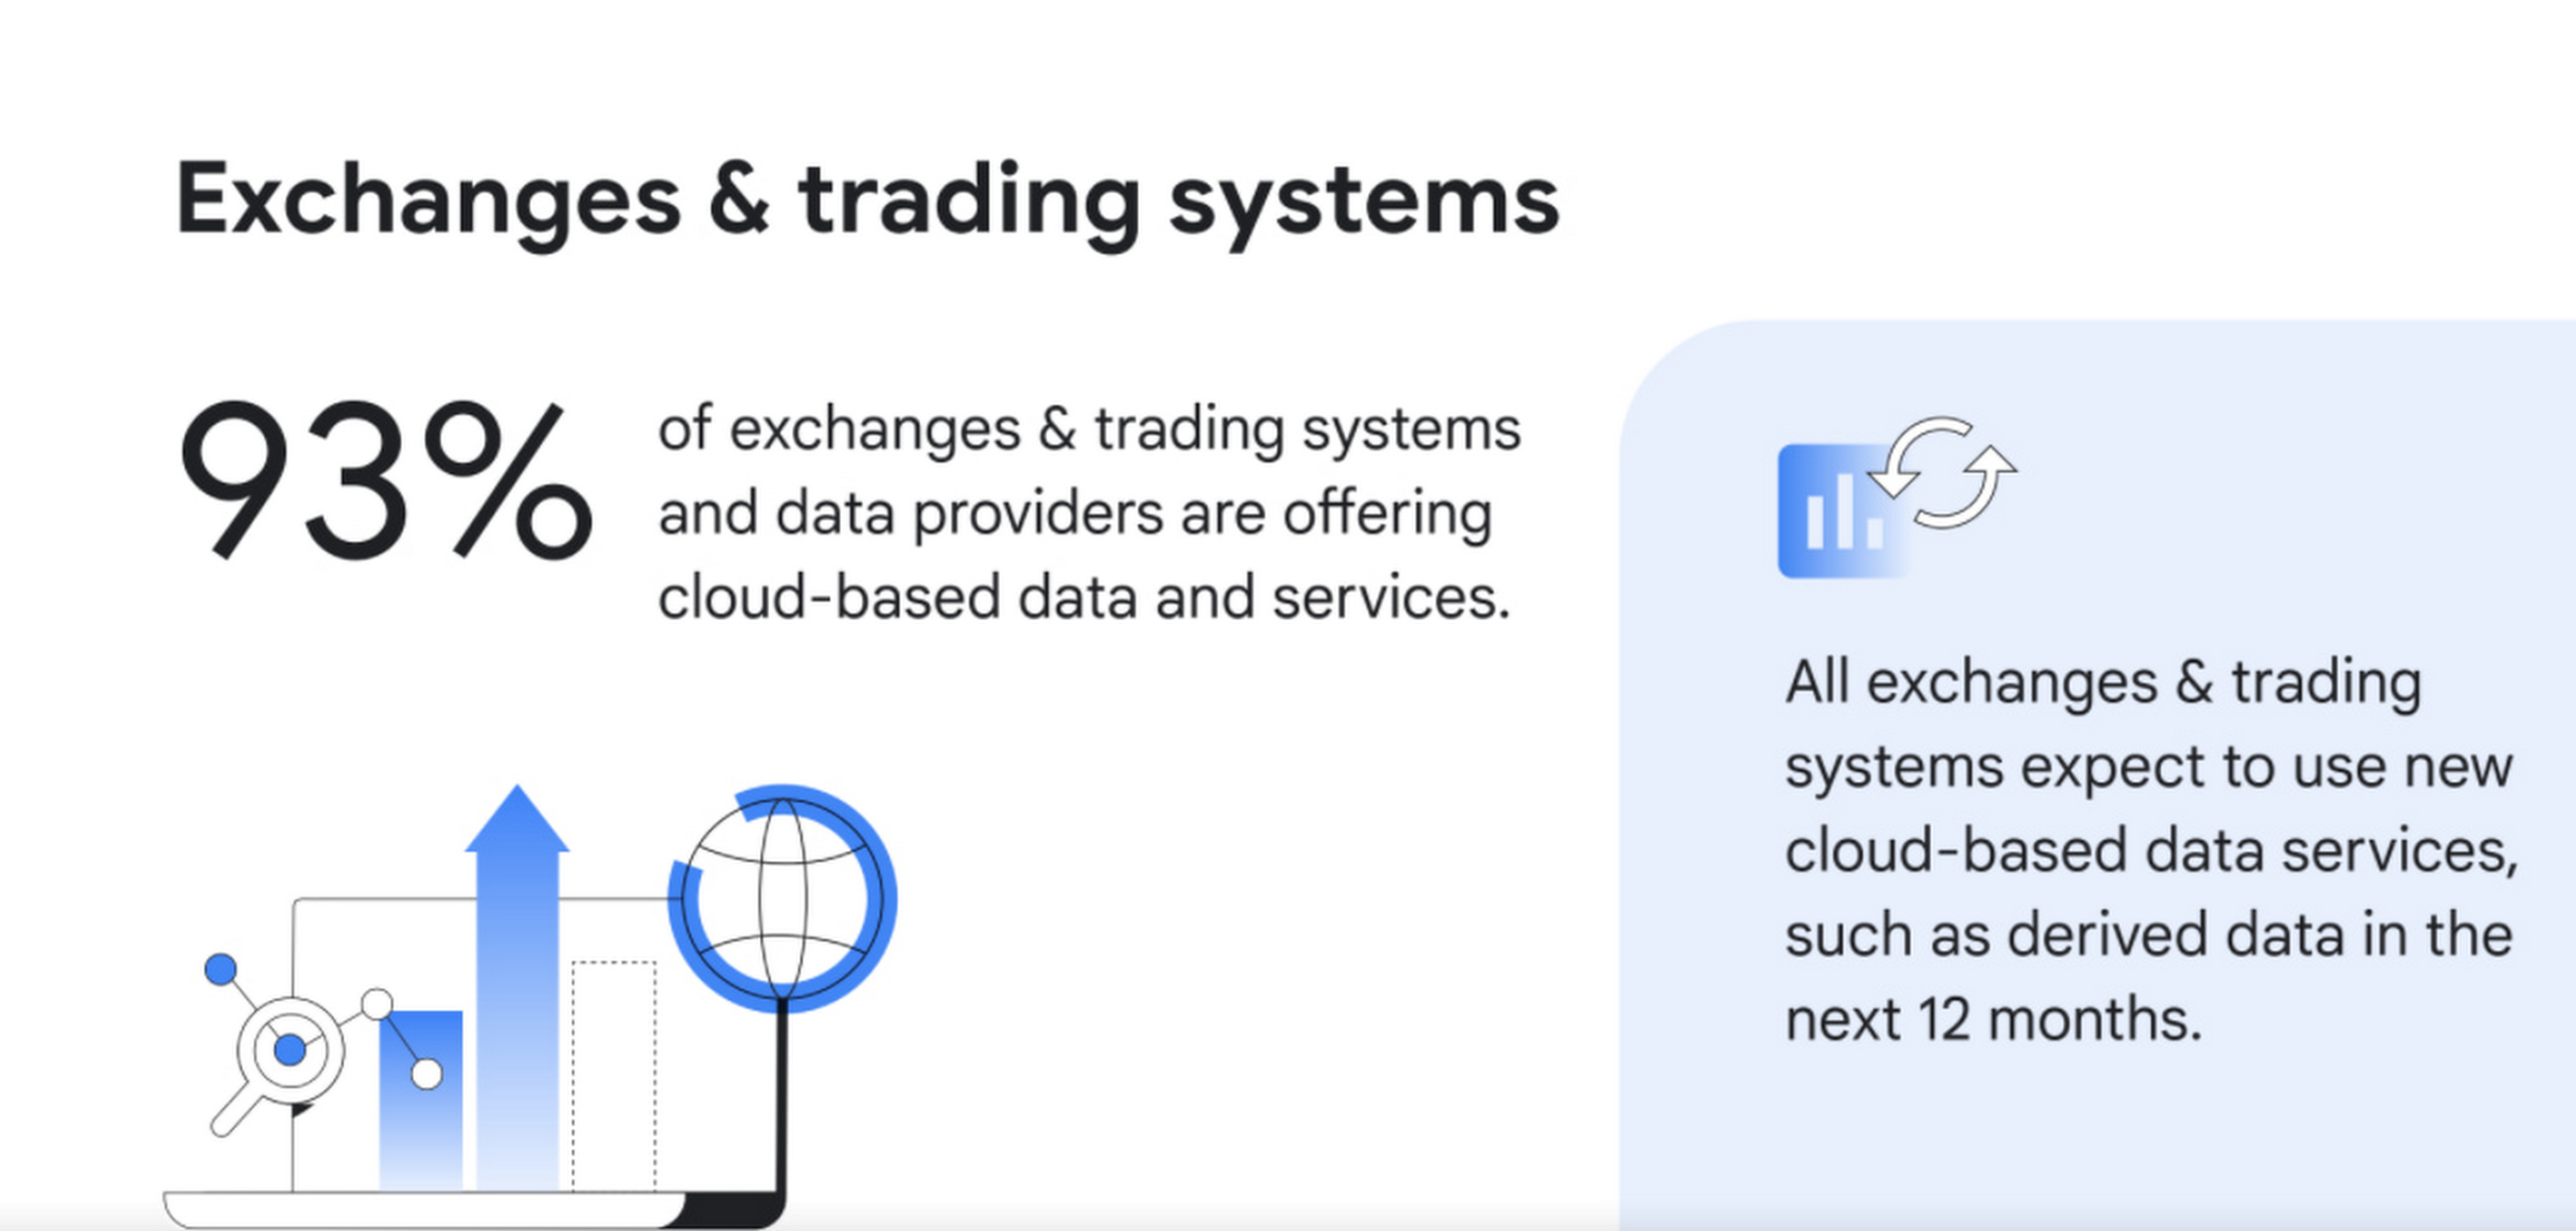
1. Cloud services are becoming ubiquitous for data delivery. Today, the cloud is pervasive, with 93% of exchanges, trading systems and data providers offering cloud-based data and services, according to surveyed executives. Moreover, 100% of those surveyed intend to offer new cloud-based services, such as derived data, in the next 12 months.
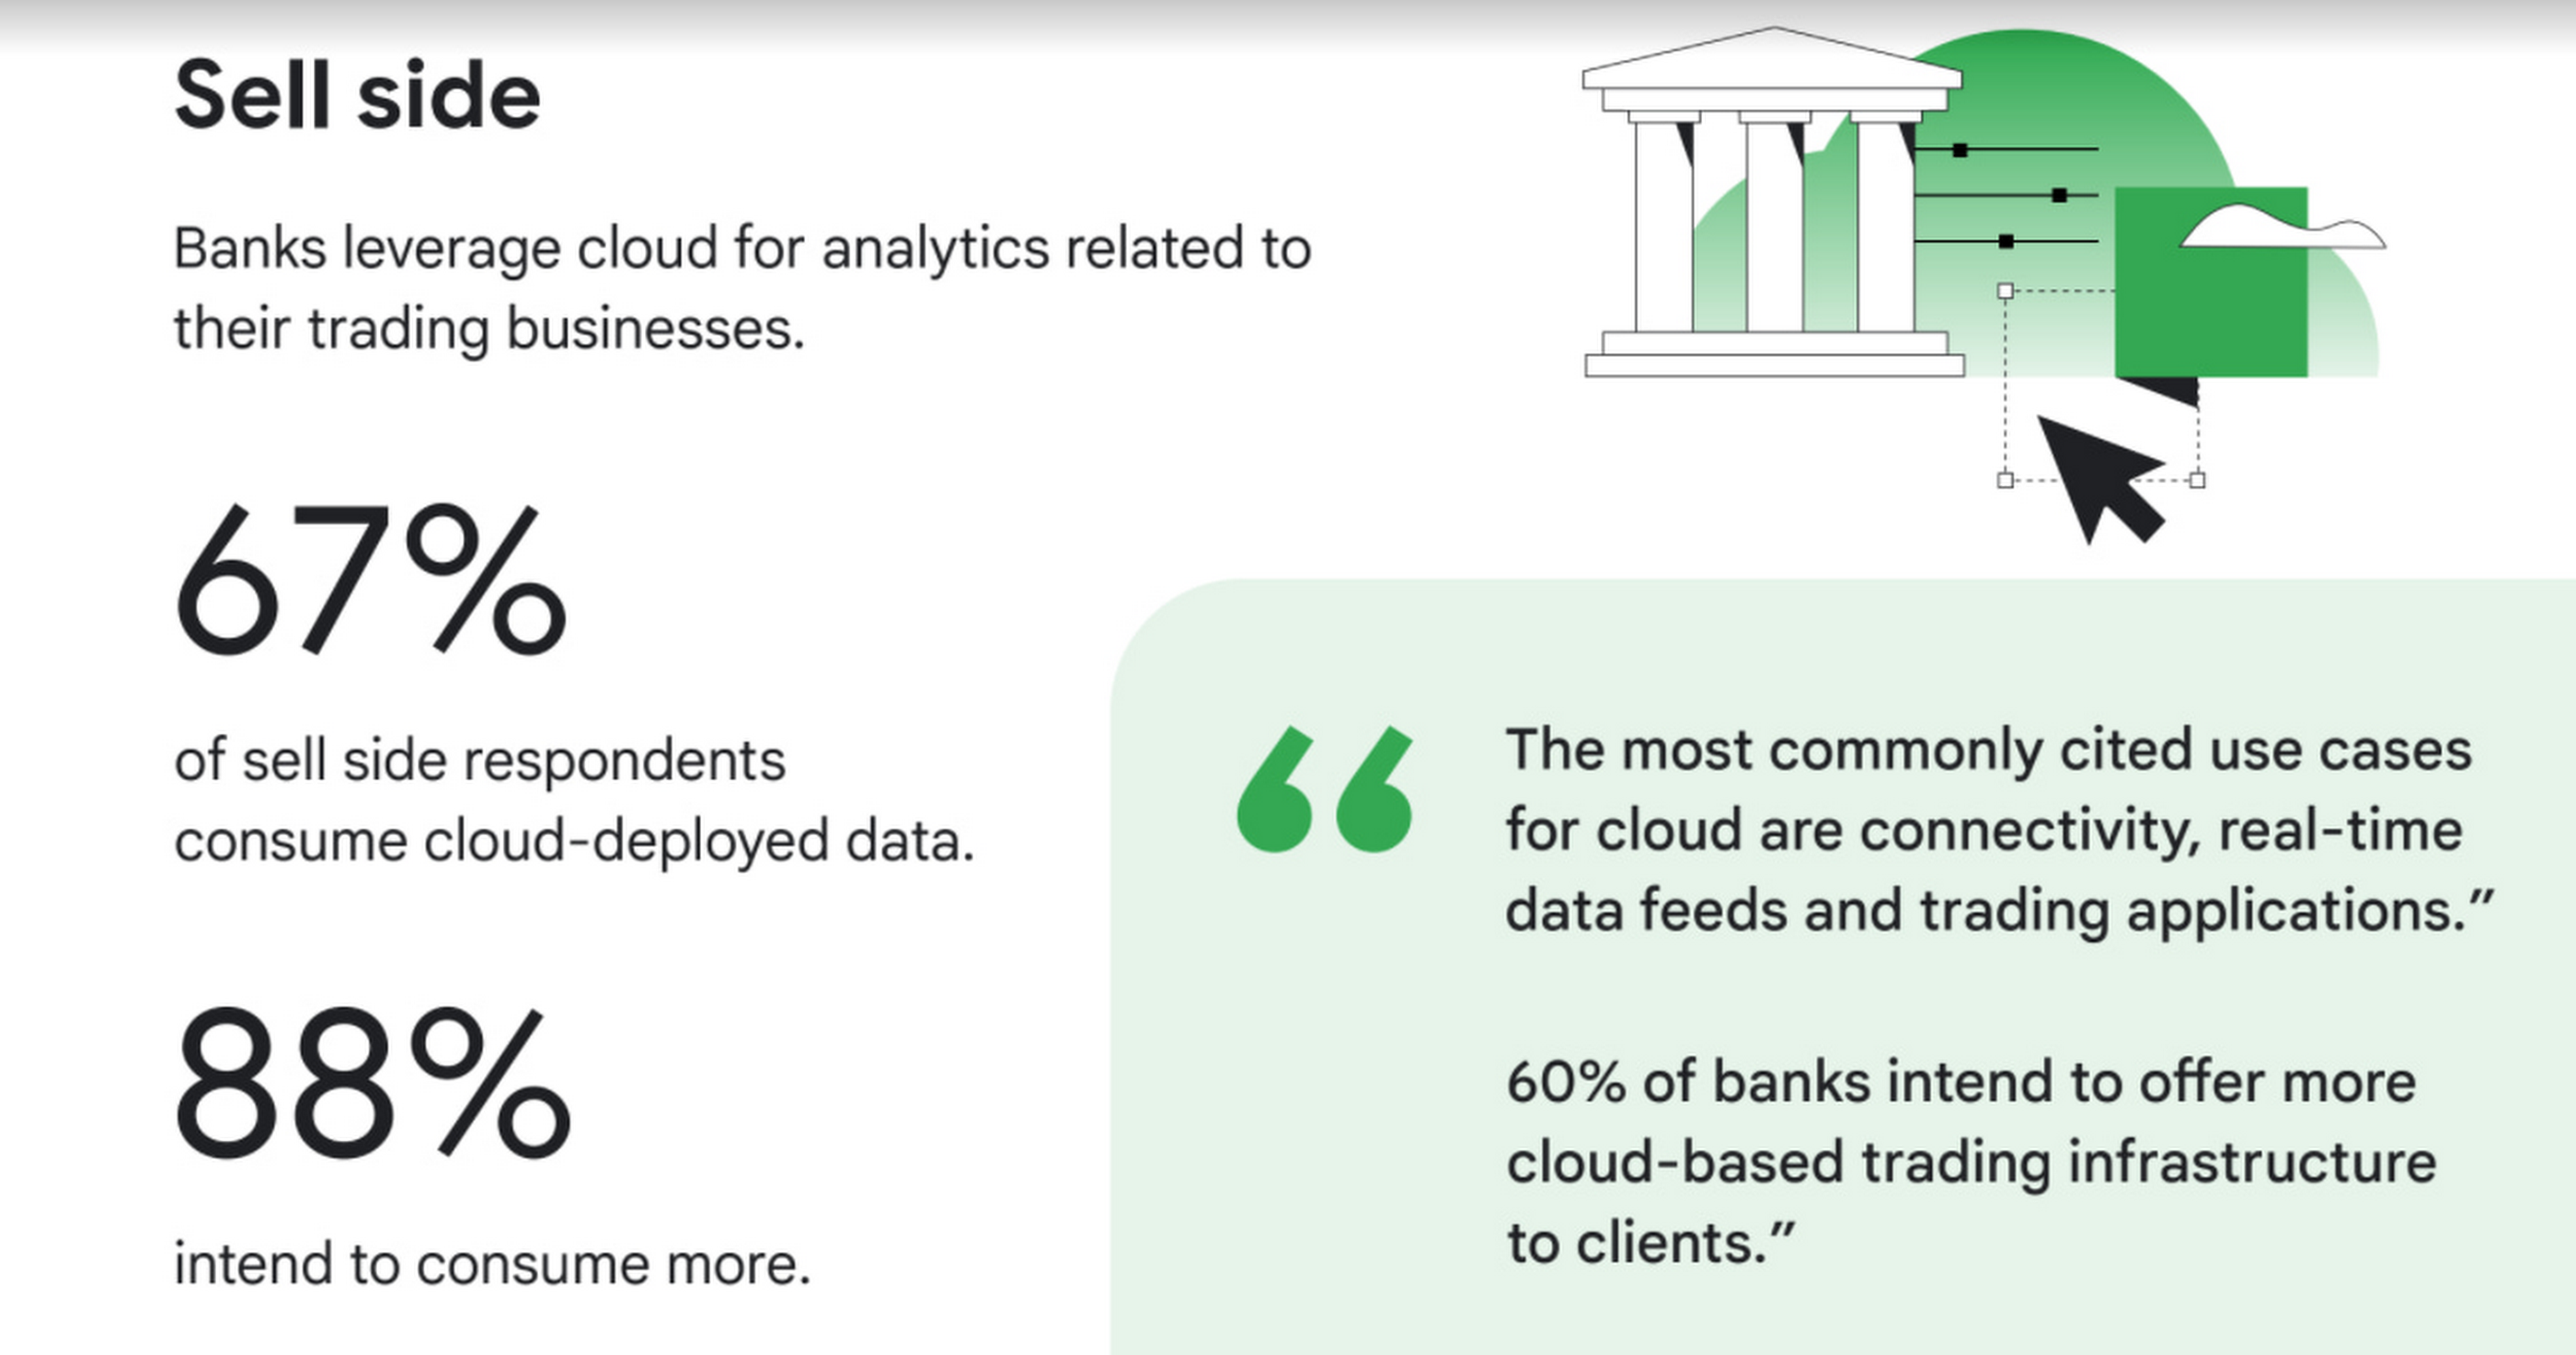
2. Commercial and investment banks are offering additional connectivity, real-time data feeds, and trading applications delivered via the cloud,demonstrating that it’s not only exchanges, trading systems, and data providers that are moving rapidly to the cloud. Internal use cases abound as well, with 67% of those surveyed consuming cloud-deployed market data, primarily for data analytics. 88% of surveyed sell-side firms intend to consume cloud-based market data services, with digital transformation, data science and quant research as the top use cases.
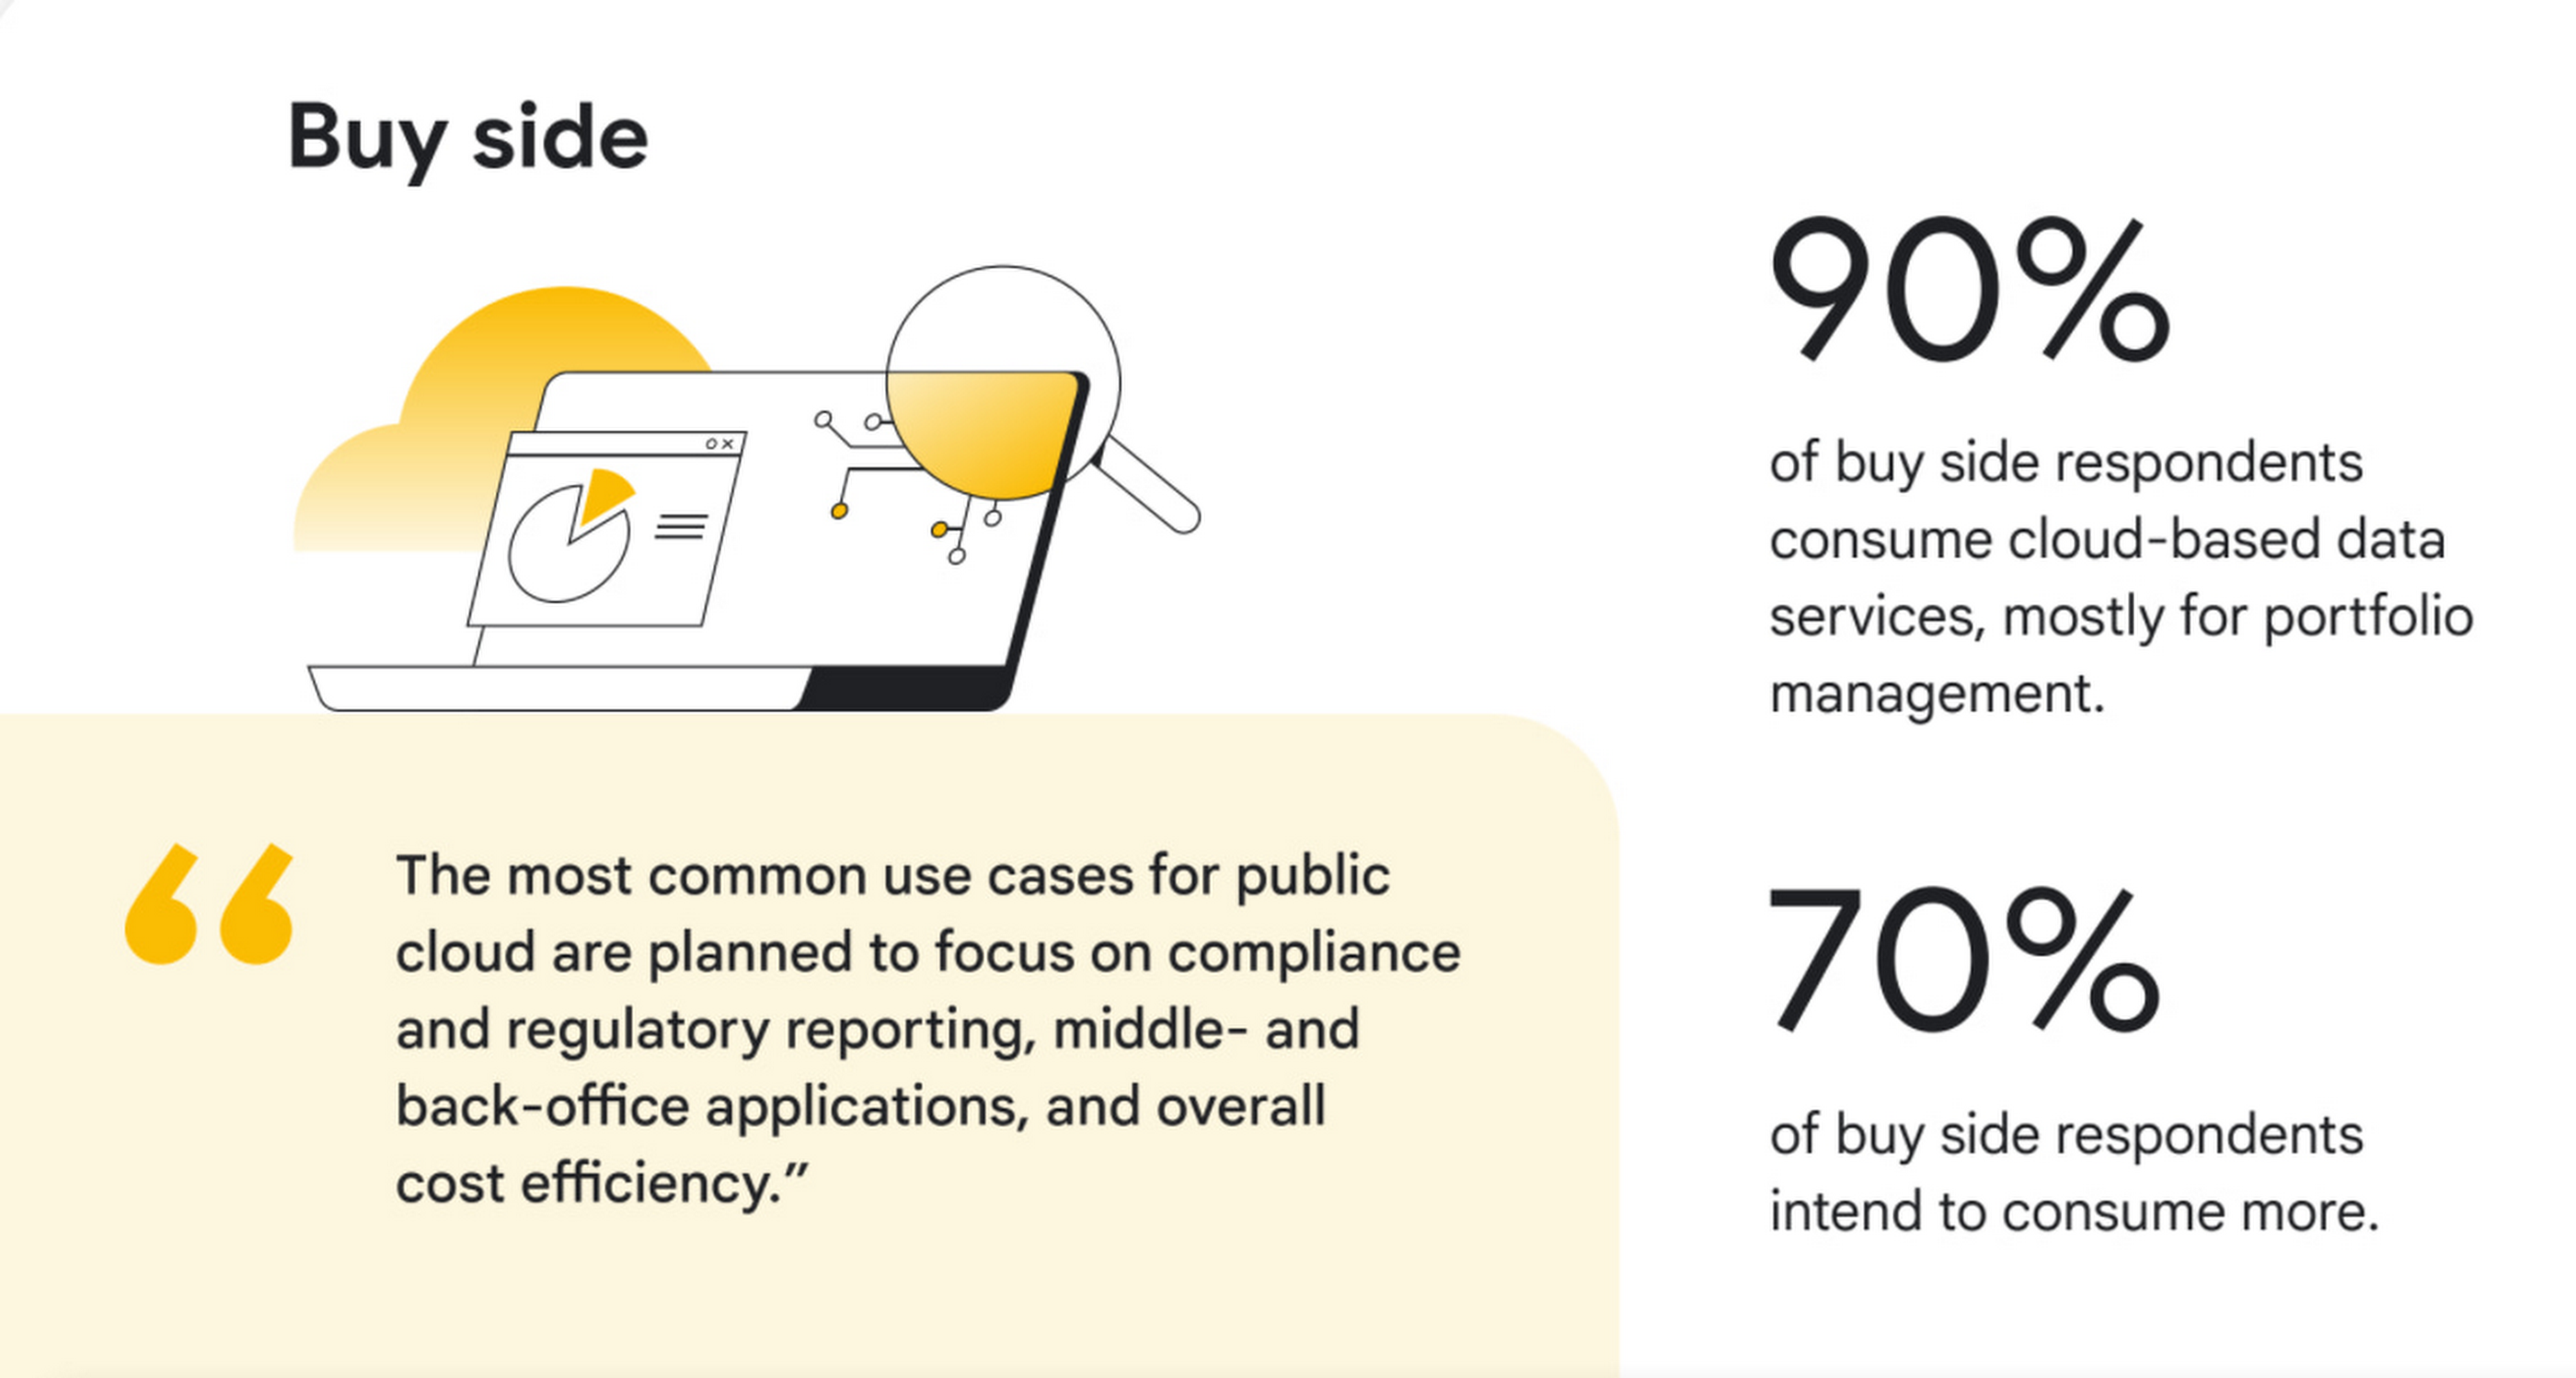
3. Buy side firms will consume even more cloud-deployed data. Today, 90% of surveyed buy-side firms are consuming cloud-deployed market data, mostly for portfolio management. 70% of buy-side firms intend to consume more public cloud-based market data services in the next 12 months, adding services such as compliance and regulatory reporting.
4. AI/ML, powered by cloud, is moving out of the pilot phase and into mainstream use. Today, 50% of exchanges, trading systems, and data providers are offering data products or services powered by AI/ML, and of those, 42% intend to offer AI-powered trade execution and trading analytics services in the next 12 months. Within commercial and investment banks, 55% said they are currently using AI/ML in the cloud, and while that was true for only 14% of overall buy-side respondents, 44% of large buy-side respondents are using it.

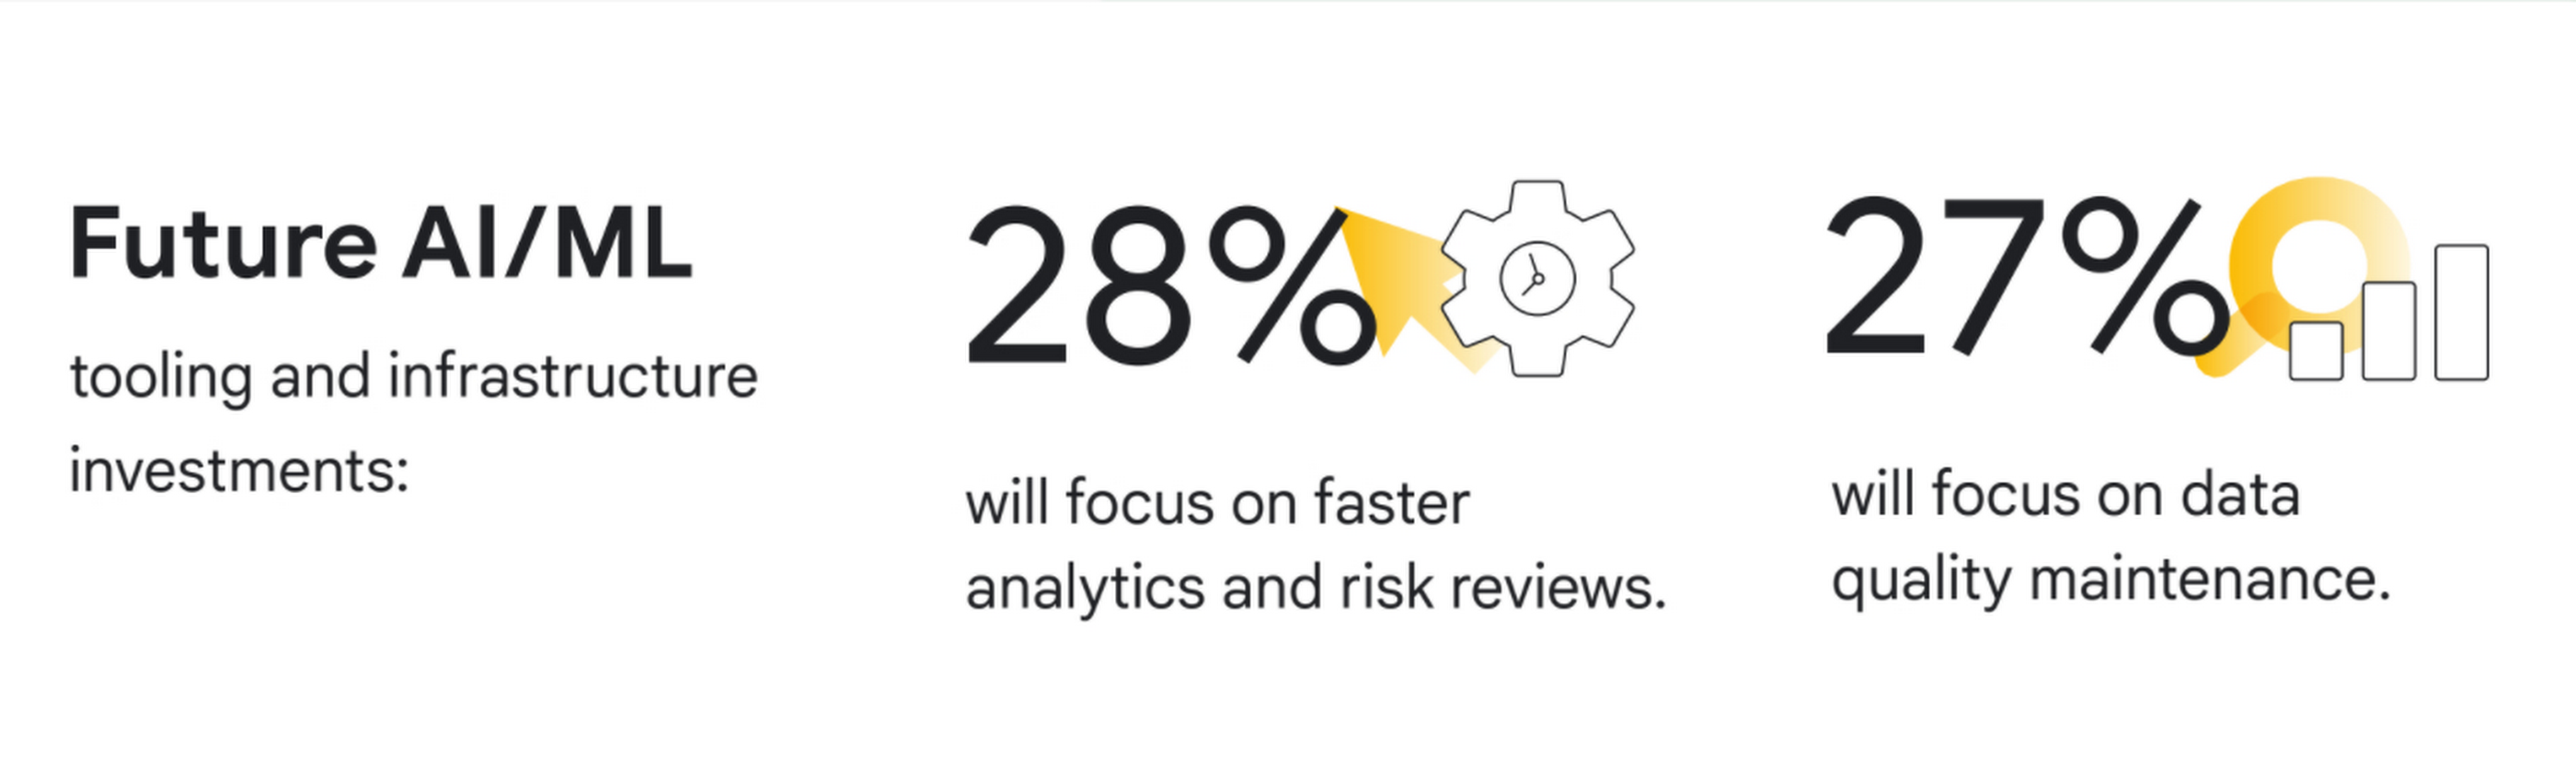
5. Exchanges, trading systems, and data providers are prioritizing public cloud for internal insights. 71% of these firms are using the public cloud, mostly for data transmission, processing, analysis, and long-term data storage. Over the next 12 months, 33% of new public cloud workloads will focus on data mining, data insights and advanced analytics, while 28% of new AI/ML tooling and infrastructure investments will focus on faster analytics and risk reviews, and 27% on data quality maintenance.
“We see new, dramatic shifts on the adoption of cloud across market data,” said David Easthope, Senior Analyst for Coalition Greenwich. “And we expect further proliferation of cloud-based services and greater consumption across the trading and investing lifecycle.”
Conclusions and future predictions
Based on the survey results, Coalition Greenwich predicts five following trends over the next 12 months:
- Exchanges and trading systems will continue to launch a wide array of new cloud-based and possibly cloud exclusive data services across derived data, end of day data, reference data and pricing data.
- Data providers will launch new data products such as pre-trade analytics powered by AI/ML in the cloud.
- Commercial and investment banks will offer additional connectivity, real-time data feeds, and trading applications delivered via the cloud.
- Buy-side firms will consume even more cloud-deployed data, including real-time market data, portfolio management data, and risk analytics.
- Exchanges, trading systems and data providers will explore proof-of-concepts around core systems on the cloud. Improvements to AI/ML tooling or infrastructure will ramp up as firms seek more rapid responses to risk initiatives.
To learn more about these findings, download our two full reports, The Future of market data: Distribution and consumption through cloud and AI and Exchanges and data providers: Prioritizing the cloud and AI for internal insights or our short infographic.
Research methodology
The survey was conducted online by Coalition Greenwich on behalf of Google Cloud from March 2021 to April 2021 among 102 executives in North America (n=82), EMEA (n=17) and other (n=3) who are employed full-time and who are participants or influencers in decisions around cloud and/or senior management with a role at a company which is an institutional asset manager, hedge fund, alternative investment manager, exchange and/or trading system, information provider, information aggregator, or other asset manager/asset owner. The survey included wide perspectives from a range of firm size and asset class focus, including equity, fixed income, FX, commodities, multi-asset, and other asset classes.
Foot Notes
1. We defined market data as direct feeds, consolidated feeds, terminal and desktop products, security and reference data, pricing data, historical data, alternative data, and index data.
Make Meaningful Analysis with Geo Boundary Public Datasets on BigQuery

6356
Of your peers have already read this article.
4:00 Minutes
The most insightful time you'll spend today!
Geospatial data is a critical component for a comprehensive analytics strategy. Whether you are trying to visualize data using geospatial parameters or do deeper analysis or modeling on customer distribution or proximity, most organizations have some type of geospatial data they would like to use – whether it be customer zipcodes, store locations, or shipping addresses. However, converting geographic data into the correct format for analysis and aggregation at different levels can be difficult. In this post, we’ll walk through some examples of how you can leverage the Google Cloud platform alongside Google Cloud Public Datasets to perform robust analytics on geographic data. The full queries can be accessed from this notebook here.
Public US Geo Boundaries dataset
BigQuery hosts a slew of public datasets for you to access and integrate into your analytics. Google pays for the storage of these datasets and provides public access to the data via the bigquery-public-data project. You only pay for queries against the data. Plus, the first 1 TB per month is free! These public datasets are valuable on their own, but when joined against your own data they can unlock new analytics use cases and save the team a lot of time.
Within the Google Cloud Public Datasets Program there are several geographic datasets. Here, we’ll work with the geo_us_boundaries dataset, which contains a set of tables that have the boundaries of different geospatial areas as polygons and coordinates based on the center point (GEOGRAPHY column type in BigQuery), published by the US Census Bureau.

Mapping geospatial points to hierarchical areas
Many times you will find yourself in situations where you have a string representing an address. However, most tools require lat/long coordinates to actually plot points. Using the Google Maps Geocoding API we can convert an address into a lat/long and then store the results in the BigQuery table.
With a lat/long representation of our point, we can join our initial dataset back onto any of the tables here using the ST_WITHIN function. This allows us to check and see if a point is within the specified polygon.
ST_WITHIN(geography_1, geography_2)
This can be helpful for ensuring standard nomenclature; for example, metropolitan areas that might be named differently. The query below maps each customers’ address to a given metropolitan area name.
SELECTcust.id as customer_id,metro.name as metro_nameFROM `looker-private-demo.retail.customers` as cust,`bigquery-public-data.geo_us_boundaries.metropolitan_divisions` as metroWHERE ST_WITHIN(ST_GEOGPOINT(cust.longitude, cust.latitude),metro.metdiv_geom)
It can also be useful for converting to designated market area (DMA), which is often used in creating targeted digital marketing campaigns.
SELECTcust.id as customer_id,dma.dma_nameFROM `looker-private-demo.retail.customers` as cust,`bigquery-public-data.geo_us_boundaries.designated_market_area` as dmaWHERE ST_WITHIN(ST_GEOGPOINT(cust.longitude, cust.latitude),dma.dma_geom)
Or for filling in missing information; for example, some addresses may be missing zip code which results in incorrect calculations when aggregating up to the zipcode level. By joining onto the zip_codes table we can ensure all coordinates are mapped appropriately and aggregate up from there.
SELECTzip.zip_code,count(distinct cust.id) as unique_customersFROM `looker-private-demo.retail.customers` as cust,`bigquery-public-data.geo_us_boundaries.zip_codes` as zipWHERE ST_WITHIN(ST_GEOGPOINT(cust.longitude, cust.latitude),zip.zip_code_geom)GROUP BY 1
Note that the zip code table isn’t a comprehensive list of all US zip codes, they are zip code tabulation areas (ZCTAs). Details about the differences can be found here. Additionally, the zip code table gives us hierarchical information, which allows us to perform more meaningful analytics. One example is leveraging hierarchical drilling in Looker. I can aggregate my total sales up to the country level, and then drill down to state, city and zipcode to identify where sales are highest. You can also use the BigQuery GeoViz tool to visualize geospatial data!

Aside from simply checking if a point is within an area, we can also use ST_DISTANCE to do something like find the closest city using the centerpoint for the metropolitan area table.
SELECTcust.id as customer_id,ARRAY_AGG(metro.name order by ST_DISTANCE(ST_GEOGPOINT(cust.longitude, cust.latitude),metro.internal_point_geom) asc limit 1)[offset(0)] as metro_nameFROM`looker-private-demo.retail.customers` as cust,`bigquery-public-data.geo_us_boundaries.metropolitan_divisions` as metroGROUP BY cust.id
This concept doesn’t just hold true for points, we can also leverage other GIS functions to see if a geospatial area is contained within areas that are listed in the boundaries datasets. If your data comes into BigQuery as a GeoJSON string, we can convert it to a GEOGRAPHY type using the ST_GEOGFROMGEOJSON function. Once our data is in a GEOGRAPHY type we can do things like check to see what urban area the geo is within – using either ST_WITHIN or ST_INTERSECTS to account for partial coverage. Here, I am using the customer’s zip code to find all metropolitan divisions where the zip code polygon and the metropolitan polygon intersect. I am then selecting the metropolitan area that has the most overlap (or the intersection has the largest area) to be the customer’s metro that we use for reporting.
SELECTcust.id as customer_id,ARRAY_AGG(metro.name order by ST_AREA(ST_INTERSECTION(zip.zip_code_geom,metro.metdiv_geom)) desc limit 1)[offset(0)] as metro_nameFROM`looker-private-demo.retail.customers` as custJOIN `bigquery-public-data.geo_us_boundaries.zip_codes` as zip on cust.zip=zip.zip_code,`bigquery-public-data.geo_us_boundaries.metropolitan_divisions` as metroWHERE ST_INTERSECTS(zip.zip_code_geom,metro.metdiv_geom)GROUP BY cust.id
The same ideas can be applied to the other tables in the dataset including the county, urban areas and National Weather Service forecast regions (which can also be useful if you want to join your datasets onto weather data).
Correcting for data discrepancy
One problem that we may run into when working with geospatial data is that different data sources may have different representations of the same information. For example, you might have one system that records state as a two letter abbreviation and another using the full name. Here, we can use the state table to join the different datasets.
SELECTst.state_name,sum(ab.sales+fn.sales) as total_salesFROM `bigquery-public-data.geo_us_boundaries.states` as stLEFT JOIN abbreviated_table as ab on ab.state = st.stateLEFT JOIN fullname_table as fn on fn.state = st.state_nameWHERE COALESCE(ab.state, fn.state) IS NOT NULLGROUP BY 1
Another example might be using the tables as a source of truth for fuzzy matching. If the address is a manually entered field somewhere in your application, there is a good chance that things will be misspelled. Different representations of the same name may prevent tables from joining with each other or lead to duplicate entries when performing aggregations. Here, I use a simple Soundex algorithm to generate a code for each county name, using helper functions from this blog post. We can see that even though some are misspelled they have the same Soundex code.

Next, we can join back onto our counties table so we make sure to use the correct spelling of the county name. Then, we can simply aggregate our data for more accurate reporting.
SELECTc.county_name,sum(sales) as total_salesFROMtableJOIN `bigquery-public-data.geo_us_boundaries.counties` as con testing.dq_fm_Soundex(table.county) = testing.dq_fm_Soundex(c.county_name)WHERE c.state_fips_code = cast(36 as string)GROUP BY 1
Note that fuzzy matching definitely isn’t perfect and you might need to try different methods or apply certain filters for it to work best depending on the specifics of your data.
The US Geo Boundary datasets allow you to perform meaningful geographic analysis without needing to worry about extracting, transforming or loading additional datasets into BigQuery. These datasets, along with all the other Google Cloud Public Datasets, will be available in the Analytics Hub. Please sign up for the Analytics Hub preview, which is scheduled to be available in the third quarter of 2021, by going to g.co/cloud/analytics-hub.
Harnessing the Power of Data and AI to Transform Life Science Supply Chains

3978
Of your peers have already read this article.
3:30 Minutes
The most insightful time you'll spend today!
Global life science supply chains are lengthy and complex with many moving parts. One small disruption can create serious delays and affect your ability to deliver therapeutics for patients.
Supply chain disruptors
Over the last few years, healthcare organizations have encountered a range of obstacles, from both internal and external factors, that have resulted in supply networks failing to get drugs and medical devices to where they need to be on time. These obstacles include:
- Labor and supply shortages
- Rising material costs
- Raw material constraints
- Geo-political events
- Unpredictable weather
How do you overcome supply chain disruptors that are out of your control?
The intelligent healthcare supply chain
While many organizations have already implemented data-driven supply chains, organizations are still faced with the challenges of static, siloed, and different functional supply chain applications; limited data exchange with key trading partners across upstream and downstream operations; and the inability to effectively leverage relevant external data.
At Google Cloud, we believe the key to meaningful and effective change is a data-driven supply chain that allows you to achieve visibility, flexibility, and innovation.
Our solutions help you prepare for the unpredictable and enhance the value of your data. By unlocking AI-driven insights, you can strengthen distribution networks and optimize your workflows and supply chains to become more reliable, intelligent, and sustainable. Some of the business challenges we address include:
- Predicting demand with Vertex AI Forecast
- Visual inspection for quality and predictive maintenance with pre-built ML models
- Automating and optimizing pickup and delivery operations with Cloud Fleet Routing API
- Real time and holistic inventory visibility with Supply Chain Twin
Make sure you’re prepared for the unpredictable with real-time visibility over your distribution networks. Learn how you can harness the power of AI and analytics and gain actionable insights that enhance your supply chain.
Google Cloud and Univision Partnership to Up the Ante in UX for Spanish-speaking Audience

6887
Of your peers have already read this article.
1:00 Minutes
The most insightful time you'll spend today!
The past year has given everyone lots to think about—about our priorities as people and as businesses. As the world retreated behind closed doors, we saw how shared interests and experiences can bring us together. As the world grappled with a common enemy, we witnessed just how differently individuals, communities and indeed entire countries can experience a situation. And as we faced seemingly unending obstacles to making it through the pandemic, we saw how making smart decisions based on data can drive meaningful solutions—fast.
That’s why we here at Google Cloud are so proud to partner Univision, the country’s leading Spanish-language content and media company. By partnering with Google Cloud, Univision will be able to accelerate growth across its portfolio of properties, deliver an enhanced user experience for Spanish-speaking audiences and provide the enterprise solutions needed to create the Spanish-language media company of the future.
According to Instituto Cervantes, there are over 580 million Spanish language speakers worldwide. Those viewers, like people everywhere, are avid consumers of streaming content. In Q4 of 2020 alone, viewing time for that content increased by 44%1, and in 2020, from 50%2 more sources. With that surge in demand, Univision needed a cloud provider whose infrastructure could reach Hispanic viewers around the world. With two-plus decades spent building out its network and data centers, as well as global content-delivery capabilities, Google Cloud has the infrastructure Univision needs to reach viewers across the Spanish-speaking world.
At the same time, with such a diverse audience for their content, Univision needs to target that content to viewers’ specific preferences. By applying Google Cloud’s artificial intelligence (AI) and machine learning (ML) technology across its content, Univision intends to personalize content based on shows users have previously watched, enhancing their engagement and viewing experience.
And as Univision transforms the user experience, it can use Google Cloud’s data and analytics suite to garner deeper insights into its audience and forge stronger relationships with them on an individual basis. With Looker and BigQuery, Univision employees will have access to real-time data to help them make business decisions about programming.
Univision will also migrate video distribution and production operations to Google Cloud, where we’ll help them streamline media workflows and develop innovative new capabilities. Meanwhile, Google Cloud’s tight business and technical integration with other Google services will help ensure Univision reaches viewers on the device of their choice, wherever they are in the world. For example, in the coming years, Univision will expand its global YouTube partnership and will integrate with entertainment features on Google Search that help people better discover TV shows and movies. The company will also use Google Ad Manager for global ad decisioning and Google’s Dynamic Ad Insertion for PrendeTV and future video-on-demand offerings. Finally, Univision will distribute its content and services on Google Play across Android phones and tablets, as well as Google TV and other Android TV OS devices.
We’re thrilled to partner with Univision to help them reach the Spanish-speaking world with their content. With our cloud portfolio, we can help them reach individual viewers around the world, with personalized content that they can consume however they see fit. Best of all, together, we can help them achieve this vision fast, leveraging established cloud, content delivery, and data analytics technologies. You can learn more about the partnership here.
More Relevant Stories for Your Company
What Are India’s Biggest Companies Doing on Google Cloud?
In the last year, there’s been an upward trend in cloud adoption in India. In fact, NASSCOM finds that cloud spending in India is estimated to grow at 30% per annum to cross the US$7 billion mark by 2022. At Google, in our conversations with customers, discussions have evolved beyond cost savings

Google Cloud’s Virtual Appointment Scheduling Tool (VAST) Helps State of Arizona Recover from Unemployment Situation
When the world was forced to go primarily online, state governments also faced the reality of needing to provide community services without the health risk of meeting in person. Old systems that relied on interpersonal contact could not keep up. An unprecedented number of displaced workers swamped every unemployment system.



The Secret to Accelerated ML Model Training
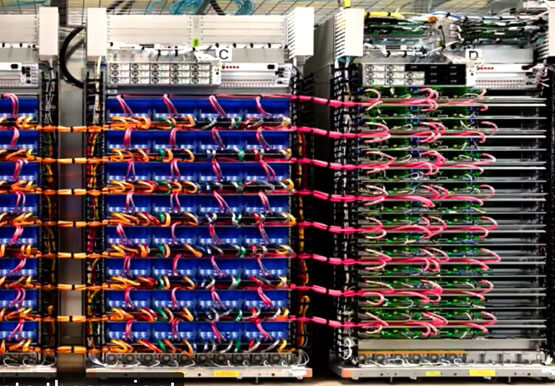
As an infrastructure or a data science professional, it’s more critical than ever to keep abreast of the changes taking place to the infrastructure powering machine learning. If we take a step back, we will realize that there’s been a tremendous amount of progress in machine learning in the last

How to Enhance Incremental Pipeline Performance while Ingesting Data into BigQuery
When you build a data warehouse, the important question is how to ingest data from the source system to the data warehouse. If the table is small you can fully reload a table on a regular basis, however, if the table is large a common technique is to perform incremental
