





How to Enhance Incremental Pipeline Performance while Ingesting Data into BigQuery

6331
Of your peers have already read this article.
3:00 Minutes
The most insightful time you'll spend today!
When you build a data warehouse, the important question is how to ingest data from the source system to the data warehouse. If the table is small you can fully reload a table on a regular basis, however, if the table is large a common technique is to perform incremental table updates. This post demonstrates how you can enhance incremental pipeline performance when you ingest data into BigQuery.
Setting up a standard incremental data ingestion pipeline
We will use the below example to illustrate a common ingestion pipeline that incrementally updates a data warehouse table. Let’s say that you ingest data into BigQuery from a large and frequently updated table in the source system, and you have Staging and Reporting areas (datasets) in BigQuery.

The Reporting area in BigQuery stores the most recent, full data that has been ingested from the source system tables. Usually you create the base table as a full snapshot of the source system table. In our running example, we use BigQuery public data as the source system and create reporting.base_table as shown below. In our example each row is identified by a unique key which consists of two columns: block_hash and log_index.
CREATE TABLE reporting.base_table --156 GB processedPARTITION BY TIMESTAMP_TRUNC(block_timestamp, DAY) ASSELECT log_index, data, topics, block_timestamp, block_hashFROM bigquery-public-data.crypto_ethereum.logsWHERE block_timestamp BETWEEN TIMESTAMP '2020-01-01' AND TIMESTAMP '2020-11-30';
In data warehouses it is common to partition a large base table by a datetime column that has a business meaning. For example, it may be a transaction timestamp, or datetime when some business event happened, etc. The idea is that data analysts who use the data warehouse usually need to analyze only some range of dates and rarely need the full data. In our example, we partition the base table by block_timestamp which comes from the source system.
After ingesting the initial snapshot you need to capture changes that happen in the source system table and update the reporting base table accordingly. This is when the Staging area comes into the picture. The staging table will contain captured data changes that you will merge into the base table. Let’s say that in our source system on a regular basis we have a set of new rows and also some updated records. In our example we mock the staging data as follows: first, we create new data, than we mock the updated records:
CREATE TABLE staging.load_delta AS --5 GB processedSELECT log_index, data, topics, block_timestamp, block_hashFROM bigquery-public-data.crypto_ethereum.logsWHERE block_timestamp BETWEEN TIMESTAMP '2020-12-01' AND TIMESTAMP '2020-12-07';INSERT INTO staging.load_delta --2 GB processedSELECT log_index, CONCAT(data, RAND()), topics, block_timestamp, block_hashFROM bigquery-public-data.crypto_ethereum.logs TABLESAMPLE SYSTEM (5 PERCENT)WHERE block_timestamp BETWEEN TIMESTAMP '2020-10-01' AND TIMESTAMP '2020-11-30';
Next, the pipeline merges the staging data into the base table. It joins two tables by unique key and than updates the changed value or inserts a new row
MERGE INTO reporting.base_table T --161 GB processedUSING staging.load_delta SON T.block_hash = S.block_hashAND T.log_index = S.log_indexWHEN MATCHED THEN UPDATE SETT.data = S.dataWHEN NOT MATCHED THEN INSERT (log_index, data, topics, block_timestamp, block_hash)VALUES (log_index, data, topics, block_timestamp, block_hash);
It is often the case that the staging table contains keys from various partitions but the number of those partitions are relatively small. It holds, for instance, because in the source system the recently added data may get changed due to some initial errors or ongoing processes but older records are rarely updated. However, when the above MERGE gets executed, BigQuery scans all partitions in the base table and processes 161 GB of data. You might add additional join condition on block_timestamp:
MERGE INTO reporting.base_table T --161 GB processedUSING staging.load_delta SON T.block_hash = S.block_hashAND T.log_index = S.log_indexAND T.block_timestamp = S.block_timestampWHEN MATCHED THEN UPDATE SETT.data = S.dataWHEN NOT MATCHED THEN INSERT (log_index, data, topics, block_timestamp, block_hash)VALUES (log_index, data, topics, block_timestamp, block_hash);
But BigQuery would still scan all partitions in the base table because condition T.block_timestamp = S.block_timestamp is a dynamic predicate and BigQuery doesn’t automatically push such predicates down from one table to another in MERGE.
Can you improve the MERGE efficiency by making it scan less data? The answer is Yes.
As described in the MERGE documentation, pruning conditions may be located in a subquery filter, a merge_condition filter, or a search_condition filter. In this post we show how you can leverage the first two. The main idea is to turn a dynamic predicate into a static predicate.
Steps to enhance your ingestion pipeline
The initial step is to compute the range of partitions that will be updated during the MERGE and store it in a variable. As was mentioned above, in data ingestion pipelines, staging tables are usually small so the cost of the computation is relatively low.
DECLARE src_range STRUCT<date_min TIMESTAMP, date_max TIMESTAMP> --115 MB processedDEFAULT(SELECT STRUCT(MIN(block_timestamp) AS date_min,MAX(block_timestamp) AS date_max) FROM staging.load_delta);
Based on your existing ETL/ELT pipeline, you can add the above code as-is to your pipeline or you can compute date_min, data_max as part of some already existing transformation step. Alternatively, date_min, data_max can be computed on the Source System side while capturing the next ingestion data batch.
After computing date_min, date_max you pass those values to the MERGE statement as static predicates. There are several ways to enhance the MERGE and prune partitions in the base table based on precomputed date_min, data_max.
If your initial MERGE statement uses a subquery, you can incorporate a new filter into it:
BEGINDECLARE src_range STRUCT<date_min TIMESTAMP, date_max TIMESTAMP> --115 MB processedDEFAULT(SELECT STRUCT(MIN(block_timestamp) AS date_min,MAX(block_timestamp) AS date_max) FROM staging.load_delta);MERGE INTO reporting.base_table T --41 GB processedUSING (SELECT *FROM staging.load_deltaWHERE block_timestamp BETWEEN src_range.date_min AND src_range.date_max) SON T.block_hash = S.block_hashAND T.log_index = S.log_indexAND T.block_timestamp = S.block_timestampWHEN MATCHED THEN UPDATE SETT.data = S.dataWHEN NOT MATCHED THEN INSERT (log_index, data, topics, block_timestamp, block_hash)VALUES (log_index, data, topics, block_timestamp, block_hash);END;
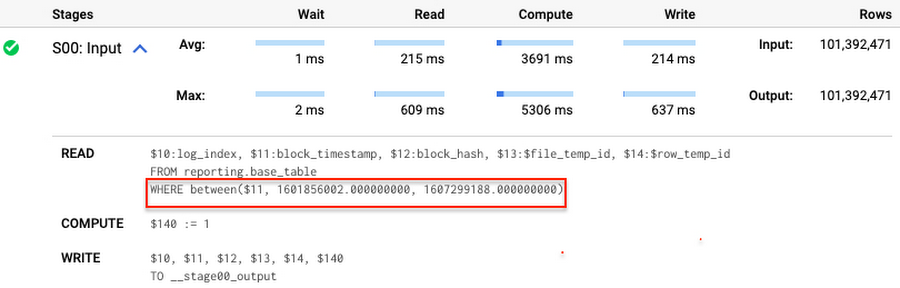
Note that you add the static filter to the staging table and keep T.block_timestamp = S.block_timestamp to convey to BigQuery that it can push that filter to the base table. This MERGE processes 41 GB of data in contrast to the initial 161 GB. You can see in the query plan that BigQuery pushes the partition filter from the staging table to the base table:
This type of optimization, when a pruning condition is pushed from a subquery to a large partitioned or clustered table, is not unique for MERGE. It also works for other types of queries. For instance:
SELECT * -- 41 GB processedFROM reporting.base_table TINNER JOIN staging.load_delta SON T.block_hash = S.block_hashAND T.log_index = S.log_indexAND T.block_timestamp = S.block_timestampWHERE S.block_timestamp BETWEEN TIMESTAMP '2020-10-05' AND TIMESTAMP '2020-12-07'
And you can check the query plan to verify that BigQuery pushed down the partition filter from one table to another.
Moreover, for SELECT statements, BigQuery can automatically infer a filter predicate on a join column and push it down from one table to another if your query meets the following criteria:
- The target table must be clustered or partitioned.
- The result size of the other table, i.e. after applying all filters, must qualify for broadcast join. Namly, the result set must be relatively small, less than ~100MB.
In our running example, reporting.base_table is partitioned by block_timestamp. If you define a selective filter on staging.load_delta and join two tables, you can see an inferred filter on the join key pushed to the target table
SELECT *FROM reporting.base_table TINNER JOIN staging.load_delta SON T.block_timestamp = S.block_timestampWHERE S.block_hash = '0x0c1caa16b34d94843aabfebc0d5a961db358135988f7498a6fdc450ad55f0870'
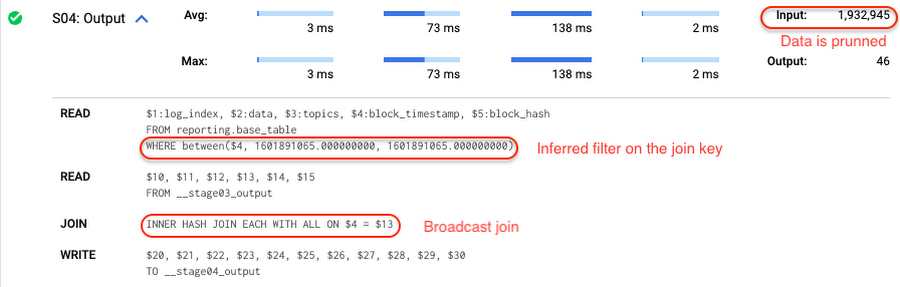
There is no requirement to join tables by partitioning or clustering key to kick off this type of optimization. However, in this case the pruning effect on the target table would be less significant.
But let us get back to the pipeline optimizations. Another way to enhance MERGE is to modify the merge_condition filter by adding static predicate on the base table:
BEGINDECLARE src_range STRUCT<date_min TIMESTAMP, date_max TIMESTAMP> --115 MB processedDEFAULT(SELECT STRUCT(MIN(block_timestamp) AS date_min,MAX(block_timestamp) AS date_max) FROM staging.load_delta);MERGE INTO reporting.base_table T --41 GB processedUSING staging.load_delta SON T.block_hash = S.block_hashAND T.log_index = S.log_indexAND T.block_timestamp BETWEEN src_range.date_min AND src_range.date_maxWHEN MATCHED THEN UPDATE SETT.data = S.dataWHEN NOT MATCHED THEN INSERT (log_index, data, topics, block_timestamp, block_hash)VALUES (log_index, data, topics, block_timestamp, block_hash);END;
To summarize, here are the steps that you can perform to enhance incremental ingestion pipelines in BigQuery. First you compute the range of updated partitions based on the small staging table. Next, you tweak the MERGE statement a bit to let BigQuery know to prune data in the base table.
All the enhanced MERGE statements scanned 41 GB of data, and setting up the src_range variable took 115 MB. Compare it with the initial 161 GB scan. Moreover, given that computing src_range may be incorporated into some existing transformation in your ETL/ELT, it results in a good performance improvement which you can leverage in your pipelines.
In this post we described how to enhance data ingestion pipelines by turning dynamic filter predicates into static predicates and letting BiQuery prune data for us. You can find more tips on BigQuery DML tuning here.
Special thanks to Daniel De Leo, who helped with examples and provided valuable feedback on this content.
Google Cloud Modernized Wisconsin Department of Workforce Development to Process 150K+ Unemployment Claims Per Week

2995
Of your peers have already read this article.
2:00 Minutes
The most insightful time you'll spend today!
When confronted with challenges, resilient organizations adapt and innovate to address changing customer needs. Through its partnership with Google Cloud, the Wisconsin Department of Workforce Development exemplifies this evolutionary approach.
Just a few months ago, challenges created by the antiquated unemployment insurance (UI) system threatened the agency’s ability to serve constituents who lost their jobs during the pandemic. Now, and in the months ahead, that continuing evolution will transform how the DWD serves its constituents with the modernization of their UI system, which includes customer experience workflows, predictive analytics, and streamlining and expediting paper applications.
Like many workforce development agencies nationwide, last year, DWD experienced a deluge of claims filed in response to the COVID-19 economic fallout. Unfortunately, DWD’s legacy UI infrastructure — largely written in the COBOL computing language and hosted on a mainframe server – was no match for the volume and complexity of cases. Wisconsin’s multiple technology systems required a large amount of manual processing, with staff using spreadsheets to manually calculate benefit adjustments. As a result, the state just couldn’t keep up with the surge of claims, and it needed to pivot quickly to a new solution to keep up with demand.
DWD initially responded by staffing up call centers, hiring UI application adjudicators, and deploying other personnel–all told, hiring, contracting with, or reassigning more than 1,300 individuals. However, while this enabled DWD to respond to approximately 7 million calls per month, the massive number of incoming claims surged to create a backlog of more than 750,000 claims. Legacy technology issues continued to significantly slow the query-response time.
DWD leaders recognized that staffing alone was not the solution and that innovation was needed to overcome past, inadequate IT investment. To address the inherited issues, Wisconsin turned to Google Cloud. Working together, we were able to scale the state’s response to claims and speed up overall response time. We were also successful in screening out fraudulent claims so that the UI program could be administered–with integrity–to Wisconsinites who needed financial assistance.
Year-to-date, Wisconsin has now disbursed $2 billion in unemployment benefits, in addition to successfully clearing its entire 2020 UI backlog. As a result of our partnership, the state is now processing an average of 157,000 claims each week and releasing most payments to citizens within two to three business days. Before the new system was in place, the response time could be weeks or even months.
Here is how Wisconsin and Google Cloud are modernizing the state’s current legacy system through a modular approach:
- Artificial intelligence (AI)/ machine learning (ML) for predictive analytics: Through the use of Google AI/ML, the state is creating predictive analytics based on historical data to shorten adjudication decision-making for UI claims, enabling it to release payments to eligible claimants faster. Comprehensive data models and confidence scores analyze the backlog data to determine the shortest route to approval and payments, with a high level of confidence and accuracy. DWD is using Google Cloud technology to identify where in the process the claimant was getting stuck in one of the “hold buckets” for processing a UI claim. Using Google Cloud’s data and AI/ML tools, Wisconsin is able to identify problem areas and quickly resolve those issues. This informed DWD’s rewrite of the UI claim application process. And it also helped DWD identify fraudulent claims.
- Document AI (DocAI) for streamlining paper applications: DWD is also partnering with Google Cloud to streamline paper applications and fax documents as part of UI claims processing–enabling documents to be submitted online instead of by fax or hard-copy mail. Our DocAI solution helps Wisconsin staff make faster decisions by rapidly extracting critical data from documents, saving time, and removing manual processes, which allows employees to focus on high-priority activities.
These modernization steps in Wisconsin are resulting in a bold new vision for state unemployment systems across the United States. Through a combination of design thinking, deep partnership with state officials, and modern technology, DWD’s solutions are tailored to maximize benefits to the constituents they’re designed to serve. By joining forces with Google Cloud and utilizing modernizing technology to make informed, data-driven decisions, Wisconsin DWD is helping residents have a better experience that is easier to understand and navigate–all while better serving the community overall.
How Data Efficiency with Google Cloud Empower Governments to Make Data-first Decisions

5065
Of your peers have already read this article.
1:30 Minutes
The most insightful time you'll spend today!
Presently, every government agency has to take a hard look at their data capabilities and decide whether their current infrastructure supports their workflow. For many, it doesn’t. Most data systems are developed with a strict set of parameters in mind before implementation, which can limit flexibility and long-term use. Particularly during a crisis, flexible “living systems” offer tremendous advantages as they’re able to change capacity rapidly. Building living data systems with the cloud in mind allows organizations to respond to a changing world with confidence.
Last summer, the Government Business Council conducted a survey of government employees to understand the impacts of data efficiency on government operations. The report Built to Last: A Survey on Organizational Data Efficiency in Times of Crisis offers key insights into organizational efficacy and whether organizations can adapt to a crisis at speed. It also highlights differences between traditional data systems and living data systems.
Data needs to be readily available
When the pandemic first hit, many agencies needed to create or transition their systems to allow employees to work remotely. This change tested the limits of existing data systems. Even after finding a cloud service provider, agencies encountered the challenges of migrating their data to the cloud.
Government organizations had decades of data stored in paper records. Most have been working to transfer these records to a digital format, but the process has been slow. They are also faced with collecting sizable amounts of data in real time from their ongoing services, which involves interfacing with the public, external vendors, or third-party institutions.
Building the cloud into a flexible data system can solve both issues. Old records can be digitized and given an easy-to-access home for those who need them. Incoming data, both internal and external, can be made accessible as well. Migrating data to the cloud also doubles as a way to create backups of raw data, adding an extra layer of security. Most importantly, building in the cloud unlocked the capacity to scale when demand rises.
Data should be updated in real-time
One of the key takeaways from the Government Business Council report is the fact that agencies are better able to adapt at speed when data efficiencies are higher. 74% of organizations with pandemic related functions reported a moderate to severe impact to their jobs at the onset of the pandemic. Of those organizations, the ones reporting their data efficiency as “very good” have largely already recovered. That adaptability directly affects an agency’s ability to make informed decisions during a time of a crisis.
Having a real-time data solution in place lets agencies make near real-time decisions. A great example of this from early in the pandemic is vaccine distribution. Google Cloud supported multiple states, such as the State of Wyoming, in distributing vaccines efficiently while handling challenges such as reaching rural populations. Data systems that gathered real-time patient data made a difference in the number of vaccines distributed. Knowing population data and patient risk factors enabled quick and effective decision-making.
A global pandemic is far from the only crisis that needs effective data analytics. Natural disasters, food deserts, public health issues, and more can all be handled more efficiently by having real-time data at hand. Effective data analytics systems are the digital equal of “having your ear to the ground” in each community. They provide valuable insights into what people need.
Data needs to be accessible and easy to use
Making data easy to work with and understand sets phenomenal data systems apart from functional ones. Having data in the cloud is a great first step, but agencies need to be able to easily access and quickly use the data to accomplish their goals. This is where traditional data systems fail most often. Traditional IT systems and data strategies are designed for a specific purpose, usually identified before development and implementation begin. That means that when the data living in those systems needs to be used differently, adapting to new requirements can be difficult.
Data can often feel “locked” in traditional systems; the data is there, but there’s no way to get to it or work with it in a way that meets the needs of a crisis. Flexible data systems address this by allowing for greater accessibility. Google Cloud, for example, has customizable tools, such as Contact Center AI and Document AI, which let agencies work with data in ever-changing ways. This also produces greater data transparency since data sets can be worked with and accessed more easily.
Governments need to respond to the changing needs of their constituents in emergencies. While traditional data systems can handle slowly shifting demands on the system, they do not serve agencies well in a crisis. When urgency, accuracy, and accessibility all matter, flexible systems rise to the challenge. The pandemic has pushed agencies to adapt in real time, and many have realized they need a system that adapts with them.
Google Cloud has a suite of tools to create integrated data ecosystems. These ecosystems can scale with increasing demand, meet dynamic development needs, and adapt to a changing landscape. Data-first decision-making is a core tenet of “living data systems.” Google Cloud data systems have handled everything from administering vaccines to detecting fraud. In each of these applications, a core tenet of data-first decision making was implemented at scale.
For more insights on how flexible data systems help the public sector, download the full report “Built to Last: A Survey on Organizational Data Efficiency in Times of Crisis.”

Anthos for Manufacturing: Tackle DevOps Complexities and Drive Digital Transformation
DOWNLOAD E-BOOK6269
Of your peers have already downloaded this article
2:00 Minutes
The most insightful time you'll spend today!

3136
Of your peers have already downloaded this article
22:30 Minutes
The most insightful time you'll spend today!
Companies everywhere are seeking to leverage the power of AI. And rightly so. The smart applications of AI enable organizations to improve, to scale, and to accelerate the decision-making process across most business functions, so as to work both more efficiently and more effectively. It can also open up new avenues and new revenue streams, providing the organization with an additional competitive edge.
In short, many believe (as we do) that the enterprises that invest in building industry-specific AI solutions today are positioning themselves to be the global economic leaders of tomorrow. But the path to building an effective AI capability is not an easy one. There are many challenges to overcome. Challenges with the technology to develop platforms and solutions. With the people who will implement and manage that technology. With the data that fuels the technology. And with the processes that govern the whole of it. How do you harness the power inherent in AI, while avoiding any potential missteps?
That’s where Google Cloud comes in. Our framework for AI adoption provides a guide to technology leaders who want to build an effective AI capability, one that enables them to leverage the power of AI to enhance and streamline their business, smoothly and smartly. The framework is informed by Google’s own evolution, innovation, and leadership in AI, including experience deploying AI in production through products such as Gmail and Google Photos. It is also inspired by many years of experience helping cloud customers — from startups to enterprises, in various industries — to solve complex challenges.
With Google Cloud’s AI Adoption Framework, you’ll be able to create and evolve your own transformative AI capability. You’ll have a map for assessing where you are in the journey and where, at the end of it, you’d like to be. You’ll have a structure for building scalable AI capabilities to create better insights from big data with powerful algorithms across the entire business.
With Google Cloud as your guide, the path to AI is considerably smoother.
Download this whitepaper to find out:
- A map for assessing where you are in your AI journey and where you want to be
- A comprehensive structure for building an effective AI capability across your entire organisation to create actionable insights from data
- A technical deep dive for technology leaders
What Drives Your Organization to be Data-driven?

4890
Of your peers have already read this article.
4:00 Minutes
The most insightful time you'll spend today!
Every organization has its own unique data culture and capabilities. Yet each is expected to use technology trends and solutions in the same way as everyone else. Your organization may be built on years of legacy applications, you may have developed a considerable amount of expertise and knowledge, yet you may be asked to adopt a new approach based on a technology trend. On the other hand, you may be on the other side of the spectrum, a digitally native organization built with engineering principles from scratch without legacy systems but expected to follow the same principles as process driven, established organizations. The question is, should we treat these organizations in the same way when it comes to data processing? In this series of blogs and papers this is what we are exploring: how to set up an organization from the first principles from data analyst, data engineering and data science point of view. In reality, there is no such organization that is solely driven by one of these but it is likely to be a combination of multiple types. What type of organization you become is then driven by how much you are influenced by each of these principles.
When you are considering what data processing technology encompasses, take a step back and make a strategic decision based on your key goals. This can be whether you optimize for performance, cost, reduction in operational overhead, increase in operational excellence, integration of new analytical and machine learning approaches. Or perhaps you’re looking to leverage existing employees’ skills while meeting all your data governance and regulatory requirements. We will be exploring these different themes and will focus on how they guide your decision-making process. You may be coming from technologies which are solving some of the past problems and some of the terminologies may be more familiar, however they don’t scale your capabilities. There is also the opportunity cost of prioritizing legacy and new issues that arise from a transformation effort, and as a result your new initiative can set you further behind on your core business while you play catch up to an ever changing technology landscape.
Data value chain
The key for any ingestion and transformation tool is to extract data from a source and start acting on it. The ultimate goal is to reduce the complexity and increase the timeliness of the data. Without data, it is impossible to create a data driven organization and act on the insights. As a result, data needs to be transformed, enriched, joined with other data sources, and aggregated to make better decisions. In other words, insights on good timely data mean good decisions.
While deciding on the data ingestion pipeline, one of the best approaches is to look into the volume of data, the velocity of the data, and type of data that is arriving. Other considerations include the number of different data sources you are managing, whether you need to scale to thousands of sources using generic pipelines, whether you want to create one generic pipeline but then apply data quality rules and governance. ETL tools are ideal for this use case as generic pipelines can be written and then parameterized.
On the other hand, consider the data source. Can the data be directly ingested without transforming and formatting the data? If the data does not need to be transformed and can be ingested directly into the data warehouse as a managed solution. This not only reduces the operational costs but also allows for more timely data delivery. If the data is coming in through an unstructured format such as XML or in a format such as EBCDIC and needs to be transformed and formatted, then a tool with ETL Capabilities can be used depending on the speed of the data arrival.
It is also important to understand the speed and time of arrival of the data. Think about your SLAs and time durations/windows that are relevant for your data ingestion plans. This would not only drive the ingestion profiles but would also dictate which framework to use. As discussed above, velocity requirements would drive the decision-making process.
Type of Organization
Different organizations can be successful by employing different strategies based on the talent that they have. Just like in sports, each team plays with a different strategy with the ultimate goal of winning.
Organizations often need to decide on what’s the best strategy to take in respect to data ingestion and processing – whether you need to hire an expensive group of data engineers, or exploit your data wizards and analysts to enrich and transform data that can be acted on, or whether it would be more realistic to train the current workforce to do more functional/high value work rather than to focus on building generally understood and available foundational pieces.
On the other hand, the transformation part of ETL pipelines as we know it, dictates where the load will be. All of these are made a reality in the cloud native world where data can be enriched, aggregated, and joined. Loading data into a powerful and modern data warehouse means that you can already join and enrich the data using ELT. Consequently, ETL isn’t really needed in its strict terms anymore if the data can be loaded directly into the data warehouse.
All of the above was not possible in the traditional, siloed, and static data warehouses and data ecosystems whereby systems would not talk to each other or there were capacity constraints in respect to both storing and processing the data in the expensive Data Warehouse. This is no longer the case in the BigQuery world as storage is now cheap and transformations are now much more capable without constraints of virtual appliances.
If your organization is already heavily invested into an ETL tool, one option is to use them to load BigQuery and transform the data initially within the ETL tool. Once the as-is and to-be are verified to be matching, then with the improved knowledge and expertise one can start moving workloads into BigQuery SQL, and effectively do ELT.
Furthermore, if your organization is coming from a more traditional data warehouse that extensively relies on stored procedures and scripting, then the question that one may ask is, do I continue leveraging these skills and expertise and use these capabilities that are also provided in BigQuery? ELT with BigQuery is more natural, similar to what’s already in Teradata BTEQ, Oracle PL/SQL but migrating from ETL to ELT requires changes. This change then enables exploiting streaming use cases, such as real-time use cases in retail. This is because there is no preceding step before data is loaded and made available.
Organizations can be broadly classified under 3 types as Data Analyst Driven, Data Engineering driven, and Blended organization. We will be covering a Data Science driven organization within the Blended category.
Data Analyst Driven
Analysts understand the business and are used to using SQL/spreadsheets. Allowing them to do advanced analytics through interfaces that they are accustomed to enables scaling. As a result, easy to use ETL tooling to bring data quickly into the target system becomes a key driver. Ingesting data directly from a source or staging area then also becomes critical as it allows analysts to exploit their key skills using ELT and increases timeliness of the data. This is commonplace with traditional EDWs and realized by extended capabilities of using Stored Procedures and Scripting. Data is enriched, transformed, and cleansed using SQL and ETL tools act as the orchestration tools.
The capabilities brought by cloud computing on separation of data and computation changes the face of the EDW as well. Rather than creating complex ingestion pipelines, the role of the ingestion becomes, bringing data close to the cloud, staging on a storage bucket or on a messaging system before being ingested into the cloud EDW. This then releases data analysts to focus on looking into data insights using tools and interfaces that they are accustomed to.
Data Engineering / Data Science Driven
Building complex data engineering pipelines is expensive but enables increased capabilities. This allows creating repeatable processes and scaling the number of sources. Once complemented with cloud it enables agile data processing methodologies. On the other hand, data science organizations allow carrying out experiments and producing applications that work for specific use cases but are not often productionised or generalized.
Real-time analytics enables immediate responses and there are specific use cases where low latency anomaly detection applications are required to run. In other words, business requirements would be such that it has to be acted upon as the data arrives on the fly. Processing this type of data or application requires transformation done outside of the target.
All the above usually requires custom applications or state-of-the-art tooling which is achieved by organizations that excel with their engineering capabilities. In reality, there are very few organizations that can be truly engineering organizations. Many fall into what we call here as the blended organization.
Blended org
The above classification can be used on tool selection for each project. For example, rather than choosing a single tool, choose the right tool for the right workload, because this would reduce operational cost, license cost and use the best of the tools available. Let the deciding factor be driven by business requirements: each business unit or team would know the applications they need to connect with to get valuable business insights. This coupled with the data maturity of the organization would be the key to making sure the right data processing tool would be the right fit.
In reality, you are likely to be somewhere on a spectrum. Digital native organizations are likely to be closer to being engineering driven, due to their culture and business that they are in. However, brick and mortar organizations would be closer to being analyst driven due to the significant number of legacy systems and processes they possess. These organizations are either considering or working toward digital transformation with an aspiration of having a data engineering / software engineering culture like Google.
The blended organization with strong skills around data engineering, would have built the platform and built frameworks, to increase reusable patterns would increase productivity and then reduce costs. Data engineers focus on running Spark on Kubernetes whereas infrastructure engineers focus on container work. This in turn provides unparalleled capabilities as application developers focus on the data pipelines and even the underlying technologies or platforms changes code stays the same. As a result, security issues, latency requirements, cost demands and portability are addressed at multiple layers.
Conclusion – What type of organization are you?
Often an organization’s infrastructure is not flexible enough to react to a fast changing technological landscape. Whether you are part of an organization which is engineering driven or analyst driven, organizations frequently look at technical requirements that inform which architecture to implement. But a key, and frequently overlooked, component needed to truly become a data-driven organization is the impact of the architecture on your data users. When you take into account the responsibilities, skill sets, and trust of your data users, you can create the right data platform to meet the needs of your IT department as well as your business.
To become a truly data-driven organization, the first step is to design and implement an analytics data platform that meets your technical and business needs. The reality is that each organization is different and has a different culture, different skills, and capabilities. Key is to leverage its strengths to stay competitive while adopting new technologies when it is needed and as it fits to your organization.
To learn more about the elements of how to build an analytics data platform depending on the organization you are, read our paper here.
More Relevant Stories for Your Company

Google Migration and BigQuery Brings PedidosYa Closer towards its Goal of Becoming Data-driven
Editor’s note: PedidosYa is the market leader for online food ordering in Latin America, serving 15 markets and over 400 cities. It’s also one of the largest brands within the German multinational company Delivery Hero SE. With over 20 million app downloads, PedidosYa provides the best online delivery experience through

redBus: Mastering Big Data with Google BigQuery
In 2006, online travel agency redBus introduced internet bus ticketing in India, unifying tens of thousands of bus schedules into a single booking operation. (Think of it as Expedia for bus booking.) Using BigQuery, redBus crunches terabytes of booking and inventory data in mere seconds and at a fraction of

How TeamSnap Improved Return on Ad Spend Significantly
Anyone who has ever coached or played on a sports team, or had a child involved in sports, knows how difficult scheduling and logistics can be. From game and practice schedules, to uniforms and who’s bringing the snacks, it can be a lot for coaches, administrators, parents, and players to


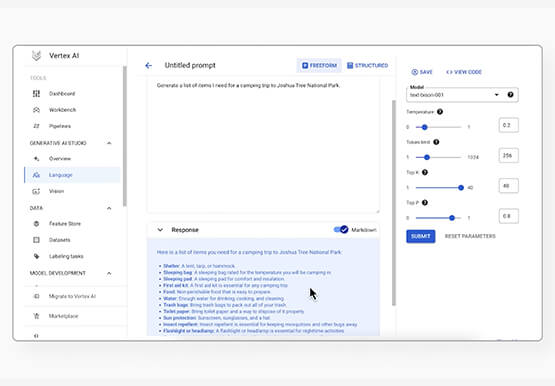

Prototyping Language Applications Made Easy with Generative AI
Did you know generative AI allows developers to prototype applications quickly? With Generative AI Studio on Google Cloud, developers can quickly explore and customize AI models that can be leveraged in Google Cloud applications. Watch along and see how developers, with the right tools, can experiment with new ideas in
