





3137
Of your peers have already watched this video.
36:30 Minutes
The most insightful time you'll spend today!
Don’t sweat the big stuff. Make it Google’s problem
Need to interpolate new time series data values over 5 billion rows? Don’t reach for python. Make that Google’s problem and do it in BigQuery.
Need to aggregate petabytes of geospatial data across arbitrary polygons and put it on a map for analysis? Make that Google’s problem and use BQ-GIS.
Great – your map was awesome and now we need it every hour. Roll your own Airflow server? Nope. Make that Google’s problem. You see the pattern.
Geotab, which operates in in the telematics space, applies instrumenting to vehicles to learn how to optimize fleet maintenance, routes and costs, and even find way to optimize city infrastructure.
Geotab has been a long-time customer of Google Cloud products. They leverage the entire GCP suite to empower data scientists to efficiently ingest, process, and analyze petabytes of IoT data.
One of the keys to their pace of innovation and growth has been to focus on their key competencies and partner with others to fill in the gaps.
For Geotab’s data scientists this means focusing on the data and model-building and whenever possible making the processing, storage, and orchestration, well Google’s problem.
Largest Beauty Retailer in the US Powers Digital Transformation with Google Cloud Smart Analytics

9286
Of your peers have already read this article.
3:15 Minutes
The most insightful time you'll spend today!
Digital technology offers increasing flexibility and choice to consumers. As a result, the retail industry is dramatically shifting toward more tailored and personalized experiences for shoppers, and businesses are rethinking how they deliver value to customers.
This couldn’t be more true for the beauty retailing industry where leading companies are turning to digital technology to create customized shopping experiences.
At Google Cloud, we’re particularly excited about our work with Ulta Beauty, the largest beauty retailer in the United States with more than 1196 stores in all 50 states, and how the company is using Google Cloud technology solutions to power personalization and redefine beauty retailing.
Established in 1990, Ulta Beauty has had incredible success as a company, and as customers become more discerning and curious about their purchases, the company is finding new ways to meet their changing needs.
Recently, leaders at Ulta Beauty recognized a huge opportunity to complement and enhance the shopping experience by helping beauty enthusiasts navigate through more than 500 brands and 25,000 products carried in their stores and online channel.
They decided to leverage the data from Ulta Beauty’s successful Ultamate Rewards loyalty program to create and offer more unique and personalized user experiences.
With more than 30 million members generating data through sales, transactions, product reviews, and social media engagement, Ulta Beauty’s Loyalty Program creates a comprehensive data set, and the company sought the right technology partner to help organize, analyze and transform that data into valuable insights for its customers.
Ulta Beauty’s leaders knew they had an opportunity to leverage data analytics and machine learning to reach customers in new ways, enhance the guest experience, and continue to grow their active loyalty member base. After considering a number of cloud providers, they chose to expand their existing partnership with Google Cloud.
“Google Cloud listened to our needs and worked in tandem with our engineering team to address our challenges,” said Michelle Pacynski, vice president of digital innovation at Ulta Beauty. “The ease of working with the Google Cloud team and their breadth of experience made the decision a no-brainer, laying the foundation for a great partnership.”
In 2019, Ulta Beauty announced it was working with Google Cloud Platform to unify and organize its data, using:
- BigQuery to perform data analysis and generate dynamic content, personalized product recommendations, and event-based messages for customers.
- Cloud Storage to provide highly available, secure, resilient and cost-effective access to data across the entire enterprise.
- Compute Engine for the high-performance scalability needed to grow with customer demand while painlessly migrating existing applications to the cloud.
- Anthos to build a hybrid cloud foundation that allows their applications to take advantage of all this data, combining the power and flexibility of GKE with the ability to leverage their existing investment in secure infrastructure on-premises.
Our partnership with Ulta Beauty has enabled increased engagement with customers in store and online, and the creation of new tools and capabilities, including a new Virtual Beauty Advisor tool to deliver tailored recommendations and help shoppers choose the right products, and a Customer Conversation Platform that’s enabling deeper connections with guests, ultimately driving customer loyalty.
“It’s been a really efficient process so far due in part to the ease of working with the Google team,” said Michelle Pacynski, vice president of digital innovation at Ulta Beauty. “They’re experienced, approachable, and their can-do style makes for a great partnership. They listened to our needs and worked in tandem with our engineering team, figuring things out, and getting it done.”
Apache and Dataflow Help with Real-time Indices Processing for Financial Institutions
4922
Of your peers have already read this article.
4:00 Minutes
The most insightful time you'll spend today!
Financial institutions across the globe rely on real-time indices to inform real-time portfolio valuations, to provide benchmarks for other investments, and as a basis for passive investment instruments including exchange-traded products (ETPs). This reliance is growing—the index industry dramatically expanded in 2020, reaching revenues of $4.08 billion.
Today, indices are calculated and distributed by index providers with proximity and access to underlying asset data, and with differentiating real-time data processing capabilities. These providers offer subscriptions to real-time feeds of index prices and publish the constituents, calculation methodology, and update frequency for each index.
But as new assets, markets, and data sources have proliferated, financial institutions have developed new requirements. Financial institutions will need to quickly create bespoke and frequently updating indices that represent a specific actual or theoretical portfolio, with its unique constituents and weightings.
In other words, existing index providers and other financial institutions alike will need mechanisms for rapid creation of real-time indices. This blog post’s focus—an index publication pipeline collaboratively developed by CME Group and Google Cloud—is an example of such a mechanism.
The pipeline closely approximates a particular CME Group index benchmark, but with far greater frequency (in near real time vs. daily) than its official counterpart. It does so by leveraging open-source models such as Apache Beam and cloud-based technologies such as Dataflow, which automatically scales pipelines based on inbound data volume.
Machine learning’s production problem
In the past decade, advances in AI toolchains have enabled faster ML model training—and yet a majority of ML models are still not making it into production. As organizations endeavor to develop their ML capabilities, they soon realize that a real-world ML system is comprised of a small amount of ML code embedded in a network of complex and large ancillary components. Each component brings its own development and operational challenges, which are met by bringing a DevOps methodology to the ML system, commonly referred to as MLOps (Machine Learning Operations). To apply ML to business problems, a firm must develop continuous delivery and automation pipelines for ML.
This index publication collaboration is instructive because it demonstrates MLOps best practices for just such a pipeline. One Apache Beam pipeline, suited for operating on both batch and streaming data, extracts insights and packages them for downstream consumers. These consumers may include ML pipelines that, thanks to Apache Beam, require only one code path for inference across batch and real-time data sources. The pipeline is run inside Google Cloud’s Dataflow execution engine, greatly simplifying management of underlying compute resources.
But the collaboration’s value is not constrained to the ML and data science realm. The project shows that consumers of the Apache Beam pipeline’s insights may also include traditional business intelligence dashboards and reporting tools. It also demonstrates the simplicity and economy of cloud-based time series data such as CME Smart Stream, which is metered by the hour, quickly and automatically provisioned, and consumable at a per-product-code (not per-feed) level.
A focus on real-time processing for financial services
To illustrate the above points, the collaboration applies data engineering and MLOps best practices to a financial services problem. We chose the financial services domain because many financial institutions do not yet have real-time market data processing or MLOps capabilities today, owing to a significant gap on either side of their ML/AI objectives.
Upstream from ML/AI models, financial institutions often experience a data engineering gap. For many financial institutions, batch processes have sufficiently addressed business requirements. As a result, the temporal nature of the time series data underlying these processes is deemphasized. For example, the original purpose of most trade booking systems was to capture a trade and ensure that it found its way to the middle and back office for settlement. It was not built with ML/AI in mind, and its underlying data therefore has not been packaged for consumption by ML/AI processes.
And downstream from ML/AI models, financial institutions often encounter the aforementioned “ML production problem.”
As ML/AI becomes ever more strategic, these two gaps have left many financial institutions in a conundrum—unable to train ML models for lack of properly packaged time series data, and unmotivated to package time series data for lack of ML models. By recreating a key energy market index using open-source libraries and cloud-based tools, this collaboration demonstrates that for the financial services domain a solution to this conundrum is more accessible today than ever.
Creating a new index
We modeled our new index after one of CME Group’s many index benchmarks. The particular index expresses the value of a basket of three New York Mercantile Exchange—listed energy futures as a single price. Today, CME Group publishes the index at the end of the day by calculating the settlement price of each underlying futures contract, and then weighing and summing these values.
While CME Group does not currently publish this index in real time, this collaboration aims to create a near real-time solution leveraging Google Cloud capabilities and CME Group market data delivered via CME Smart Stream. However, in order to publish the value so frequently—every five seconds, with 40-second publish latency—this collaboration’s pipeline has to solve a number of challenges in near-real time.
First, the pipeline must process sparse data from three separate trades feeds in memory to create open-high-low-close (OHLC) bars. More specifically, for five-second windows for each of the three front-month (and sometimes second-month) energy contracts, a bar must be produced. This is solved by using the Apache Beam library to implement functions which, when executed on Dataflow, automatically scale out as input load increases. The bars must be time-aligned across the underlying feeds, which is greatly simplified by Beam’s watermark feature. And for intervals in which no tick data is observed, the Beam library is used to pull forward the last value received, yielding perfect gap-free bars for downstream processors.
Second, the pipeline must calculate volume-weighted average price (VWAP) in near real-time for each front-month contract. The VWAP calculations are also written using the Beam API and executed on Dataflow. Each of these functions requires visibility of each element in the time window, so the functions cannot be arbitrarily scaled out. Nonetheless, this is tractable because their input—OHLC bars—is manageably small.
Third, the pipeline must replicate CME Group’s specific settlement price methodology for each contract. The rules specify whether to use VWAP or another source as price, depending on certain conditions. They also specify how to weigh combinations of monthly contracts during a roll period. The pipeline again encapsulates these requirements as an Apache Beam class, and joins the separate price streams at the correct time boundary.
The end result is a new stream publishing bespoke index data to a Google Cloud Pub/Sub topic thousands of times daily, enabling AI models as well as traditional industry index usage, dashboards, and other tools to assist real-time decision making. The stream’s pipeline uses open source libraries that solve common time series problems out-of-the box, and cloud-based services to reduce the user’s operational and scaling burden.

The importance of cloud-based data
The promise of cloud-based pipeline execution services cannot be realized using legacy data access patterns, which often require market data users to colocate and configure servers and network gear. Such patterns inject expense and scaling complexity into the pipeline’s overall operation, diverting resources from the adoption of MLOps best practices. Instead, a newer, cloud-based access pattern—in which resources subscribe to data streams inexpensively, rapidly and programatically—is necessary.
In 2018, CME Group identified the customer need for accessible futures and options market data. CME Group collaborated with Google Cloud to launch CME Smart Stream, which distributes CME Group’s real-time market data across Google Cloud’s global infrastructure with sub-second latency. Any customer with a CME Group data usage license and a Google Cloud project can consume this data for an hourly usage fee, without purchasing and configuring servers and network gear.
CME Smart Stream met this index pipeline’s requirements for cost-effective, cloud-based streaming data, but this is just one use case. Since the launch of a CME Smart Stream offering on Google Cloud, globally dispersed firms have adopted the solution. For example, Coin Metrics has been using the offering to better inform its customers in the crypto markets. According to CME Group, Smart Stream has become popular with new customers as the fastest, simplest way to access CME Group’s market data from anywhere in the world.
Adapt the design pattern to your needs
By combining cloud-based data, open-source libraries, and cloud-based pipeline execution services, we created a real-time index using the same constituents as its end-of-day counterpart. Additionally, financial institutions will find this approach addresses many other challenges—real-time valuation of a large set of portfolios; benchmark creation for new ETPs; or external publication of new indices.
Give it a try
This approach is available to help you meet your organization’s needs. Please review our user guide, whose Tutorials section provides a step-by-step guide to constructing a simple Apache Beam pipeline to generate metrics on streaming data in real-time, and connecting a new data source to the pipeline. We’ll be discussing this topic in CME Group’s webinar End-to-End Market Data Solutions in the Cloud at 10:30 am ET on June 16th.
3754
Of your peers have already watched this video.
5:00 Minutes
The most insightful time you'll spend today!
What’s BigQuery and Why Should IT Managers Care?
Today it’s impossible for anyone working in IT teams to have a day go by without a discussion about data, analytics, and big data.
Often these conversations veer towards BigQuery. Many IT managers are unsure what BigQuery is and what it does. If you are one of them, you aren’t alone.
Google BigQuery is a fast, highly-scalable, cost-effective, and fully managed cloud data warehouse for analytics, with built-in machine learning.
To better understand what the benefits of BigQuery are, it’s important to grasp some of the challenges that
These are some of the challenges that Google BigQuery fixes. To get a quick snapshot of what Google BigQuery does, watch this short video.
3200
Of your peers have already watched this video.
32:30 Minutes
The most insightful time you'll spend today!
Accelerating Insights with the Health Analytics Platform
The healthcare industry is beset with a data challenge, specifically clinical data, and challenges around the proliferation of EHR instances and ancillary clinical systems.
In this video, Vivian Neilley, Solution Architect, Google Cloud and Marianne Slight, Product Manager, Google Cloud discuss how some of these challenges can be overcome with the Health Analytics Platform.
The Health Analytics Platform enables companies who have healthcare data in multiple sources on their own infrastructure to harmonize data across systems, monitor analytics, and create compelling visualizations that enable easier decision-making.
This new product suite allows for healthcare and life science organizations to manage data pipelines and run advanced analytics on managed infrastructure with interactive UIs and health data-aware features.
The Health Analytics Platform provides and end-to-end solution, from ingestion of data to harmonization to a common data model, to dashboard visualizations and machine learning.
Whether organizations leverage a data lake or are utilizing a full data warehouse approach, the platform gives users the flexibility to meet customers where they are today. This session will demonstrate how to leverage the health analytics platform to accelerate time to insights in a healthcare or life sciences organization.

5211
Of your peers have already downloaded this article
2:30 Minutes
The most insightful time you'll spend today!
For as long as business intelligence (BI) has been around, visualization tools have played an important role in helping analysts and decision-makers quickly get insights from data.
In our current era of big data analytics, that premise still holds. To provide an integrated platform for building BI dashboards on top of big data, GCP offers the combination of Google BigQuery, a cloud-native data warehouse that helps you analyze petabytes of data quickly, and Google Data Studio, a free tool that helps you quickly create beautiful reports.
First, imagine that you work for an online retailer that bases important decisions on customer interaction data in the form of large amounts (multiple TBs) of usage logs stored as date-partitioned tables in a BigQuery dataset called usage. To get business value out of that data as quickly as possible, you want to build a dashboard for analysts that will provide visualizations of trends and patterns in your data.
The good news is that a connector is available that lets you query data stored in BigQuery directly from Data Studio.
Learn how to build a BI dashboard with Data Studio as the front end, and powered by BigQuery on the back end (with some help from Google App Engine for added efficiency). Download this how-to now.
More Relevant Stories for Your Company

Partnering with Google Cloud is the Key Behind Recent Healthcare Innovations
It’s simply amazing to witness how some of our systems integrators employ Google Cloud solutions to drive innovation in ways we at Google may never have considered—especially in healthcare. According to analyst firm MarketsandMarkets, the market for the Cloud in healthcare is projected to grow 43% between 2020 and 2025



An Indian Example of How to Really Up Your Customer Experience Game and Increase Conversion Rates With AI
How about selfie analysis of users to recommend them the right lipstick color? That’s just one of the many ideas folks at Purplle.com came up with to improve the buying experience of Indian consumers. And without the power of Google Cloud, it would probably have remained just that…an idea. But

Data to Business Outcomes with Google’s Data Analytics Design Pattern
Companies today are inundated with vast amounts of data from various sources. This overwhelming amount of data is meant to benefit the company, but often leaves data teams feeling overwhelmed, which can create data bottlenecks and result in a slow time to value. In fact, only twenty seven percent of
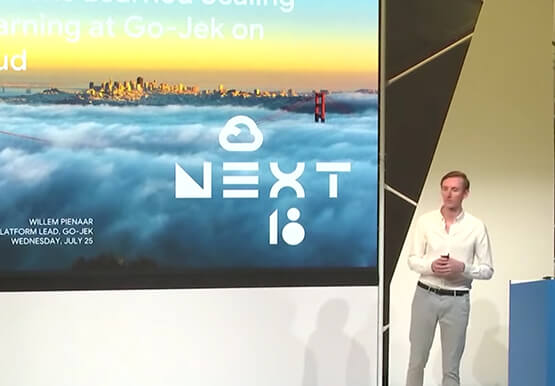

The Strange Phenomenon AI Revealed at Ride-Hailing Company Go-Jek
Go-Jek, Indonesia’s first billion-dollar startup, has seen an incredible amount of growth in both users and data over the past two years. Many of the ride-hailing company's services are backed by machine learning models hosted on Google Cloud Platform. Models range from driver allocation, to dynamic surge pricing, to food
