





The Fantastic Story of How BMG Enables a Micropayments Strategy So Music Artists Get Paid

7424
Of your peers have already read this article.
3:30 Minutes
The most insightful time you'll spend today!
The music industry is rapidly changing. Only 20 years ago, the availability of music and the infrastructure that was required to make an album a sales success were incredibly complex and expensive. With the decline of physical sales and a fundamental shift to digital, music streaming now accounts for more than half of all sales globally.
At the same time, technology has democratized music-making; in many ways, it has made the musical landscape more diverse. Artists can upload their music with the click of a button. But while it’s easier for creators to share their songs with audiences, getting paid has become more fragmented.
Although music is booming, people no longer buy it outright. Instead, listeners download music digitally or subscribe to streaming services to have their libraries with them at all times. To monetize digital content effectively, artists need to know when, where, and how often their songs are played on each service. To help them navigate this complicated royalties landscape and maximize their profits, Berlin-based international music company BMG provides customized, transparent, and fair services to songwriters and artists.
With publishing and recording divisions under one roof, the subsidiary of international media giant Bertelsmann works with both emerging artists and established stars, including John Legend, Kylie Minogue, Mick Jagger, and Keith Richards. With the MyBMG web and mobile application, clients can view and analyze their royalty details in real time and collect payment. When a new record is released, BMG uses data to maximize its impact and revenue for its creators.
“We make sure that everyone who uses our clients’ music knows who needs to be paid the associated royalties, then we collect these royalties and share them out quickly and transparently,” explains Sebastian Hentzschel, Chief Information Officer at BMG. “When our artists release new music, we make sure that it’s marketed and promoted effectively around the world.”
“We needed a scalable solution for our royalty workloads that was intuitive for our developers. We also wanted a partner, not a client-vendor relationship. With autoscaling via BigQuery, excellent customer support, and a clean and simple user interface, Google Cloud ticks every box for us.”
—Gaurav Mittal, Vice President Group Technology, BMG
Getting up to speed with a new way of paying artists
In this digital world, artists aren’t just paid every time a fan buys an album—they’re paid a small amount, or royalty, for each song downloaded or streamed by a listener. So, when the industry shifted to digital, the volume of data that BMG needed to handle grew exponentially. “One CD sale is equivalent to about 1,500 streamed songs or plays,” says Gaurav Mittal, Vice President Group Technology at BMG. “That means IT departments have to process 1,500 times the amount of data to calculate payments for artists, and this makes scalable micropayment processing very important.”
Until 2019, BMG’s infrastructure was entirely hosted on-premises. Hardware limitations made it challenging to scale on-demand, making it harder to handle the data peaks that royalty processing can bring. “With our on-premises infrastructure, we were going to hit a ceiling in a few years,” says Gaurav. “We still managed to process royalty payments for our clients, but it was increasingly time consuming and expensive. To keep focusing on our clients, rather than our infrastructure, we decided to migrate to Google Cloud.”
From the outset, Gaurav and his team had a clear vision for the partnership: “Most importantly, we needed a scalable solution for our royalty workloads that was intuitive for our developers. We also wanted a partner, not a client-vendor relationship,” he says. “With autoscaling via BigQuery, excellent customer support, and a clean and simple user interface, Google Cloud ticks every box for us.”
Keeping artists happy with business-as-usual payouts during migration
To move applications to the cloud while keeping payment cycles on track for its artists, BMG teamed up with Google Cloud partner Rackspace Technology. “We selected Rackspace Technology because it combines strong technical muscle and a global footprint, with the customer service of a local boutique firm,“ shares Gaurav.
BMG’s own technology team put together the outline for the Google Cloud architecture, which they passed on to Rackspace Technology for optimizations and the ultimate stamp of approval. Whenever Gaurav and his developers needed support, Rackspace Technology was ready to go. “So far, we’ve migrated 17 applications successfully, and Rackspace Technology has been 100% spot-on with each suggestion,” says Gaurav. “I can’t recall a single flaw in a Rackspace Technology-approved architecture, and that really says something.”
When BMG began its migration in August 2019, the team developed an ambitious two-year plan. Only 14 months later, however, the project is more than 75% complete. Among the solutions that BMG is using today are Cloud Storage to securely store 130 TB of data, and Cloud SQL as its standard database technology. The web applications run on Compute Engine, App Engine, and Google Kubernetes Engine.
“After successfully moving a few applications, it was clear that with the strong teamwork of BMG and Rackspace Technology, together with the ease of use of Google Cloud, we could speed up the project without sacrificing quality,” says Gaurav. “We’re set to complete our migration six months before schedule, helping us to quickly move out of our hybrid environment.”
“Our income-tracking teams are very savvy on the data, and the simplicity of Google Cloud empowers them to self-serve analytics, rather than wait for IT. Our teams are much more productive.”
—Gaurav Mittal, Vice President Group Technology at BMG
Royalty reporting and processing with BigQuery and Dataproc
So far, all of BMG’s critical workloads are up and running on Google Cloud. Royalty calculations, for example, which require incredible processing power and the collection of many micropayments to ensure full and timely payout, run entirely on Dataproc with output stored on BigQuery for downstream integration and reporting.
Enabling more harmonious workflows through self-serve analytics
As the new beating heart of BMG’s royalty reporting, BigQuery changed the rhythm of collaboration company-wide. In the past, income tracking teams had to contact IT departments if they needed deeper data insights for their work. By integrating Data Catalog with BigQuery, BMG has made the data more accessible to all teams. This helps them detect missing income and new revenue streams independently, maximizing profits for artists.
“Our income-tracking teams are very savvy on the data, and the simplicity of Google Cloud empowers them to self-serve analytics, rather than wait for IT,” says Gaurav. “Our teams are much more productive.”
“Google Cloud enables us to be more client focused and deliver better features faster. We believe it’s just the beginning. We offer rights and royalty services for music publishing, recorded music, neighboring rights, and books. Without scalability limitations, it’s absolutely conceivable to offer our platform as a service to other companies or industries, such as gaming. Google Cloud has opened a world of possibilities.”
—Sebastian Hentzschel, Chief Information Officer, BMG
With a leaner IT environment, BMG can focus its effort on the needs of its clients. Beyond improvements in royalty processing, it can concentrate on app development, releasing new features and enhancements more frequently. By hosting applications on Google Kubernetes Engine, App Engine, and Compute Engine, BMG has built a CI/CD pipeline with automated deployments and testing to significantly speed up workflows.
“In our old system, it could take several weeks to set up an environment,” says Gaurav. “With Google Kubernetes Engine, any of our developers can complete the process in a few clicks. Having that autonomy makes our developers more motivated and self-driven.”
“Google Cloud enables us to be more client focused and deliver better features faster,” adds Sebastian. “We believe it’s just the beginning. We offer rights and royalty services for music publishing, recorded music, neighboring rights, and books. Without scalability limitations, it’s absolutely conceivable to offer our platform as a service to other companies or industries, such as gaming. Google Cloud has opened a world of possibilities.”
With the migration almost complete, BMG is looking forward to its next technology project. It plans to leverage AutoML to further scale and automate royalty tracking with machine learning. On the marketing side, advanced analytics will help BMG determine the effectiveness of promotional campaigns around the world, further increasing profits for artists. By connecting Google Data Studio to BigQuery, BMG will increase the quality of its analyses, helping musicians better understand the reach of their music around the world.
In the end, Gaurav shares, helping musicians is what it all comes down to. “We’re a new kind of music company because we build our services around our artist, songwriter, and publisher clients, not the other way around,” he says. “Google Cloud is helping us maintain strong relationships with our clients, and that’s music to our ears.”
6172
Of your peers have already watched this video.
16:00 Minutes
The most insightful time you'll spend today!
Easy Access to Stream Analytics with Google Cloud
By 2025, more than a quarter of the data created in the global datasphere will be real-time in nature.
“This is important because in the real-time world, “the window of opportunity diminishes and goes away really fast. You want to be able to respond to your customer needs, their asks, and be able to do prediction or maybe detect some problem and really respond to it really fast,” says Evren Eryurek, Director of Product Management for Stream Analytics at Google Cloud.
Today, streaming analysis of application and user events only continue to become more central to how every business operates. With this development comes an accompanying rise in customer expectations for businesses to be aware, prepared, and delivering real-time solutions. Is your business ready?
In this session, Eryurek will showcase Google Cloud’s latest developments to enable easy access to creation and management of real-time data driven experiences.
Learn the latest about the products powering Google’s streaming capabilities and hear directly from the team bringing them to life.
Wayfair Writes its Success Story with BigQuery for Internal Analytics

4927
Of your peers have already read this article.
4:00 Minutes
The most insightful time you'll spend today!
Editor’s note: Home-goods and furniture giant Wayfair first partnered up with Google Cloud to transform and scale its storefront—work that proved its value many times over during the unprecedented surge in ecommerce traffic during 2020. Today, we hear how BigQuery’s performance and cost optimization have transformed the company’s internal analytics to create an environment of “yes”.
At Wayfair, we have several unique challenges relating to the scale of our product catalog, our global delivery network, and our position in a multi-sided marketplace that supports both our customers and suppliers. To give you a sense of our scale we have a team of more than 3,000 engineers with tens of millions of customers. We supply more than 20 Million items using more than 16,000 supplier partners.
Serving those constituents generates a lot of analytics work. Wayfair runs over a billion ‘analytic’ database queries a year, from both humans and systems, against multi-petabyte datasets. Scaling our previous environment to meet these challenges required us to maintain dozens of copies of data for different use cases and manage complex data synchronization routines to move trillions of records each day, resulting in long development times and high support costs for our analytics projects.
Centralizing our data using Cloud Storage and BigQuery enabled us to break down existing silos and build unified pipelines for our batch and real-time operations. BigQuery shines by letting us decouple our compute and storage resources and flexibly ingest structured data in streaming and batch modes. We also benefit from the same decoupling for more complicated machine learning (ML) workflows in Dataproc and Cloud Storage. In particular, BigQuery is extremely low maintenance. From ML and easy data integrations to the integrated query cache, many out-of-the-box features have proven valuable for multiple use cases.
Beyond storage and compute, Google Cloud offers multiple tools to maximize the value of our data. For example, we can easily connect Data Studio to BigQuery for lightning-fast dashboarding of enterprise KPI reporting. When we need to dive deeper into a metric, Looker provides an interface and semantic model that empowers more business users to answer important questions — without understanding SQL or our vast dataset and table structure.
The combination of all of Google Cloud’s tools enables every Wayfairian the opportunity to self-serve their data visualization and analysis needs. We are able to support all of the requirements of our internal and external users, from descriptive analytics to alerting and ML, in a platform that blends Google’s proprietary technology with open-source standards.we have seen a greater than 90% reduction in the number of analytic queries in production that take more than one minute to run
As a result, we have seen a greater than 90% reduction in the number of analytic queries in production that take more than one minute to run, which delights our users and increases adoption of our analytics tools across the business.
Higher performance means saying “Yes” more often
We went into the BigQuery experience expecting very strong performance on large, aggregate queries and excellent scalability — the kind of performance that could enable consistent 5-15 minute processing queries and 5-10 second response times for large analytics queries.
We weren’t disappointed — we saw slightly better than linear performance profiles as record counts went up from millions to trillions for a flat resource allocation. BigQuery had the expected high performance for aggregate queries. This made our large data processing pipelines predictable and straightforward to maintain and optimize.
Below is a plot of gigabytes processed by a query against query run time in seconds; outliers are filtered and the axes are pruned to ranges where we had a large sample size. This focuses on longer-duration queries. As an example of the linear performance, a 2 terabyte query averages 5 minutes — 2.5min/terabyte — and an 18 terabyte query (9 times as much data) averages 25s — only 1.4min/terabyte. This is despite the fact that complex queries [sorting and analytic functions are particularly problematic] are more common with large data sizes. We do see increasing variability at large sizes as slot limits and other resource constraints come into play, but these factors are controllable and ultimately a business optimization decision.
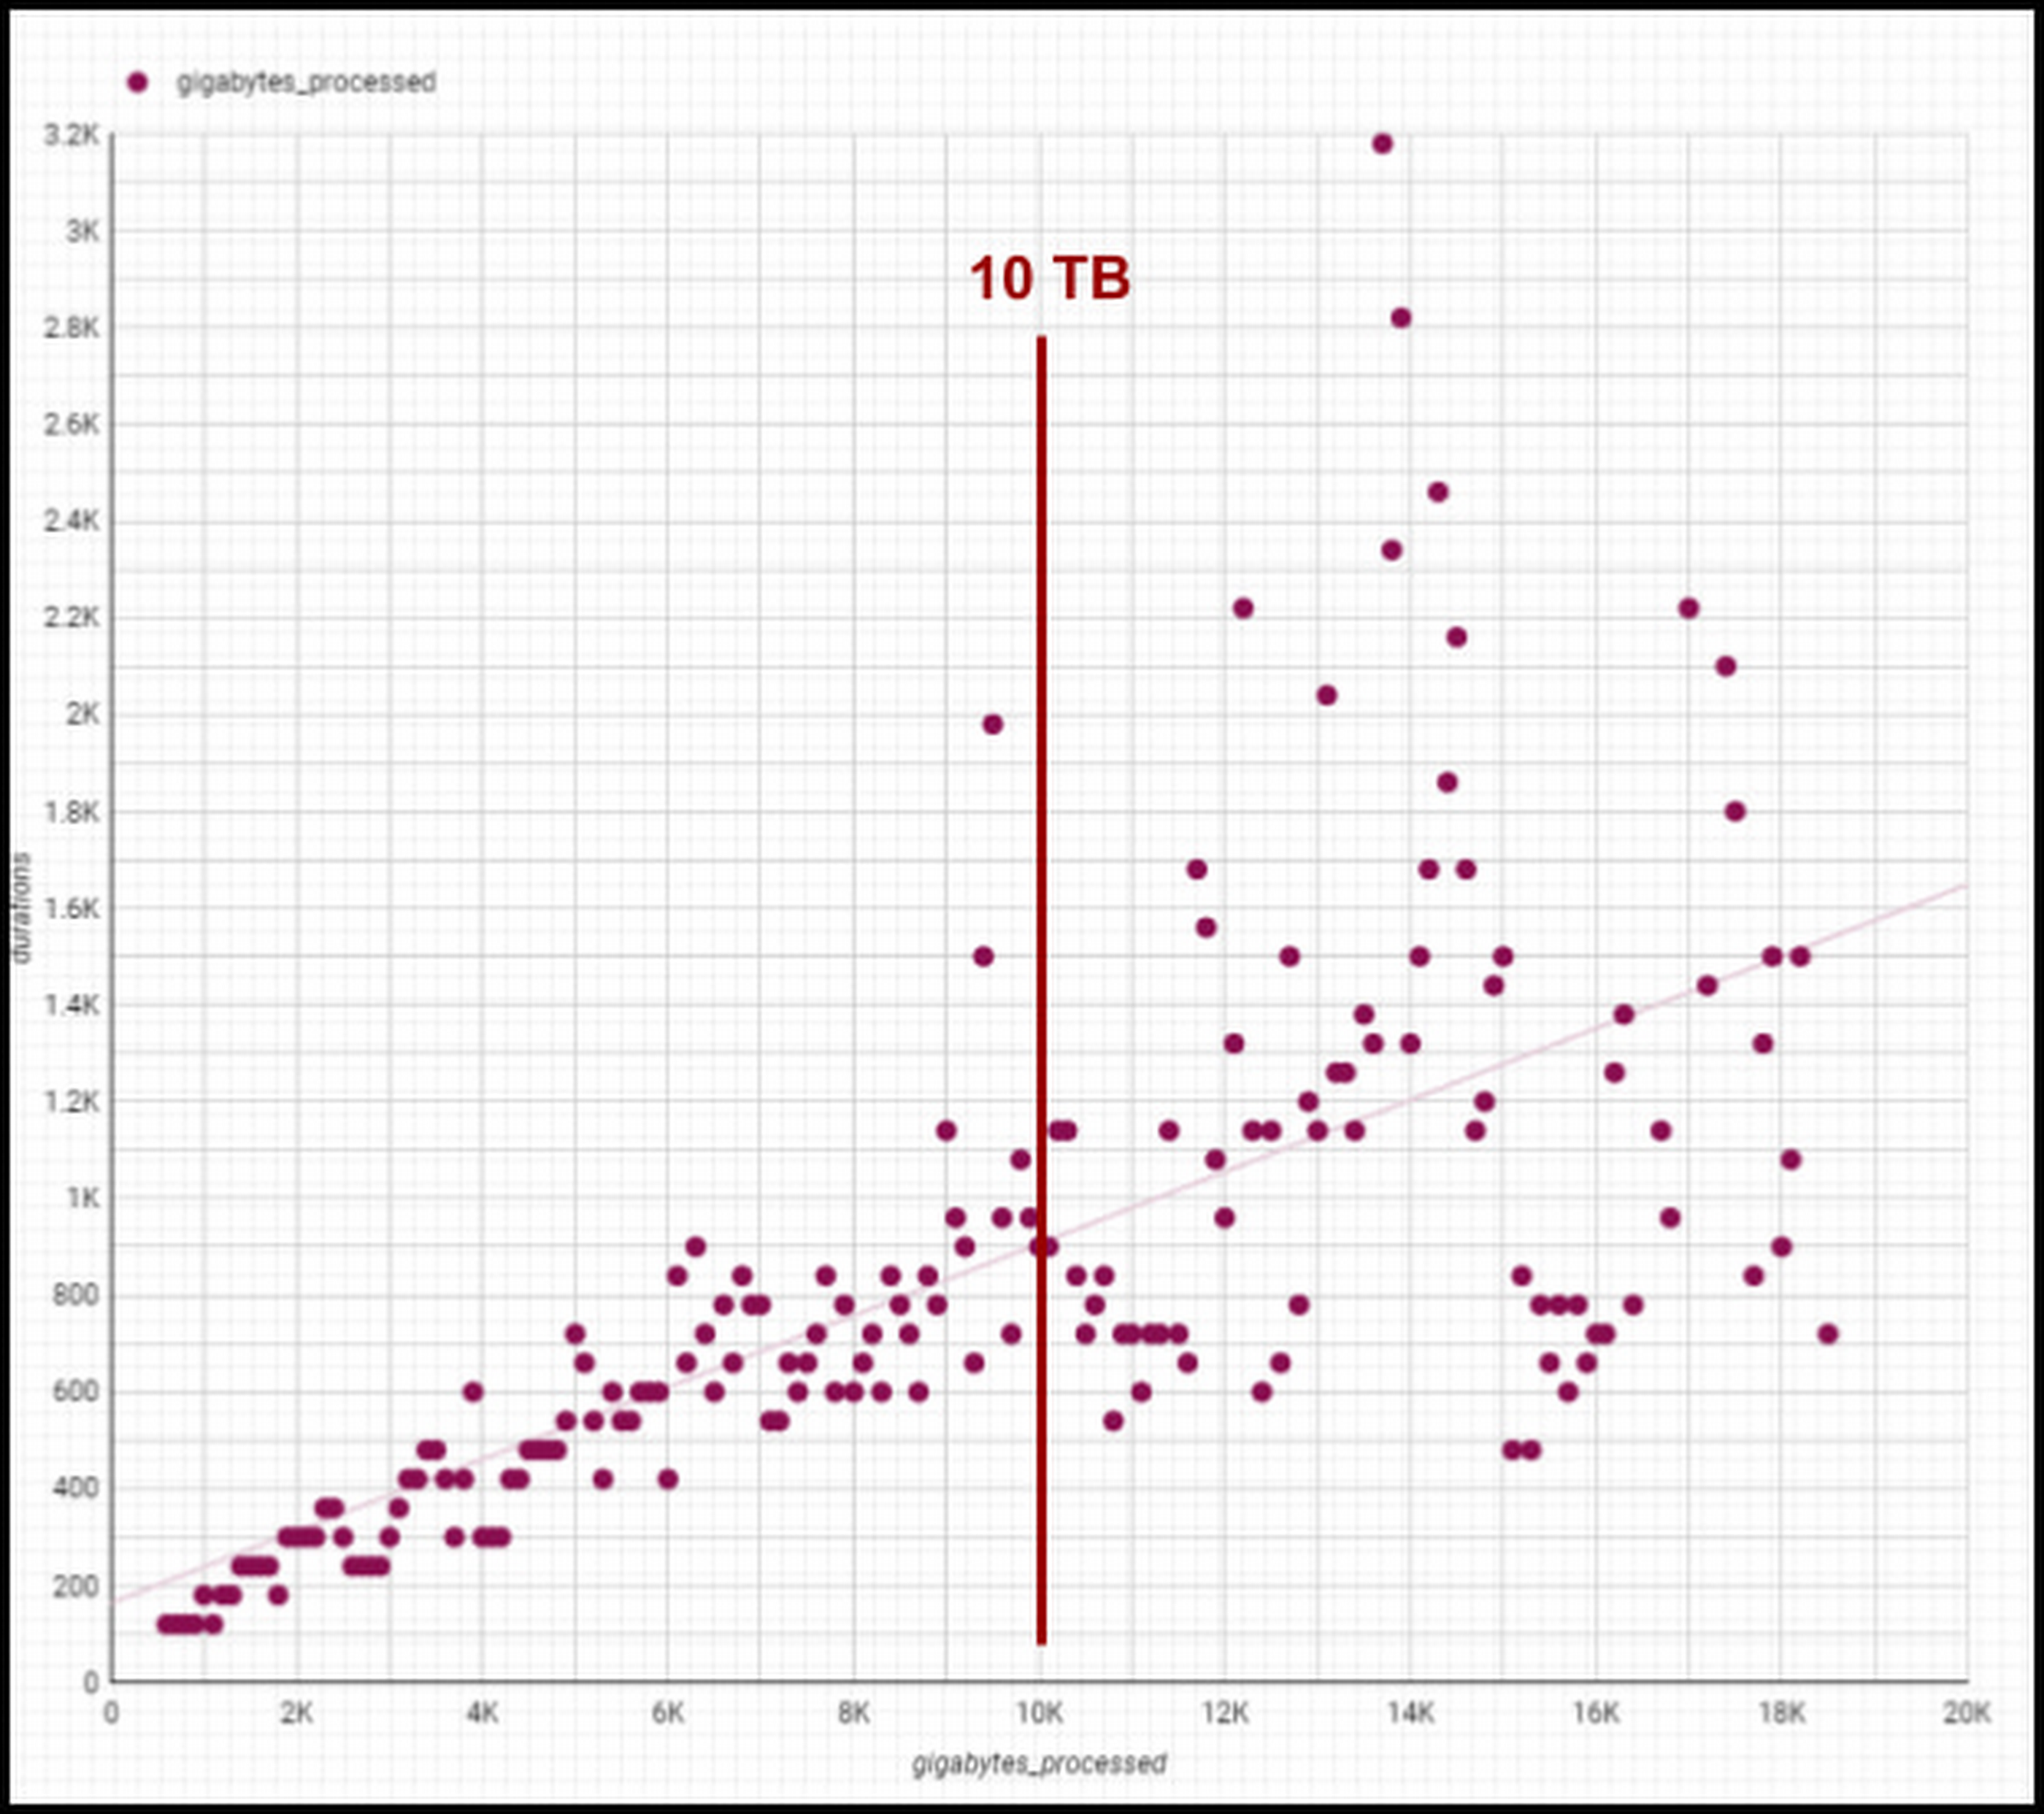
Though individual values vary greatly depending on query complexity [analytic functions/sorting can be computationally expensive], the overall trend line is below 1-1 for bytes versus duration, meaning our BigQuery query runtimes are increasing slower than our data volumes. We are still seeing sub 1:1 threshold runtimes, and we’re already at 100 PB of total data with single queries running on 50PB or more. Going strong!
One unexpected and pleasant surprise has been high performance for smaller queries, such as those required for development, interactive analytics, and internal applications we use for forecasting, segmentation, and other latency-sensitive data workflows. BigQuery’s resource management systems have provided smoother degradation and parallelism profiles than we initially expected for a multi-tenant platform.
We regularly see sub-second p50 query performance for interactive use cases, with p90 performance coming in under 10 seconds for Looker, Data Studio, and AtScale — meeting the threshold we set to avoid analysts losing focus during a business investigation. The chart below shows p50, p90, and p95 timing for core workloads, as well as the number of queries in each bucket and the number of unique users. [Looker and Atscale will use small numbers of service accounts for a large number of users].

This has enabled two important shifts in the way our customers experience analytics services:
- Delivering better user productivity. People no longer have long wait times to get results for a basic query delivering an improved overall user experience.
- Scaling our data transformation. BigQuery has proven, effective data transformation that allows us to embrace the industry shift away towards ELT (extract, load, transform) to transform raw data right within the database.
We no longer have to ask ourselves, “Can we meet the SLA for this data processing task?” The new conversation is, “Of course, we can meet it. What’s the associated cost based on how many resources we assign?” We can make cost and resource trade-offs clear to our users and say “yes” more often to requirements that have measurable business value.
Supporting cost vs. performance decisions
Democratized access to internal analytics is a powerful decision-making tool. With BigQuery’s robust tooling, the decision about how to best allocate computational resources is in the hands of the analytics groups closest to the business decision being made. If they want to spend a sprint optimizing a dashboard, they can show exactly how much money it will save. If they choose not to optimize a report, they can offset the decision with concrete cost savings and other realized value.
Wayfair teams also benefit from visibility into their committed costs by abstracting away the details of the underlying services, including BigQuery slots, the virtual CPUs used to execute SQL queries.
Take a look at this example view consumed by our teams (the metrics for these dashboards are from the BigQuery INFORMATION_SCHEMA (jobs and reservations tables):
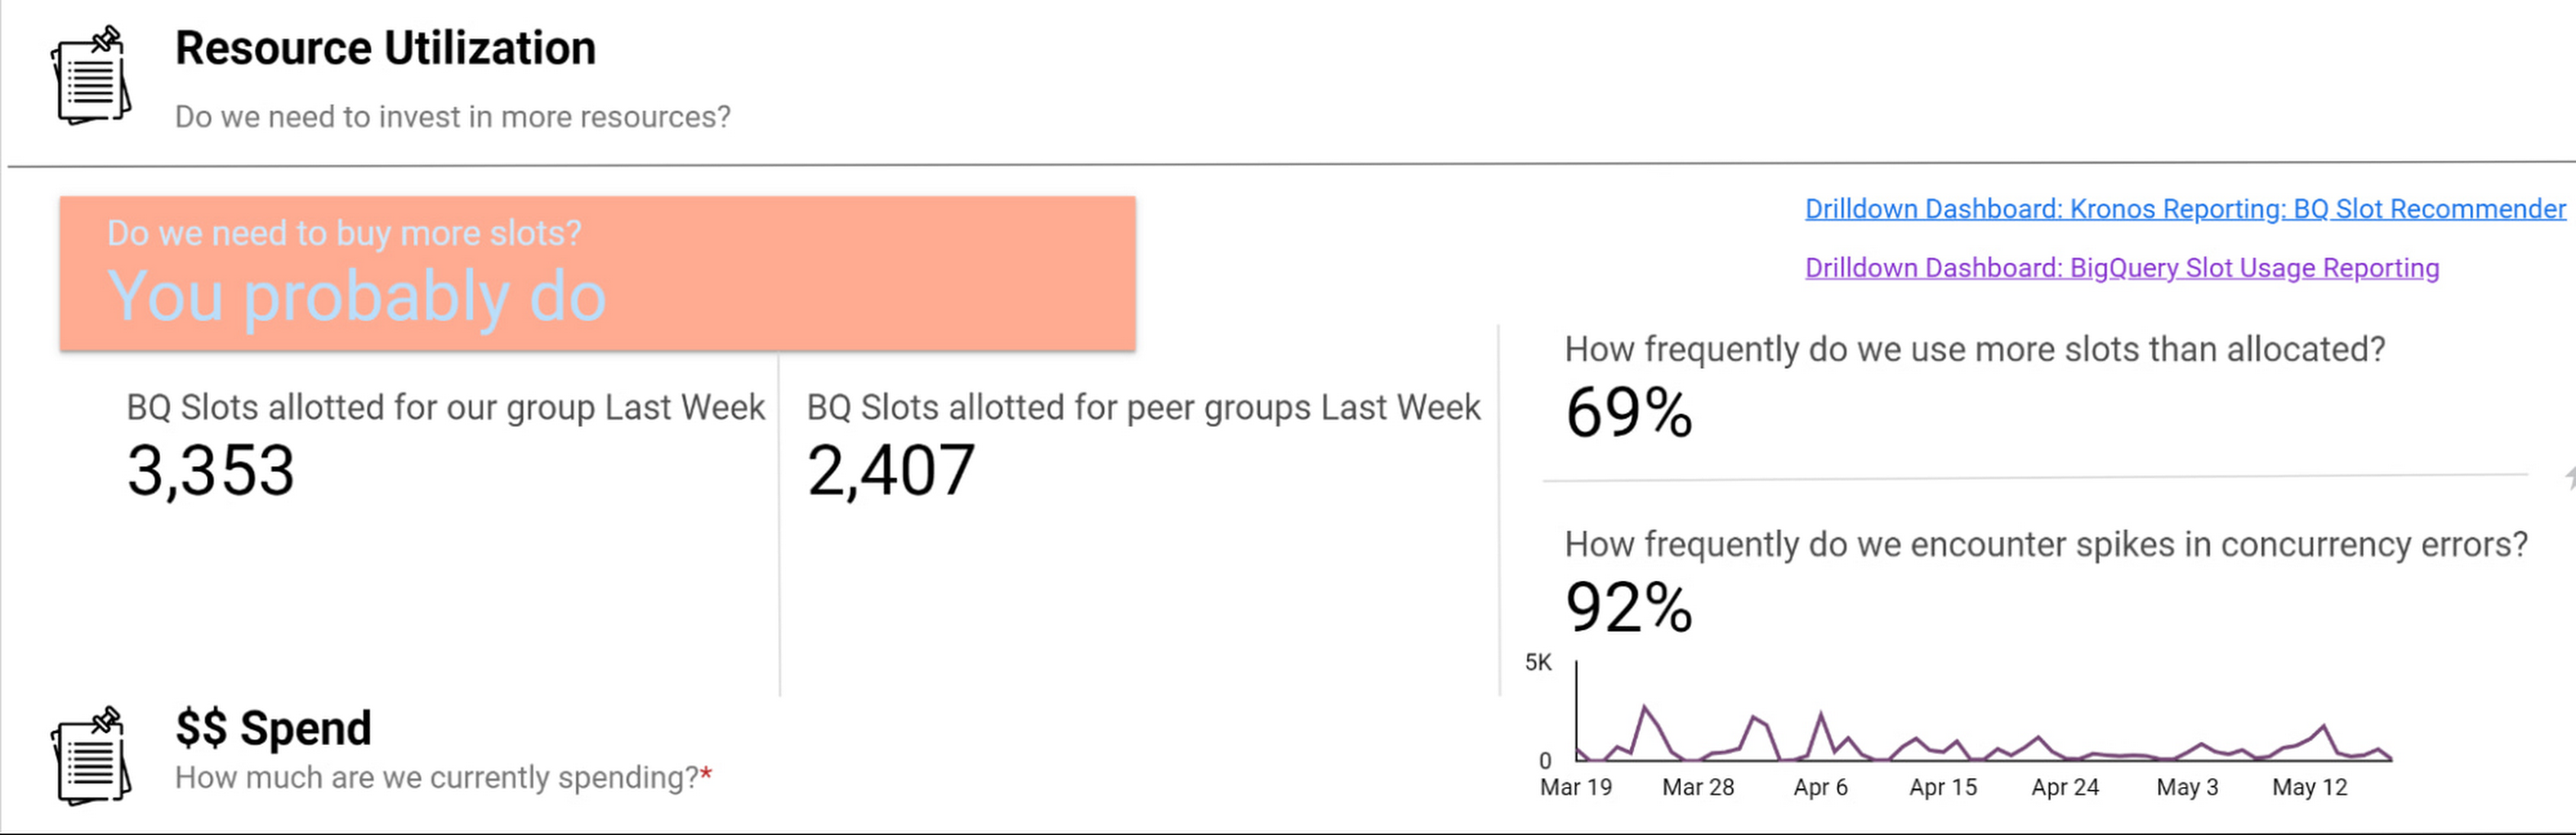
Suppose an organization wants to purchase capacity for a period of time. In that case, we provide an average cost for a slot during that time and charge them based on their slot usage for queries, multiplied by the average price.
Teams can see whether their consumption matches their reservations with a consistent, high-level number. We apply the same approach to tools like Dataproc by aggregating up the costs of component services and providing an organizational cost for those services.
How we use performance signals to improve user efficiency
Instead of overcorrecting for occasional performance fluctuations by allocating excessive resources, we try to align incentives so that people make the right choices for the business. Showback doesn’t work in a vacuum — it requires context and integrated insights. Teams need to show the cost of running a dashboard as well as the ROI is in terms of end user engagement and what peer dashboards with equivalent source datasets might cost.
We want to give users the freedom to do things the way they want and need to while also educating them on achieving their goals and using best practices to reduce their costs and improve their performance. The goal is never for all dashboards to load “less than x seconds” — we believe that any dashboard can load in x seconds when it is properly designed and resourced.
For instance, BigQuery allocates slots for a new workload quickly and efficiently, and queries that are optimized and have dedicated resources consistently complete quickly. When users experience a slowdown, it’s typically because they are sharing resources or inefficiently using their resources. Variable performance is a useful signal to help users discover opportunities to optimize queries and work more productively. We value these signals as we like to focus on the aggregate experience of all users interacting with the tool, not individual interaction.
A natural way to improve user efficiency is to reward ideal behaviors and discourage those that do not align with our analytics strategy. Some examples include splitting out high-demand reporting from ad-hoc exploration to reduce concurrency errors or encouraging people to use materialized tables instead of writing complex custom SQL. For instance, a dedicated reporting project might only include an organization’s Data Studio dashboard if it directly references a table or meets other optimization requirements. Using this approach, we give our users a high degree of freedom and experimentation at the entry-level while providing a well-documented path to scale.
Visibility into query performance improves business performance
The detailed tracking information we get from Google Cloud products is critical — Google’s robust analytics performance has enabled us to scale Data Studio to over 15,000 Wayfarians. Of course, a larger user base always comes with concerns that less sophisticated users may not appropriately optimize their queries or make the best use of the infrastructure.
Evaluating the different Data Studio dashboards helps us identify opportunities to use better query optimization practices, such as reducing custom queries, connecting directly to permanent tables, or using the BI Engine to improve dashboard performance. Recently, our team built new billing projects specific for Data Studio reporting. We can scale up a reservation dedicated to reporting about a major sales event in minutes.
Beyond everyday reporting, holidays and sales events may require higher, guaranteed performance. BigQuery’s flexible capacity commitments allow us to decide at a business level whether an urgent need requires us to reprioritize resources immediately or whether we have the time to optimize queries and rebuild dashboards to be performant. These new billing projects let us evaluate if teams need to scale up resourcing, what areas they can optimize in BigQuery, or if a new reservation is needed to resource that team separately.
Recommendations for achieving high performance at low cost
Are you wondering how to allocate BigQuery slots? Teams must see direct, immediate return on their investment in performance and optimization.
Our first rule of thumb is to align resource utilization with ownership as closely as possible. This makes it easier for teams to secure dedicated resources, even if they start out small. We’re comfortable doing this because BigQuery dynamically reassigns capacity between the targeted reservation and other consumers in milliseconds. We always get the total usage of our slots — there is no wasted capacity even when we break assignments down granularly.
Once a team has a reservation, we provide reporting that consumes various BigQuery information schema views, such as query logs and reservation information, and processes it into aggregated reporting. We look for metrics like the average slots available to a query at a point in time, overall query performance, and how long queries took to execute to pinpoint the overall health of a reservation against our business objectives. Flex slots also let us experiment easily with additional capacity, and BigQuery’s performance is so consistent that we can use straightforward models to estimate return on additional slot investment.
Other key cost optimization tips we have found helpful at Wayfair include:
- Optimize for worst-case performance. Given BigQuery’s ability to share slots, we expect teams will often see much better performance, but we find that thinking it’s more effective when teams think about the most pessimistic case when resourcing their jobs.
- Take advantage of BI Engine reservations. We like to think critically about the data and workload. BI Engine reservations are excellent for workloads that query lots of small dimension tables or a few larger tables loaded into memory. In cases like that, such as with OLAP tools using pre-computed aggregates, we’ve seen BI engine investments drive a 25% reduction in average query time—excellent ROI.
- Leverage Looker for large, longitudinal datasets. Since Looker supports a wide range of use cases, we see a broader range of performance — p50 is still under a second, but p95 can get as high as a minute. For these cases, we recommend modeling user patterns [first of month, first day of week] and dynamically allocating more slots for these periods while deprioritizing batch workloads in the key windows.
- Lean in heavily on the BQ cache for broad-based reporting. To avoid a Monday morning reporting lag, We use the BigQuery cache to avoid Monday morning report loading lags. Up to 30% of our Data Studio queries hit the BQ cache, ensuring our Data Studio p95 consistently stays under 10 seconds.
- Use slots-per-job to improve experience. In our reporting, we find that the most valuable view is slots-per-job. We look for dips in slots available for jobs as this situation often correlates strongly with poor user experiences. For example, our reporting showed us that Looker has the highest volumes of queries and users on Mondays and during each month’s first two business days. We used this information to scale up slots to support these periods of highest demand, delivering on performance SLAs to support business users.

- Get a global picture of usage. We manage slots in a central tool. Teams input their requirements into a calendar to indicate when they want higher or lower capacity to inform our flex slot purchases and annual commitments. It might seem like dozens of relatively inconsistent workloads at the team level, but the picture changes when you look at demand across a week (or our entire business). Understanding global usage makes it easy for us to model baseline capacity recommendations for serving year slots versus flexible demands.
Reaping the rewards of BigQuery
From our first initial undertaking with Google Cloud to transform our storefront, we had a lot of confidence in the underlying technology offerings and the teams that ran them and their ability to meet our unique requirements. But our experience using BigQuery for internal analytics at Wayfair has exceeded our already high expectations.
BigQuery’s fast, dynamic allocation of resources and ability to transform data in place are important to our mission of maintaining consistently high performance for our users while closely managing costs. Moreover, our visibility into query and dashboard performance through BigQuery’s DSP views and other performance metrics have helped us make clearer connections between performance goals and the costs required to meet them — and guide our analysts across the company towards attaining high performance on every project.
Marks & Spencer Aims to Bring a Third of business Online and Google Contact Center AI is Key to its Success

5779
Of your peers have already read this article.
6:20 Minutes
The most insightful time you'll spend today!
“Hello, Marks & Spencer. How may we help you?”
As one of the biggest and best-loved retail brands in the UK, Marks & Spencer (M&S) is known for the personalized service it provides to its 30 million loyal customers. For 135 years and in 57 countries around the world, M&S has worked to meet and exceed customer expectations for quality and service. Since the advent of the telephone, this has meant cheerfully servicing customers who call in to M&S branches or into their contact centers, no matter what their request might be.
“Retail is in a state of flux and M&S is transforming to better serve our customers so that we can compete and win. Automating calls into our stores with Google voice recognition gives us every opportunity to get things right for our customers and keep them coming back again and again.”
—Akash Parmar, Enterprise Architect (Digital Customer Engagement), Marks & Spencer
The company now has a goal of bringing one third of its business online by 2022. In order to engage more customers online, it has opened a new voice channel hosted on Google Cloud.
The company previously had switchboards in 13 different stores across the UK and Ireland (UKI), handling up to nine million calls a year. But as its retail offering evolved across multiple channels, it was becoming increasingly difficult to quickly and effectively answer customer service requests using an outdated switchboard model.
Customers might call in to order an outfit they had seen in a store, to inquire about returning a dress they bought online, or to recover a lost umbrella in a food hall. Each of these different requests required a different routing response from staff, and if the company didn’t act soon, it knew that the cost of managing the increase in call volume would lead to a significant cost impact. M&S decided it was time to make a technological leap forward to meet customers’ expectations in the new, omnichannel retail environment.
“Retail is in a state of flux and M&S is transforming to better serve our customers so that we can compete and win,” says Akash Parmar, Enterprise Architect for Digital Customer Engagement at M&S. “Automating calls into our stores with Google voice recognition gives us every opportunity to get things right for our customers and keep them coming back again and again.”
Boosting opportunities for customer engagement with voice recognition
M&S customers were used to dealing with their local store for anything they needed. But as stores were completely separate from the online business, customers weren’t able to purchase something they’d seen online by calling stores because the store staff didn’t have access to platforms needed to place an online order securely. For a company that places a very high importance on customer experience, this was unacceptable.
Akash Parmar, Enterprise Architect for Customer Engagement, was set a the goal by Chris McGrath, M&S Programme Manager, to ensure that the right channel and the right level of assistance was available to customers at any point before, during, or after purchase. Akash set himself the challenge of building a platform that could adapt to all of these channels and scale very quickly.
“We didn’t have the resources to build a speech recognition platform. DVELP removed that obstacle. It understood what we wanted to achieve and how Google Voice APIs and Twilio could get us there. Whatever we want, DVELP builds it for us. DVELP always presents options, never problems.”
—Akash Parmar
In 2018, Akash reached out to Google Cloud partner DVELP, one of the UK’s leading experts on the Twilio programmable contact center platform and Google speech recognition technology. DVELP recommended a Google Cloud-based natural language speech recognition platform that leverages the audio stream intent detection functionality in the Contact Center AI solution, Dialogflow, as the heart of an inbound-call-handling strategy. This strategy was designed to improve routing accuracy, give customers more self-service options, and increase analyst visibility into customer journeys.
“We didn’t have the resources to build a speech recognition platform. DVELP removed that obstacle,” says Akash. “They understood what we wanted to achieve and how Google Cloud Voice APIs and Twilio could get us there. Whatever we want, DVELP builds it for us. DVELP always presents options, never problems.”
Using Google speech recognition to improve customer experience
M&S wanted to use natural language to enable customers to speak and state what help they required rather than choose from a list of options. This would help them answer the millions of calls coming in and figure out what customers needed quickly.
In order to do that, DVELP needed to consider how best to address tying customer intent to actions, while maintaining flexibility. DVELP recommended the unconventional choice of not referencing intent in the application layer, but mapping the available actions to the information required to perform them. These actions were then used to build a “declarative dictionary” for the customer service team.
By focusing on actions rather than intents, the solution enables the customer services team to configure actions to intents in virtually any combination of key-value pairs. Leveraging the fact that Dialogflow can detect and respond to customer intents in real time, M&S has already reached 92% accuracy in translating customer declarations to actionable intents.
“With Google Cloud speech recognition and Contact Center AI solutions such as Dialogflow, there’s no information that we can’t make sense of. No matter where you call from, who you are, your age, your gender: you speak, and we understand.”
—Akash Parmar
Akash recalls that once customers became comfortable with the prompt, “in a few words, how may we help you?” they started providing simple, concise responses, and the customer learning curve quickly leveled out. At that point, Google Cloud speech recognition and Dialogflow took over. “The technology worked perfectly and the result was like magic,” says Akash.
“With Google Cloud speech recognition and Contact Center AI solutions such as Dialogflow, there’s no information that we can’t make sense of,” he says. “No matter where you call from, who you are, your age, your gender: you speak, and we understand.”
Enabling self-service contact center improvements with Dialogflow
It was important to M&S that contact center employees be self-sufficient in updating the platform to reflect changes in demand. They needed to be able to easily react to a spike in inquiries about a special offer, for example, without relying on the engineering team. At the same time, neither Akash nor the DVELP team wanted the staff to have to learn error-prone JSON inside contexts, or write responses in order to get necessary information from customers.
DVELP’s creative solution was to fill out the “Action and parameters” section of every intent. This is usually reserved for collecting information from customer declarations, but was also easily adapted to implementing custom key-value pairs. This is particularly helpful in making sure that the contact center is ready to handle new promotions as they arise. As sales and special events are communicated to the contact center from the head office, staff can program specific vocabulary directly into Dialogflow, thanks to Contact Center AI, ensuring that the M&S system is immediately ready to handle related customer calls.
Rolling out the platform to the UK and Ireland
In just a few months after going live, calls are being efficiently routed to the contact center and its existing customer service platform. At the contact center, staff can quickly and easily respond to customer requests, place orders, and process returns. Thanks to the natural language capabilities of Google Cloud, a simple customer request like “order the red children’s dress in the Bath high street window in size six” not only gets correctly routed, but provides data points for future personalized interactions.
Being able to accurately recognize customer intent 92% of the time after less than four months since deployment is an important milestone for M&S. With a concurrent 89% voice-to-text accuracy rate for Dialogflow transcriptions, M&S has rolled out the successful speech recognition platform to all of its stores in UK and Ireland and customer service contact centers.
Akash is so pleased with the performance of the new Google Cloud platform that he’s focusing on what new functionality he can add next to improve customer experience even more.
“We’re working on collecting product codes from customers using natural language so we can give them stock availability details,” he shares. “We also want to use Google Cloud to enable a more conversational experience when customers are searching for help or FAQs on our website. At the same time, we’re looking at Contact Center AI and Dialogflow to provide a virtual assistant experience for our webchat journey. Thanks to our new voice solution, we can clearly understand the key issues that our customers face on a day-to-day basis; the aim now is to start solving these issues through self-service and automation.”
Recommendations for Modelling SAP Data inside BigQuery

8398
Of your peers have already read this article.
4:00 Minutes
The most insightful time you'll spend today!
Over the past few years, many organizations have experienced the benefits of migrating their SAP solutions to Google Cloud. But this migration can do more than reduce IT maintenance costs and make data more secure. By leveraging BigQuery, SAP customers can complement their SAP investments and gain fresh insights by consolidating enterprise data and easily extending it with powerful datasets and machine learning from Google.
BigQuery is a leading cloud data warehouse, fully managed and serverless, and allows for massive scale, supporting petabyte-scale queries at super-fast speeds. It can easily combine SAP data with additional data sources, such as Google Analytics or Salesforce, and its built-in machine learning lets users operationalize machine learning models using standard SQL — all at a comparatively low cost.
If your SAP-powered organization is looking to supercharge its analytics with the strength of BigQuery, read on for considerations and recommendations for modeling with SAP data. These guidelines are based on our real-world implementation experience with customers and can serve as a roadmap to the analytics capabilities your business needs.
Considerations for data replication
Like most technology journeys, this one should start with a business objective. Keeping your intended business value and goals in mind is critical to making the right decisions in the early steps of the design process.
When it comes to replicating the data from an SAP system into BigQuery, there are multiple ways to do it successfully. Decide which method will work best for your organization by answering these questions:
- Does your business need real-time data? Will you need to time travel into past data?
- Which external datasets will you need to join with the replicated data?
- Are the source structures or business logic likely to change? Will you be migrating the SAP source systems any time soon? For instance, will you be moving from SAP ECC to SAP S/4HANA?
You’ll also need to determine whether replication should be done on a table-by-table basis or whether your team can source from pre-built logic. This decision, along with other considerations such as licensing, will influence which replication tool you should use.
Replicating on a table-by-table basis
Replicating tables, especially standard tables in their raw form, allows sources to be reused and ensures more stability of the source structure and functional output. For example, the SAP table for sales order headers (VBAK) is very unlikely to change its structure across different versions of SAP, and the logic that writes to it is also unlikely to change in a way that affects a replicated table.
Something else to consider: Reconciliation between the source system and the landing table in BigQuery is linear when comparing raw tables, which helps avoid issues in consolidation exercises during critical business processes, such as period-end closing. Since replicated tables aren’t aggregated or subject to process-specific data transformation, the same replicated columns can be reused in different BigQuery views. You can, for instance, replicate the MARA table (the material master) once and use it in as many models as needed.
Replicating pre-built logic
If you replicate pre-built models, such as those from SAP extractors or CDS views, you don’t need to build the logic in BigQuery, since you’re using existing logic. Some of these extraction objects have embedded delta mechanisms, which may complement a replication tool that can’t handle deltas. This will save initial development time, but it can also lead to challenges if you create new columns, or if customizations or upgrades change the logic behind the extraction.
It’s also important to note that different extraction processes may transform and load the same source columns multiple times, which creates redundancy in BigQuery and can lead to higher maintenance needs and costs. However, replicating pre-built models may still be a good choice, since doing so can be especially useful for logic that tends to be immutable, such as flattening a hierarchy, or logic that is highly complex.
How you approach replication will also depend on your long-term plans and other key factors — for example, the availability (and curiosity) of your developers, and the time or effort they can put into applying their SQL knowledge to a new data warehouse.
With either replication approach, bear in mind when designing your replication process that BigQuery is meant to be an append-always database — so post-processing of data and changes will be required in both cases.
Processing data changes
The replication tool you choose will also determine how data changes are captured (known as CDC – change data capture). If the replication tool allows for it (for example as SAP SLT does) the same patterns described in the CDC with BigQuery documentation also apply to SAP data.
Because some data, like transactions, are known to be less static than others (e.g., master data), you need to decide what should be scanned in real time, what will require immediate consistency, and what can be processed in batches to manage costs. This decision will be based on the reporting needs from the business.
Consider the SAP table BUT000, containing our example master data for business partners, where we have replicated changes from an SAP ERP system:
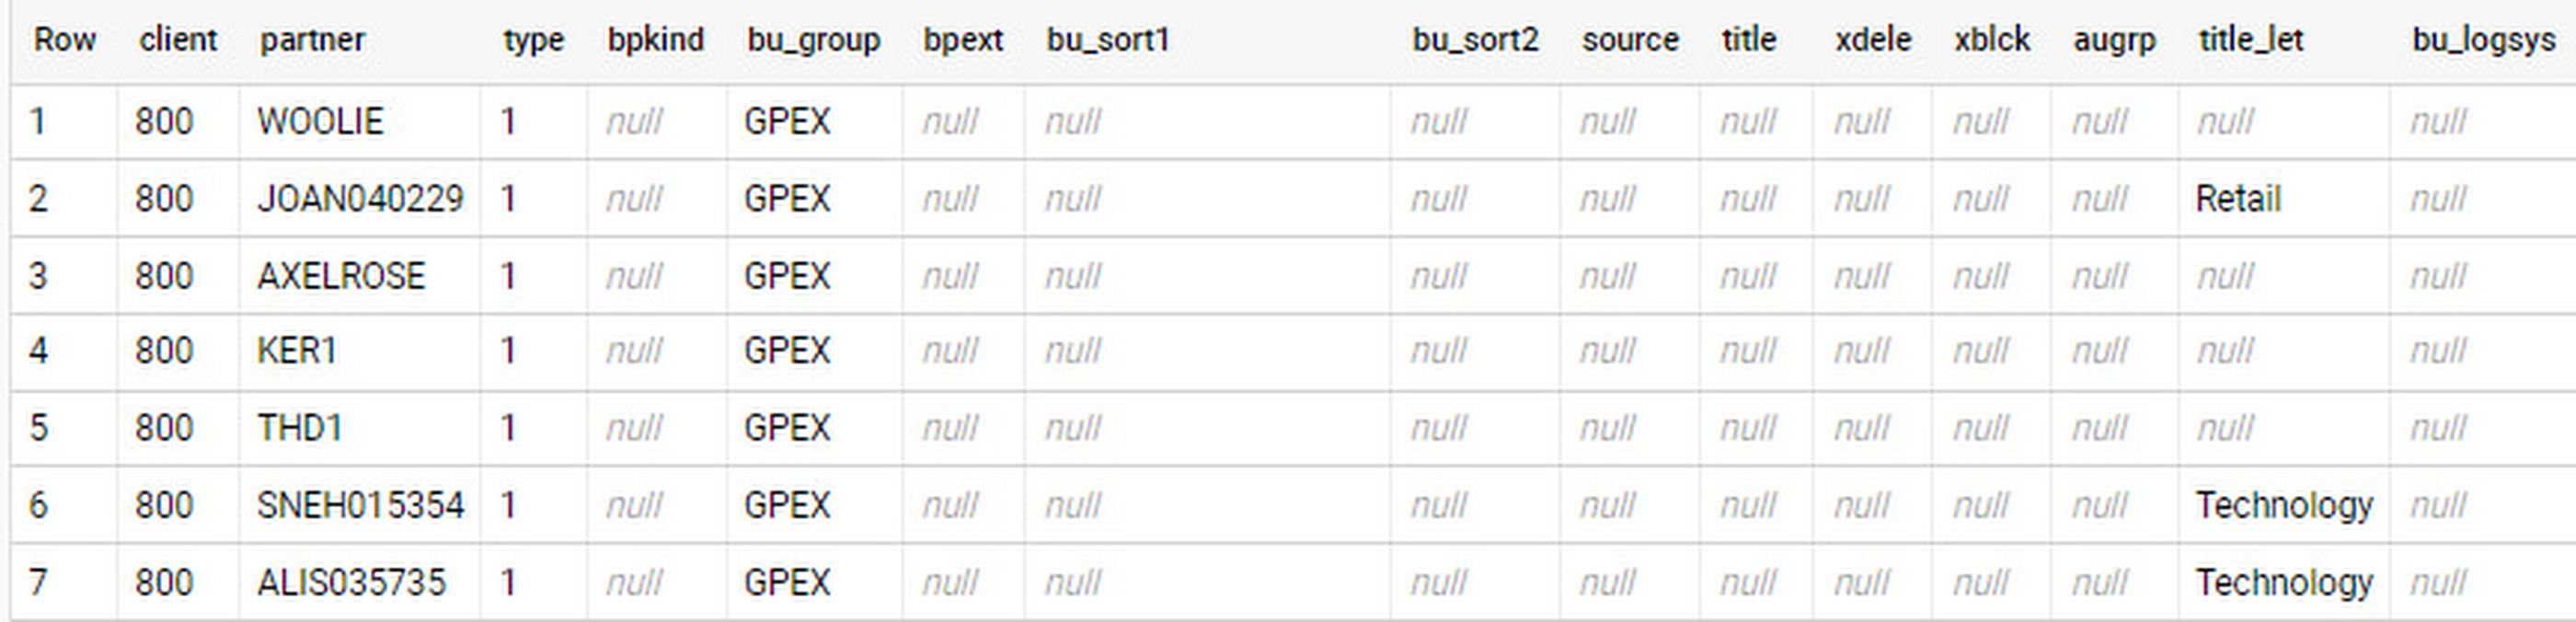
In an append-always replication in BigQuery, all updates are received as new records. For example, deleting a record in the source will be represented as a new record in BigQuery with a deletion flag. This applies to whether the records are coming from raw tables like BUT000 itself or pre-aggregated data, as from a BW extractor or a CDS view.
Let’s take a closer look at data coming particularly from the partners “LUCIA” and “RIZ”. The operation flag tells us whether the new record in BigQuery is an insert (I), update (U) or deletion (D), while the timestamps help us identify the latest version of our business partner.
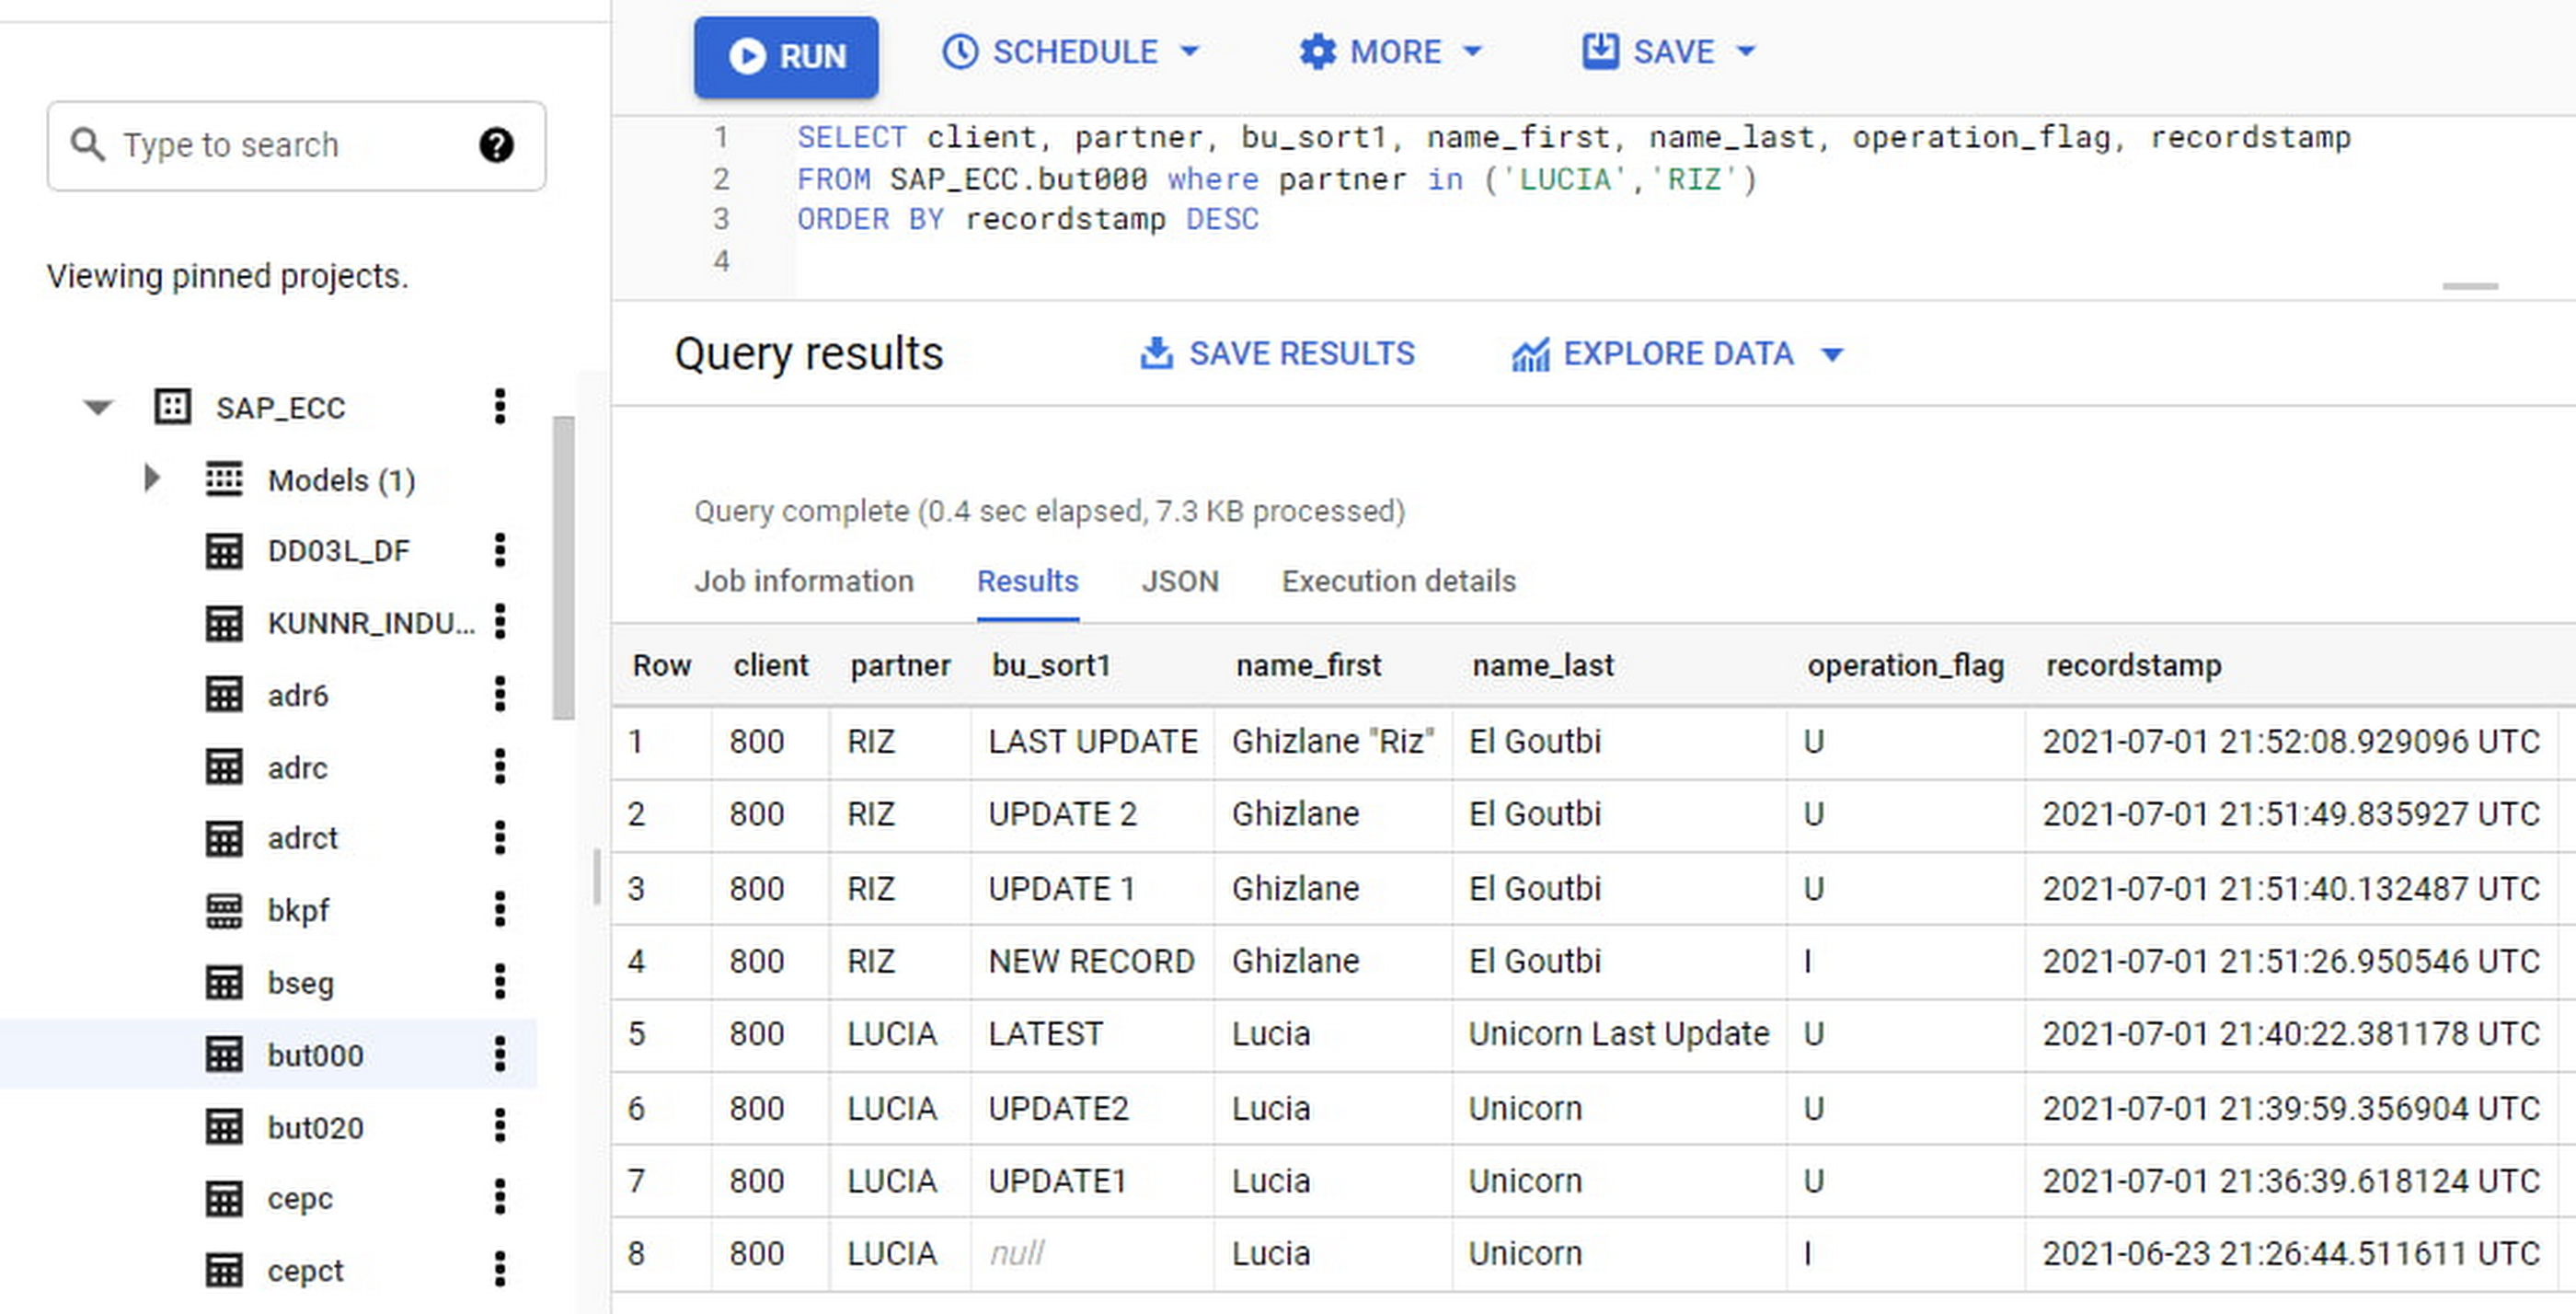
If we want to find the latest updated record for the partners LUCIA and RIZ, this is what the query would look like:
SELECT partner,ARRAY_AGG(i1 ORDER BY i1.recordstamp DESC LIMIT 1) AS rowFROM SAP_ECC.but000 i1WHERE partner in ('LUCIA','RIZ')GROUP BY partner
With the following result:
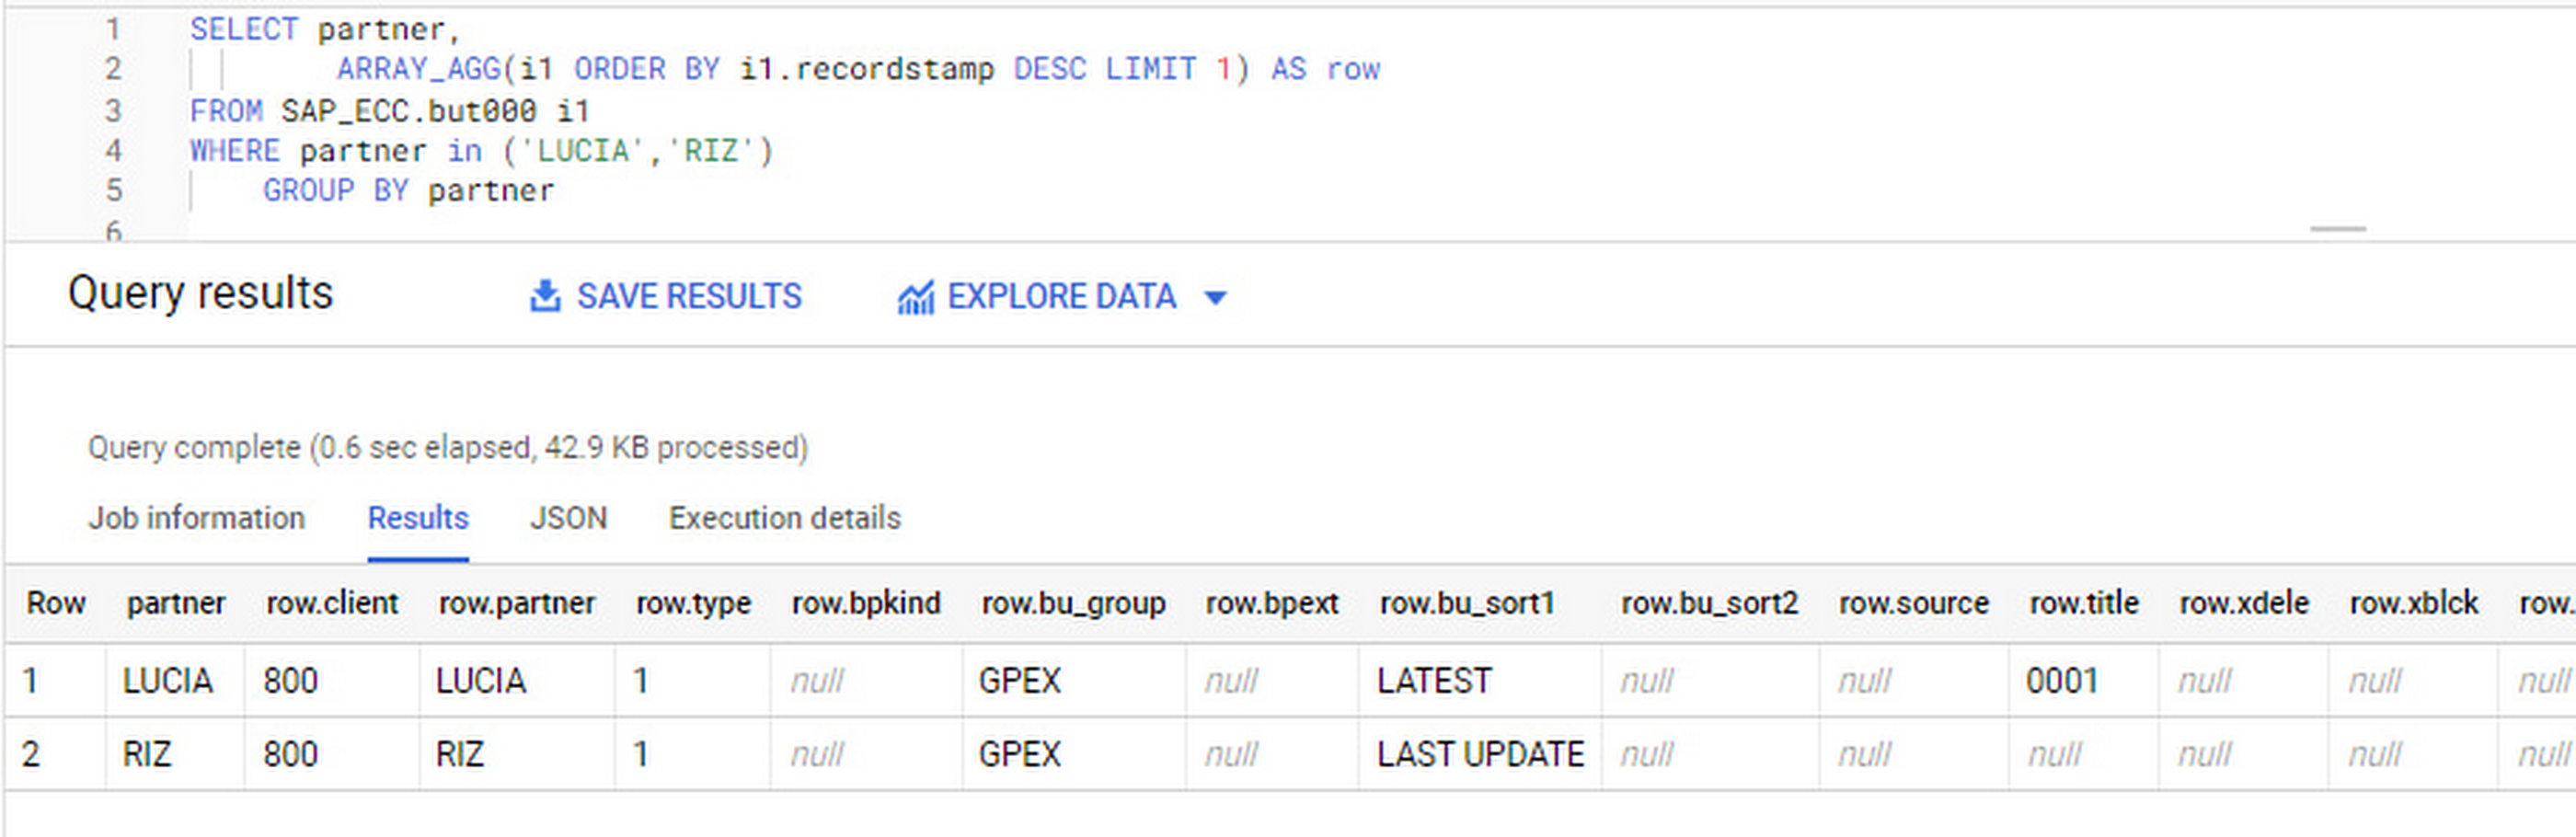
After identifying stale records for “LUCIA” and “RIZ” business partners, we can proceed to deleting all stale records for “LUCIA” if we do not want to retain the history. In this example, we are using a different table to which the same replication has been done, for the purpose of comparison and to check that all stale records have been deleted for the selection made and that we only kept last updated records. For example:
DELETE SAP_HANA.but000 i1WHEREi1.recordstamp < TIMESTAMP_SUB(CURRENT_TIMESTAMP(), INTERVAL 3 HOUR) ANDi1.recordstamp < (SELECT MAX(recordstamp) FROM SAP_HANA.but000 i2WHEREi1.partner = i2.partnerand partner="LUCIA")
You can also use the following query to retrieve stale records for “LUCIA” partner before moving forward with deletion
SELECT partner, operation_flag, recordstamp FROM SAP_HANA.but000 i1WHEREi1.recordstamp < TIMESTAMP_SUB(CURRENT_TIMESTAMP(), INTERVAL 3 HOUR)ANDi1.recordstamp < (SELECT MAX(recordstamp) FROM SAP_HANA.but000 i2WHEREi1.partner = i2.partnerand partner="LUCIA")
Which produces all of the records, except the latest update:

Partitioning and clustering
To limit the number of records scanned in a query, save on cost and achieve the best performance possible, you’ll need to take two important steps: determine partitions and create clusters.
Partitioning
A partitioned table is one that’s divided into segments, called partitions, which make it easier to manage and query your data. Dividing a large table into smaller partitions improves query performance and controls costs because it reduces the number of bytes read by a query.
You can partition BigQuery tables by:
- Time-unit column: Tables are partitioned based on a “timestamp,” “date,” or “datetime” column in the table.
- Ingestion time: Tables are partitioned based on the timestamp recorded when BigQuery ingested the data.
- Integer range: Tables are partitioned based on an integer column.
Partitions are enabled when the table is created, as in the example below. A great tip is to always include the partition filter as shown on the left-hand side of the query.

Clustering
Clustering can be created on top of partitioned tables by applying the fields that are likely to be used for filtering. When you create a clustered table in BigQuery, the table data is automatically organized based on the contents of one or more of the columns in the table’s schema. The columns you specify are then used to colocate related data.
Clustering can improve the performance of certain query types — for example, queries that use filter clauses or that aggregate data. It makes a lot of sense to use them for large tables such as ACDOCA, the table for accounting documents in SAP S/4HANA. In this case, the timestamp could be used for partitioning, and common filtering fields such as the ledger, company code, and fiscal year could be used to define the clusters.
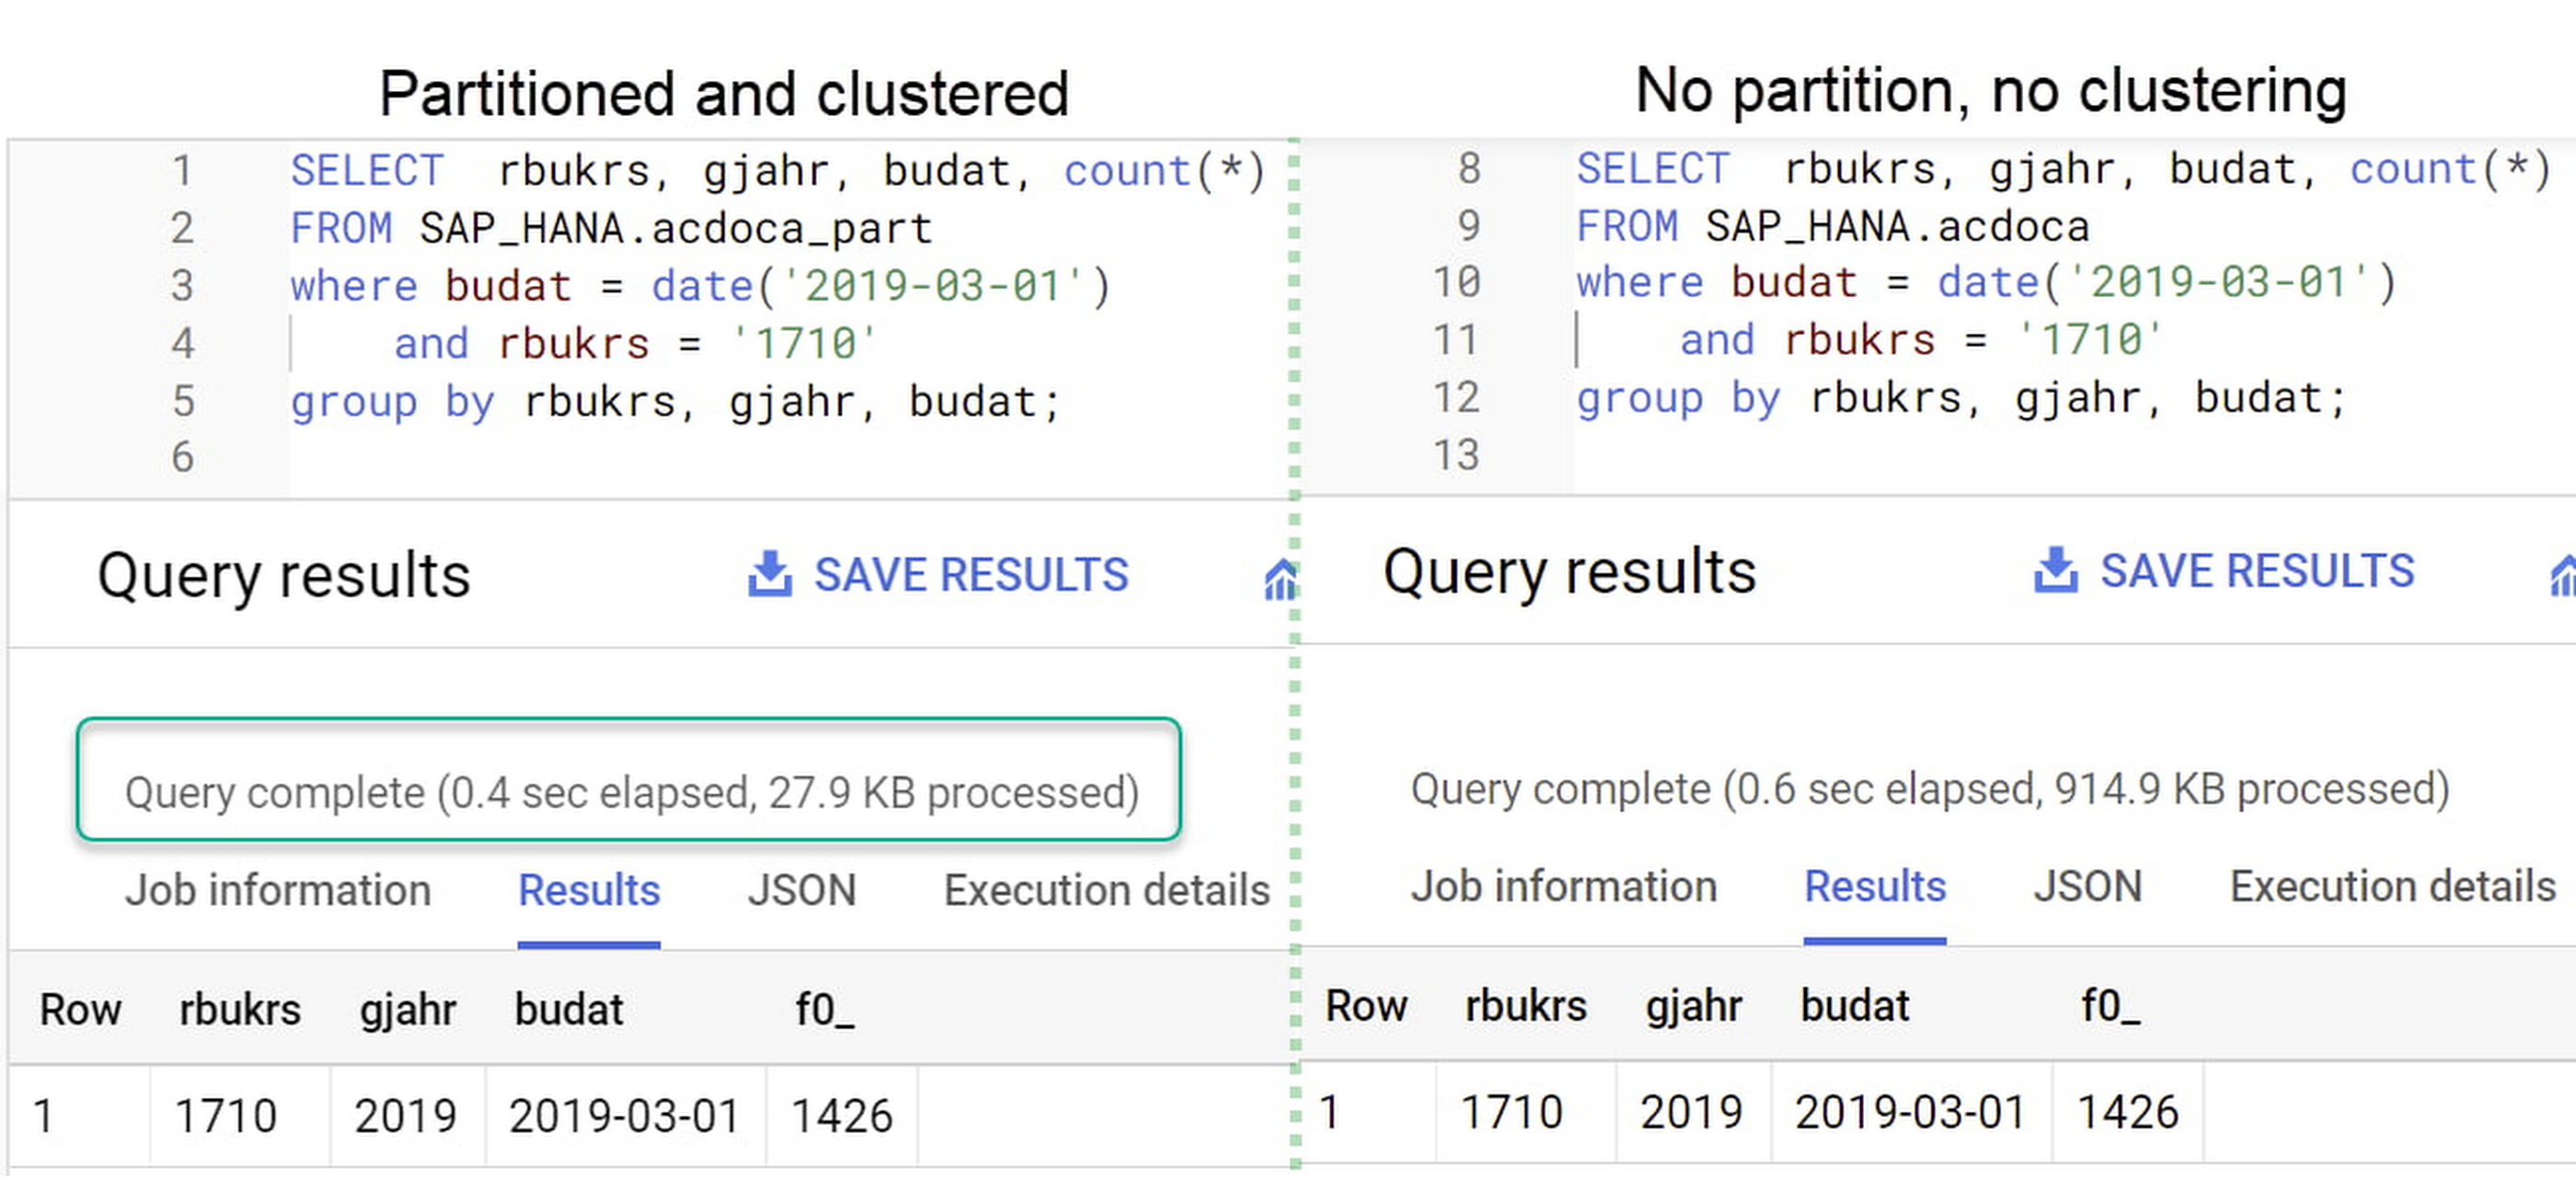
A great feature is that BigQuery will also periodically recluster the data automatically.
Materialized views
In BigQuery, materialized views are precomputed views that periodically cache the results of a query for better performance and efficiency. BigQuery uses precomputed results from materialized views and, whenever possible, reads only the delta changes from the base table to compute up-to-date results quickly. Materialized views can be queried directly or can be used by the BigQuery optimizer to process queries to the base table.
Queries that use materialized views are generally completed faster and consume fewer resources than queries that retrieve the same data only from the base table. If workload performance is an issue, materialized views can significantly improve the performance of workloads that have common and repeated queries. While materialized views currently only support single tables, they are very useful common and frequent aggregations like stock levels or order fulfillment.
Further tips on performance optimization while creating select statements can be found in the documentation for optimizing query computation.
Deployment pipeline and security
For most of the work you’ll do in BigQuery, you’ll normally have at least two delivery pipelines running — one for the actual objects in BigQuery and the other to keep the data staging, transforming, and updated as intended within the change-data-capture flows. Note that you can use most existing tools for your Continuous Integration / Continuous Deployment (CI/CD) pipeline — one of the benefits of using an open system like BigQuery. But, if your organization is new to CI/CD pipelines, this is a great opportunity to gradually gain experience. A good place to start is to read our guide for setting up a CI/CD pipeline for your data-processing workflow.
When it comes to access and security, most end-users will only have access to the final version of the BigQuery views. While row and column-level security can be applied, as in the SAP source system, separation of concerns can be taken to the next level by splitting your data across different Google Cloud projects and BigQuery datasets. While it’s easy to replicate data and structures across your datasets, it’s a good idea to define the requirements and naming conventions early in the design process so you set it up properly from the start.
Start driving faster and more insightful analytics
The best piece of advice we can give you is this: Try it yourself. Anyone with SQL knowledge can get started using the free BigQuery tier. New customers get $300 in free credits to spend on Google Cloud during the first 90 days. All customers get 10 GB storage and up to 1 TB queries/month, completely free of charge. In addition to discovering the massive processing capabilities, embedded machine learning, multiple integration tools, and cost benefits, you’ll soon discover how BigQuery can simplify your analytics tasks.
If you need additional assistance, our Google Cloud Professional Services Organization (PSO) and Customer Engineers will be happy to help show you the best path forward for your organization. For anything else, contact us at cloud.google.com/contact.
2837
Of your peers have already watched this video.
30:00 Minutes
The most insightful time you'll spend today!
How Major League Baseball Migrated from Teradata to BigQuery
Ever wondered how to jumpstart a migration from your legacy on-premises or cloud data warehouse to BigQuery?
In this video Robert Goretsky, VP, Data Engineering, Major League Baseball and Ryan McDowell, Cloud Data Engineer, Google Cloud show you how.
They offer a deep-dive into MLB’s Teradata to BigQuery migration journey. In the course of the session they share the lessons they learnt, and business insights that they achieved as a result of modernizing MLB’s analytics strategy.
Find out how to run a migration assessment, migrate a subset of the data and schema with BigQuery DTS, and transform the SQL queries from Teradata into BigQuery dialect with CompilerWorks. Watch this video to get a deep understanding of your enterprise data warehouse migration journey.
More Relevant Stories for Your Company

Updating Twitter’s Ad Engagement Analytics Platform for the Modern Age
As part of the daily business operations on its advertising platform, Twitter serves billions of ad engagement events, each of which potentially affects hundreds of downstream aggregate metrics. To enable its advertisers to measure user engagement and track ad campaign efficiency, Twitter offers a variety of analytics tools, APIs, and


How to Modernize Your Data infrastructure and Analytics: Case Study
Data modernization is key to digital transformation. Legacy systems are slow, expensive and cannot keep up with changing requirements. Data teams often spend more time on data pipelines than they do on data analysis or data science.in this video, Harish Ramachandraiah, Director Eng. & Analytics, Sunrun, speaks with Joel Mckelvey,

This Chart, from Home Depot, Dramatically Demonstrates the Power of a Cloud Data Warehouse
The Home Depot (THD) is the world’s largest home-improvement chain, growing to more than 2,200 stores and 700,000 products in four decades. Much of that success was driven through the analysis of data. This included developing sales forecasts, replenishing inventory through the supply chain network, and providing timely performance scorecards. However,

How Go-Jek, Indonesia’s First Billion-dollar Startup, Improved the Productivity of Data Scientists
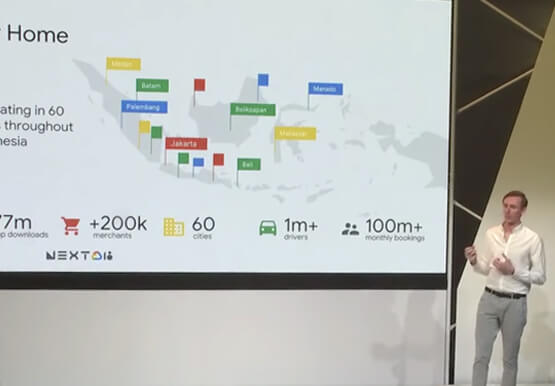
Go-Jek, Indonesia’s first billion-dollar startup, has seen an incredible amount of growth in both users and data over the past two years. Many of the ride-hailing company's services are backed by machine learning models hosted on Google Cloud Platform. Models range from driver allocation, to dynamic surge pricing, to food
