





7452
Of your peers have already watched this video.
1:15 Minutes
The most insightful time you'll spend today!
An Indian Example of How to Really Up Your Customer Experience Game and Increase Conversion Rates With AI
How about selfie analysis of users to recommend them the right lipstick color?
That’s just one of the many ideas folks at Purplle.com came up with to improve the buying experience of Indian consumers.
And without the power of Google Cloud, it would probably have remained just that…an idea.
But today, thanks to Google Cloud, “Nothing seems impossible,” says Suyash Katyayani, CTO, Purplle.
Purplle.com is an online e-commerce company in India and one of the pioneers in creating a digitally-native beauty brands in India.
“The beauty industry is so data intensive that we needed to have a strong data strategy and we were looking out for solutions which would enable us to have a strong data pipeline and a strong data warehousing solution,” says Katyayani.
That’s when it turned to Google Cloud.
Additionally, Purplle.com, says Katyayani, does not have to worry about at what scale the company operates at because they have access to state-of-the-art infrastructure from Google Cloud available to them so that their developers can run experiments.
“The biggest plus point for us has been the agility that Google Cloud has added,” says Katyayani.
This Chart, from Home Depot, Dramatically Demonstrates the Power of a Cloud Data Warehouse

7579
Of your peers have already read this article.
2:30 Minutes
The most insightful time you'll spend today!
The Home Depot (THD) is the world’s largest home-improvement chain, growing to more than 2,200 stores and 700,000 products in four decades. Much of that success was driven through the analysis of data. This included developing sales forecasts, replenishing inventory through the supply chain network, and providing timely performance scorecards.
However, to compete in today’s business world, THD has taken this data-driven approach to an entirely new level of success on Google Cloud, providing capabilities not practical on legacy technologies.
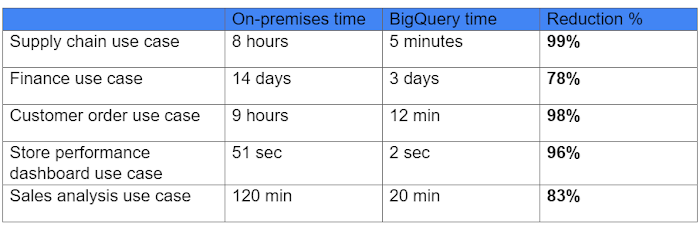
The pressures of contemporary growth that drove much of the work are familiar to many businesses. In addition to everything it was doing, THD needed to better integrate the complexities in its related businesses, like tool rental and home services. It needed to better empower teams, including a fast-growing data analysis staff and store associates with mobile computing devices. It wanted to better use online commerce and artificial intelligence to meet customer needs, while maintaining better security.
Even before addressing these new challenges, THD’s existing on-premises data warehouse was under stress as more data was required for analytics and data analysts were utilizing the data with increasingly complex use cases. This drove rapid growth of the data warehouse, but also created constant challenges for the team in managing priorities, performance, and cost.
In order to add capacity to the environment, it was a major planning, architecture, and testing effort. In one case, adding on-premises capacity took six months of planning and a three-day service outage. Within a year, capacity was again scarce, impacting performance and ability to execute all the reporting and analytics workloads required. The capacity refresh cycles were shrinking, and the expecations for data were growing. There had to be a better way.
Still, THD did not take its move to the cloud lightly. A large-scale enterprise data warehouse migration involves tremendous effort among people, process, and technology. After careful consideration, THD chose Google Cloud’s BigQuery for its cloud enterprise data warehouse.
BigQuery, a scalable serverless data warehouse, was better on cost, infrastructure agility, and analytics capability, driving better insights with improved performance. There are no service interruptions when capacity is added, and that capacity can be added within a week (and soon same day). It doesn’t require complex system administration, and its standard SQL support means people can easily ramp up quickly. Valuable BigQuery products like Identity and Access Management meant THD could create many separate Google Cloud projects, while ensuring that different teams weren’t interfering with each other or accessing protected data.
THD also utilizes BigQuery’s flat-rate monthly pricing model that allows teams to budget their capacity based on need and provides billing predictability. The capacity not being used by a given project is available for enterprise use. This ensures no surprises when the monthly bill arrives and provides all analytical users access to significant computing power.
While THD’s legacy data warehouse contained 450 terabytes of data, the BigQuery enterprise data warehouse has over 15 petabytes. That means better decision-making by utilizing new datasets like website clickstream data and by analyzing additional years of data.
As for performance, look at this chart:
With the cloud EDW migration complete, and the legacy on-premises data warehouse retired, analysts now execute more complex and demanding workloads that they would not have been able to complete before, such as utilizing Datalab for orchestrating analytics through Python Notebooks, utilizing BigQuery ML for machine learning directly against the BigQuery data (no movement of large datasets), and AutoML to help determine the best model for predictions.
Additionally, engineers at THD have adapted BigQuery to monitor, analyze, and act on application performance data across all its stores and warehouses in real time, something that was not practical in the on-premises system.
With over 600 projects that THD now has on Google Cloud, the BigQuery story is just one of the many ways that Google Cloud is working with THD to deliver meaningful business results, every day.
Looking for a Cloud Data Warehouse? Find out Why Forrester Thinks Google BigQuery is a Leader

4477
Of your peers have already read this article.
4:30 Minutes
The most insightful time you'll spend today!
We are thrilled to announce that Google has been named a Leader in The Forrester Wave™: Cloud Data Warehouse, Q1 2021 report. For more than a decade, BigQuery, our petabyte-scale cloud data warehouse, has been in a class of its own. We’re excited to share this recognition and we want to thank our strong community of customers and partners for voicing their opinion. We believe this report validates the alignment of our strategy with our customers’ analytics needs.
“Customers like Google’s frequency of data warehouse releases, business value, future proof architecture, high-end scale, geospatial capabilities, strong AI/ML capabilities, good security capabilities, and broad analytical use cases,” according to the Forrester report. Today’s data leaders require a data warehousing platform that provides both depth and breadth and with BigQuery, organizations are able to unlock deeper data science and machine learning capabilities while promoting data democratization and providing the highest levels of availability.
Google BigQuery: 5 out of 5!
Forrester gave Google BigQuery a score of 5 out of 5 across 19 different criteria, including:
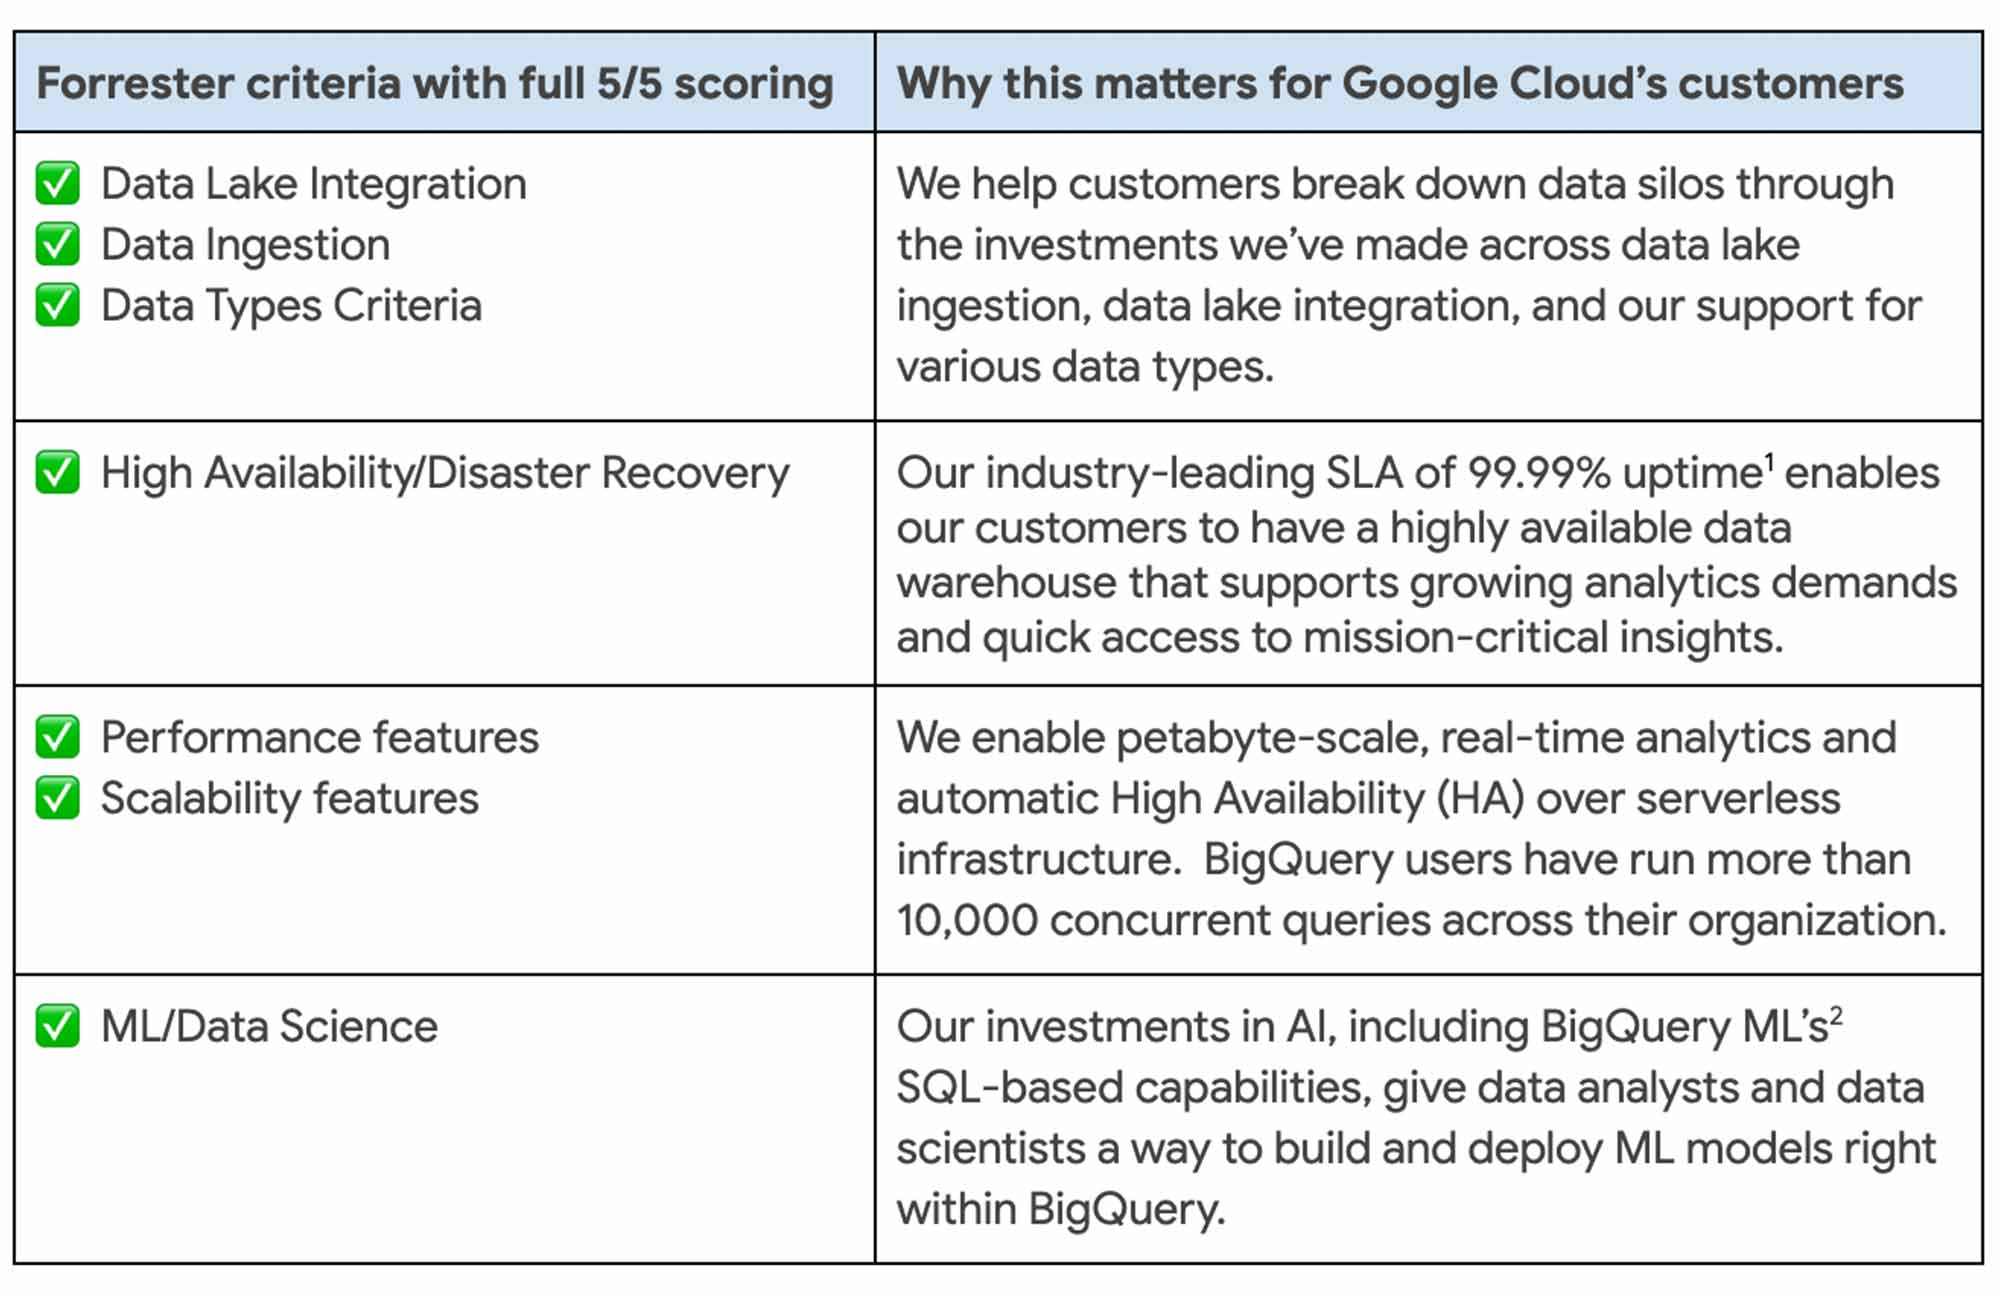
Today, customers across the globe use BigQuery to run business critical analytics workloads to enable BI acceleration, IoT analytics, customer intelligence, AI/ML-based analytics, data science, data collaboration, and data services. Customers such as Verizon, Wayfair, HSBC, Twitter, AirAsia, KeyBank, The Home Depot, and Vodafone have anchored their digital transformation efforts on BigQuery—unlocking deeper insights for their people.
Customers use BigQuery across all industries, to solve issues like credit card fraud detection, predictive forecasting, anomaly detection, log analytics and many more. Forrester recognized this work and gave BigQuery a 5/5 score for supporting vertical and horizontal use cases.
More BigQuery advantages
Google is the first hyperscale provider to offer a multi cloud data analytics solution. With BigQuery Omni, customers can perform cross-cloud analytics with ease, and drive business outcomes they couldn’t achieve with the siloed approach offered by other vendors.
We designed BigQuery to be highly scalable and more open and interoperable so that customers can join data across SQL databases, traditional unstructured data lakes in object storage, and even spreadsheets using any analysis tool.
Recent innovations like BigQuery BI Engine lets us provide the best analytics experience by delivering sub-second query response times from any business intelligence tool, from Google’s Looker and Connected Sheets to Tableau, Microsoft Power BI, ThoughtSpot, and others. Our goal is to meet customers where they are rather than force them into a one-size-fits-all approach to data analysis.
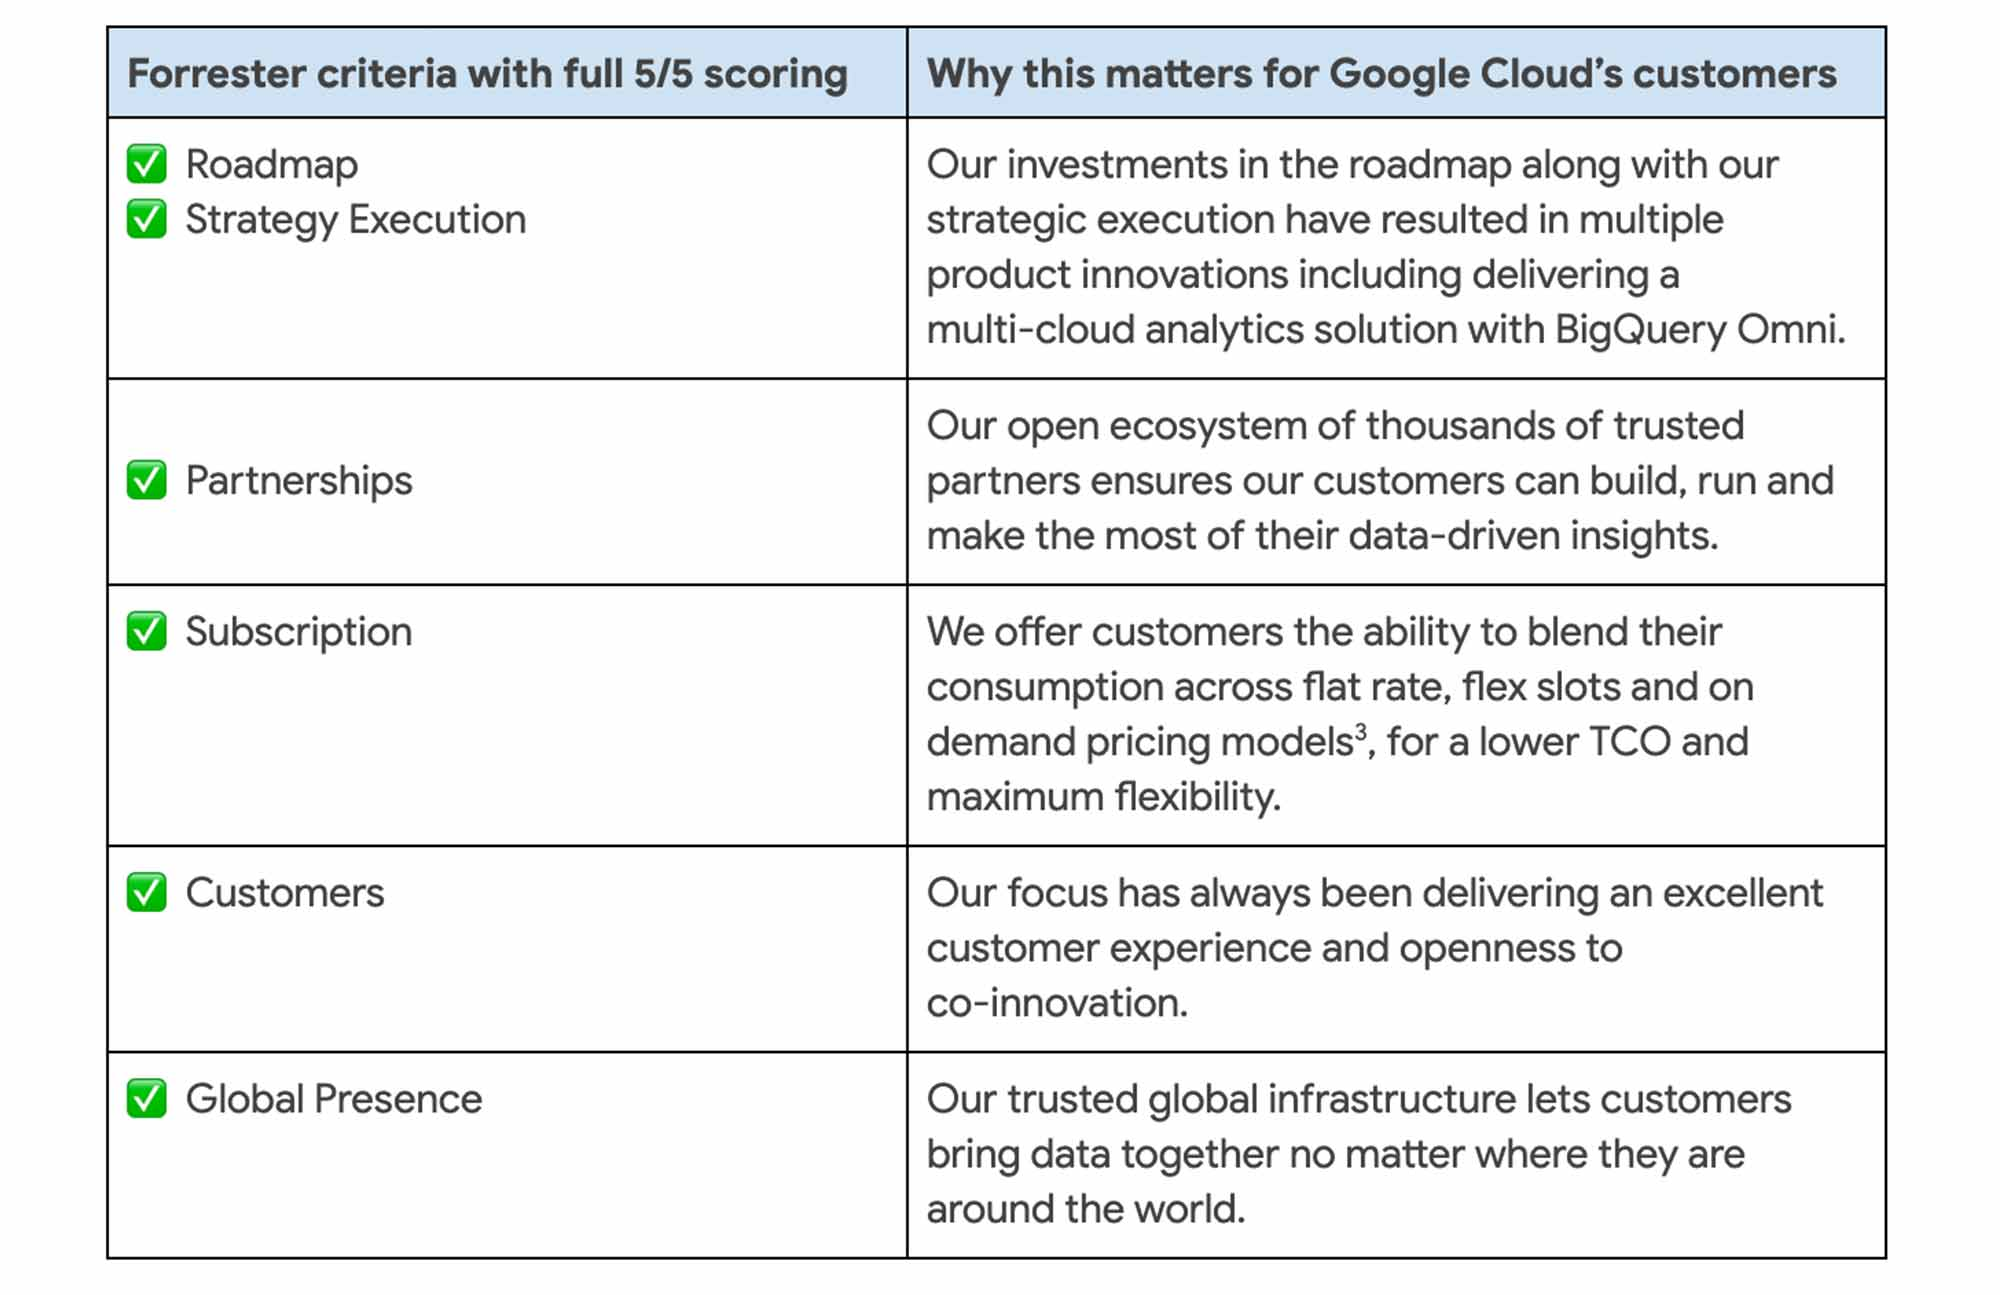
With BigQuery, organizations gain both breadth and depth of capabilities to transform their analytics strategy. Forrester also gave BigQuery 5 out of 5 in:
Data-powered innovation
These advantages enable our customers to accelerate their digital transformation and reimagine their business through data-powered innovation. Google’s leadership across AI, analytics, and databases comes together in a single data cloud platform that provides everyone with the ability to get value out of their data faster.
We bring decades of research and innovation in AI to our customers through industry-leading AI solutions, that in turn helps our customers solve their biggest problems. Our support of open standards and APIs enables interoperability between a variety of services for ingestion, storage, processing and analytics across the data cloud platform. And finally, we believe our multi-layered security approach throughout the data stack ensures redundancy and reliability so that customers can have the peace of mind that their data is always protected.
We are honored to be a leader in this Forrester Wave™ and look forward to continuing to innovate and partner with you on your digital transformation journey.
Download the full Forrester Wave™ :Cloud Data Warehouse, Q1 2021 report. And check out these smart analytics reference patterns. To learn more about BigQuery, visit our website, and get started immediately with the free BigQuery Sandbox.
BigQuery Helps Insurance Firms Leverage Previous Storm Data for Better Pricing Insights

8543
Of your peers have already read this article.
2:00 Minutes
The most insightful time you'll spend today!
It may be surprising to know that U.S. natural catastrophe economic losses totaled $119 billion in 2020, and 75% (or $89.4B) of those economic losses were caused by severe storms and cyclones. In the insurance industry, data is everything. Insurers use data to influence underwriting, rating, pricing, forms, marketing, and even claims handling. When fueled by good data, risk assessments become more accurate and produce better business results. To make this possible, the industry is increasingly turning to predictive analytics, which uses data, statistical algorithms, and machine learning (ML) techniques to predict future outcomes based on historical data. Insurance firms also integrate external data sources with their own existing data to generate more insight into claimants and damages. Google Cloud Public Datasets offers more than 100 high-demand public datasets through BigQuery that helps insurers in these sorts of data “mashups.”
One particular dataset that insurers find very useful is Severe Storm Event Details from the U.S. National Oceanic and Atmospheric Administration (NOAA). As part of the Google Cloud Public Datasets program and NOAA’s Public Data Program, this severe storm data contains various types of storm reports by state, county, and event type—from 1950 to the present—with regular updates. Similar NOAA datasets within the Google Cloud Public Datasets program include the Significant Earthquake Database, Global Hurricane Tracks, and the Global Historical Tsunami Database.
In this post, we’ll explore how to apply storm event data for insurance pricing purposes using a few common data science tools—Python Notebook and BigQuery—to drive better insights for insurers.
Predicting outcomes with severe storm datasets
For property insurers, common determinants of insurance pricing include home condition, assessor and neighborhood data, and cost-to-replace. But macro forces such as natural disasters—like regional hurricanes, flash floods, and thunderstorms—can also significantly contribute to the risk profile of the insured. Insurance companies can leverage severe weather data for dynamic pricing of premiums by analyzing the severity of those events in terms of past damage done to property and crops, for example.
It’s important to set the premium correctly, however, considering the risks involved. Insurance companies now run sophisticated statistical models, taking into account various factors—many of which can change over time. After all, without accurate data, poor predictions can lead to business losses, particularly at scale.
The Severe Storm Event Details database includes information about a storm event’s location, azimuth (an angle measurement used in celestial coordination), distance, impact, and severity, including the cost of damages to property and crops. It documents:
- The occurrence of storms and other significant weather events of sufficient intensity to cause loss of life, injuries, significant property damage, and/or disruption to commerce.
- Rare, unusual weather events that generate media attention, such as snow flurries in South Florida or the San Diego coastal area.
- Other significant weather events, such as record maximum or minimum temperatures or precipitation that occur in connection with another event.
Data about a specific event is added to the dataset within 120 days to allow time for damage assessments and other analysis.
Driving business insights with BigQuery and notebooks
Google Cloud’s BigQuery provides easy access to this data in multiple ways. For example, you can query directly within BigQuery and perform analysis using SQL.
Another popular option in the data science and analyst community is to access BigQuery from within the Notebook environment to intersperse Python code and SQL text, and then perform ad hoc experimentation. This uses the powerful BigQuery compute to query and process huge amounts of data without having to perform the complex transformations within the memory in Pandas, for example.
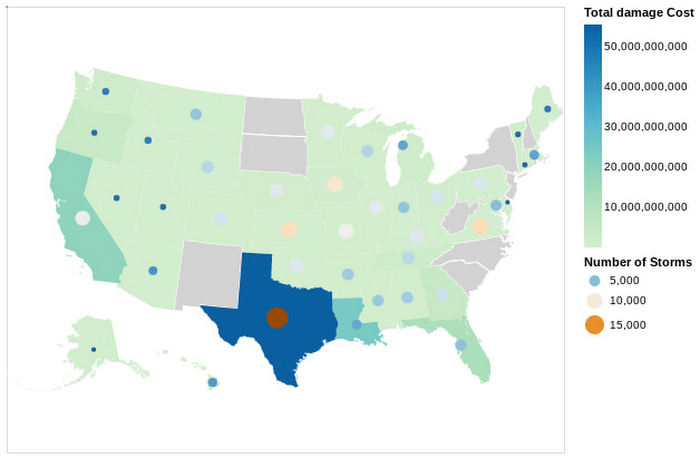
In this Python notebook, we have shown how the severe storm data can be used to generate risk profiles of various zip codes based on the severity of those events as measured by the damage incurred. The severe storm dataset is queried to retrieve a smaller dataset into the notebook, which is then explored and visualized using Python. Here’s a look at the risk profiles of the zip codes:
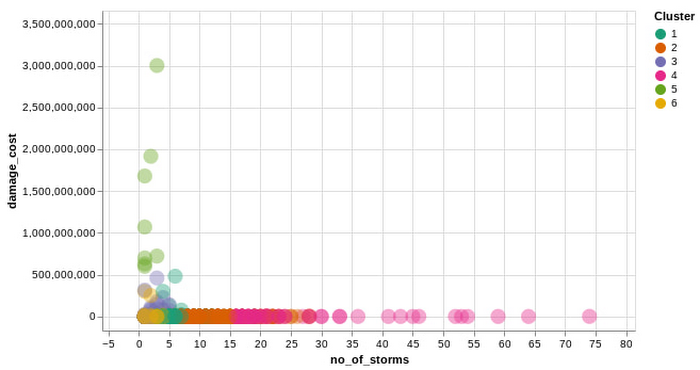
Another Google Cloud resource for insurers is BigQuery ML, which allows them to create and execute machine learning models on their data using standard SQL queries. In this notebook, with a K-Means Clustering algorithm, we have used BigQuery ML to generate different clusters of zip codes in the top five states impacted by severe storms. These clusters show different levels of impact by the storms, indicating different risk groups.
The example notebook is a reference guide to enable analysts to easily incorporate and leverage public datasets to augment their analysis and streamline the journey to business insights. Instead of having to figure out how to access and use this data yourself, the public datasets, coupled with BigQuery and other solutions, provide a well-lit path to insights, leaving you more time to focus on your own business solutions.
Making an impact with big data
Google Cloud’s Public Datasets is just one resource within the broader Google Cloud ecosystem that provides data science teams within the financial services with flexible tools to gather deeper insights for growth. The severe storm dataset is a part of our environmental, social, and governance (ESG) efforts to organize information about our planet and make it actionable through technology, helping people make a positive impact together.
To learn more about this public dataset collaboration between Google Cloud and NOAA, attend the Dynamic Pricing in Insurance: Leveraging Datasets To Predict Risk and Price session at the Google Cloud Financial Services Summit on May 27. You can also check out our recent blog and explore more about BigQuery and BigQuery ML.
Google Cloud’s Data Analytics May Recap

6892
Of your peers have already read this article.
5:00 Minutes
The most insightful time you'll spend today!
May was a very busy month for data analytics product innovation. If you didn’t have the chance to attend our inaugural Data Cloud Summit, video replays of all our sessions are now available so feel free to watch them at your own pace.
In this blog, I’d like to share some background behind the innovations we released in May, why we built them the way we did, and the type of value they can bring your company and your team.
But first, a huge thank you!
This week, we had the honor to announce that Google has been named a Leader in The Forrester Wave™: Streaming Analytics, Q2 2021 report. Forrester gave Dataflow a score of 5 out of 5 across 12 different criteria, stating: “Google Cloud Dataflow has strengths in data sequencing, advanced analytics, performance, and high-availability”.
Google has more than a decade of experience in building real-time and internet-scale systems for its own needs, and we are excited to see that our ability to provide customers with a reliable, scalable, and performant platform is bearing fruit.
This announcement comes on the back of the release of The Forrester Wave™: Cloud Data Warehouse, Q1 2021 report, which also named Google Cloud as a Leader.
We couldn’t be more excited about the recognition and appreciate all your feedback and trust in the work that we do to support your goal in accelerating data-powered innovation.
Innovation galore
Your feedback and your passion is the fuel that drives our ambition to deliver more and better services to you. That’s why, this year, we didn’t want to wait until Google Cloud Next to share some great products we have been working on. On May 26, our team announced a slew of new products, services and programs. Watch a quick summary below:
https://youtube.com/watch?v=DG1mOPMXJvw%3Fenablejsapi%3D1%26
Meeting you where you are
An important design principle behind all of our services is “meeting you where you are”. This means we aim to provide you with the tools and software you need to innovate on your own terms. Here are three new services that will help you do just that:
Datastream
Datastream, our new serverless change data capture (CDC) and replication service, allows your company to synchronize data across heterogeneous databases, storage systems, and applications reliably and with minimal latency to support real-time analytics, database replication, and event-driven architectures. Datastream delivers change streams from Oracle and MySQL databases into Google Cloud services such as BigQuery, Cloud SQL, Cloud Storage, and Cloud Spanner, saving time and resources while ensuring your data is accurate and up-to-date.
- Under the hood, Datastream reads CDC events (inserts, updates, and deletes) from source databases, and writes those events with minimal latency to a data destination. It leverages the fact that each database source has its own CDC log—binlog for MySQL and LogMiner for Oracle—which it uses for its own internal replication and consistency purposes.
- Datastream integrates with purpose-built and extensible Dataflow templates to pull the change streams written to Cloud Storage, and create up-to-date replicated tables in BigQuery for analytics. It also leverages Dataflow templates to replicate and synchronize databases into Cloud SQL or Cloud Spanner for database migrations and hybrid cloud configurations.
- Datastream also powers a Google-native Oracle connector in Cloud Data Fusion’s new replication feature for easy ETL/ELT pipelining. By delivering change streams directly into Cloud Storage, customers can leverage Datastream to implement modern, event-driven architectures.
Looker and BigQuery Omni on Microsoft Azure
Research on multi cloud adoption is unequivocal — 92% of businesses in 2021 report having a multi cloud strategy. We want to continue supporting your choice by providing the flexibility you need to see your strategy through.
- This past month, we introduced Looker, hosted on Microsoft Azure. For the first time, you can now choose Azure, Google Cloud, or AWS for your Looker instance. You can also self-host your Looker instance on-premises.
- We also introduced BigQuery Omni for Azure, which along with last year’s introduction of BigQuery Omni for AWS, will help you access and securely analyze data across Google Cloud, AWS, and Azure.
The cost of moving data between cloud providers isn’t sustainable for many, and it’s still difficult to seamlessly work across clouds. BigQuery Omni represents a new way of analyzing data stored in multiple public clouds, which is made possible by BigQuery’s separation of compute and storage. By decoupling these two, BigQuery provides scalable storage that can reside in Google Cloud or other public clouds, and stateless resilient compute that executes standard SQL queries.
- Unlike competitors, BigQuery Omni doesn’t require you to move or copy your data from one public cloud to another, where you might incur egress costs. You also benefit from the same BigQuery interface on Google Cloud, enabling you to query data stored in Google Cloud, AWS, and Azure without any cross-cloud movement or copies of data.
- BigQuery Omni’s query engine runs the necessary compute on clusters in the same region where your data resides. For example, you can query Google Analytics 360 Ads data stored in Google Cloud and query logs data from your ecommerce platform and applications that are stored in AWS S3 and/or Microsoft Azure.
Then, using Looker, you can build a dashboard that allows you to visualize your audience behavior and purchases alongside your advertising spend.
Dataplex
We understand that most organizations still struggle to make high-quality data easily discoverable and accessible for analytics, across multiple silos, to a growing number of people and tools within their organization.
They are often forced to make tradeoffs. For instance, moving and duplicating data across silos to enable diverse analytics use cases or leaving their data distributed but limiting the agility of decisions.
- Dataplex provides an intelligent data fabric that enables you to centrally manage, monitor, and govern your data across data lakes, data warehouses, and data marts, while also ensuring data is securely accessible to a variety of analytics and data science tools.
- One of the core tenets of Dataplex is letting you organize and manage your data in a way that makes sense for your business, without data movement or duplication. For that, we provide logical constructs like lakes, data zones, and assets. These constructs enable you to abstract away the underlying storage systems and become the foundation for setting policies around data access, security, lifecycle management, and so on.
- For example, you can create a lake per department within your organization (e.g. Retail, Sales, Finance, etc.) and create data zones that map to data readiness and usage (e.g. landing, raw, curated_data_analytics, curated_data_science, etc.).
Once you have your lakes and zones setup, you can attach data to these zones as assets. You can add data from different types of storage (e.g. GCS Bucket and BigQuery dataset) under the same zone. You can also attach data across multiple projects under the same zone. You can ingest data into your lakes and zones using the tools of your choice, including services such as Dataflow, Data Fusion, Dataproc, Pub/Sub, or choose from one of our partner products. Dataplex comes with built-in 1-click templates for common data management tasks.
To find out more about Dataplex, head to cloud.google.com/dataplex or watch the video below:
https://youtube.com/watch?v=bbFeAt7cw1g%3Fenablejsapi%3D1%26
Helping you innovate everyday
Sharing data is hard. Traditional data sharing techniques use batch data pipelines that are expensive to run, create late arriving data, and can break with any changes to the source data. These techniques also create multiple copies of data, which brings unnecessary costs and can bypass data governance processes. They also fail to offer features for data monetization, such as managing subscriptions and entitlements. Altogether, these challenges mean that organizations are unable to realize the full potential of transforming their business with shared data.
Analytics Hub
To address these limitations, we are introducing Analytics Hub, a new fully managed service that helps organizations unlock the value of data sharing, leading to new insights and increased business value.
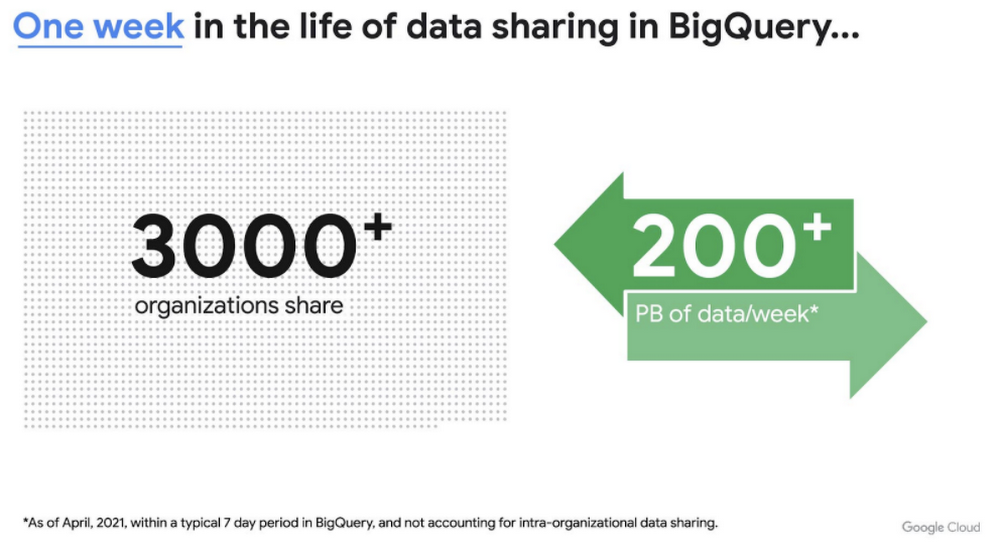
This new service is built on the tremendous experience and feedback we have received over the years. For example, BigQuery has had cross-organizational, in-place data sharing capabilities since its inception in 2010—and the functionality is very popular. Over a 7-day period in April, we had over 3,000 different organizations sharing over 200 petabytes of data. These numbers don’t include data sharing between departments within the same organization.
Analytics Hub takes sharing to the next level, making it easy for you to publish, discover, and subscribe to valuable datasets that you can combine with your own data to derive unique insights.
This includes:
- Shared datasets: As a data publisher, you create shared datasets that contain the views of data that you want to deliver to your subscribers. Data subscribers can search through the datasets that are available across all exchanges for which they have access and subscribe to relevant datasets. In addition, the publisher can track subscribers, disable subscriptions, and see aggregated usage information for the shared data.
- Curated, self-service data exchanges: Exchanges are collections used to organize and secure shared datasets. By default, exchanges are completely private, but granular roles and permissions make it easy to deliver data to the right audience—whether internal or public.
This is just the beginning for Analytics Hub. Please sign up for the preview, which is scheduled to be available in the third quarter of 2021.
Dataflow Prime
At Google Cloud, we have the great privilege of working with some of the most innovative organizations in the world. And this work provides us with a unique perspective into the future of big data processing. Dataflow Prime is a new platform based on a serverless, no-ops, and auto-tuning architecture that brings unparalleled resource utilization and radical operational simplicity to big data processing. This new service introduces a large number of exciting capabilities but I’d like to highlight three key aspects of the product:
- Vertical Autoscaling: Dataflow Prime dynamically adjusts the compute capacity allocated to each worker based on utilization, detecting when jobs are limited by worker resources and automatically adding more resources. Vertical Autoscaling works hand in hand with Horizontal Autoscaling to seamlessly scale workers to best fit the needs of the pipeline. As a result, it no longer takes hours or days to determine the perfect worker configuration to maximize utilization.
- Right Fitting: Each stage of a pipeline typically has a different resource requirement than the others. Until now, either all workers in the pipeline would have had the higher memory and GPU, or none of them would. Pipelines either had to waste resources or suffer slower workloads. Right Fitting solves this problem by creating stage-specific pools of resources, optimized for each stage.
- Smart Recommendations: Smart Recommendations automatically detects problems in your pipeline and shows potential fixes. For example, if your pipeline is running into permissions issues, a Smart Recommendation will detect which IAM permissions you need to enable to unblock your job. If you are using an inefficient coder in your job, Smart Recommendations will surface more performant coder implementations that can help you save on costs.
What’s next
We’re excited to hear your thoughts and feedback about all these exciting new services. I would also highly recommend that you connect with members of the community to learn more about their story and journey. A good example to start with is the Data To Value customer panel we produced at our inaugural Data Cloud Summit with the Chief Data Officers of Keybank and Rackspace. You can watch it for free below:
https://youtube.com/watch?v=ITI2Q3MkxuA%3Fenablejsapi%3D1%26

5305
Of your peers have already downloaded this article
7:30 Minutes
The most insightful time you'll spend today!
Sure, machine learning is becoming a business imperative, but how does it work in practice—and what are the benefits for IT managers?
That’s the subject of a new step-by-step guide to solving business and IT problems with artificial intelligence and ML, based on insights gathered by IDG Research Services.
Its publication comes at a time when technology departments face growing pressure to embrace these emerging technologies, yet many have questions about how to get started.
It has real-life examples such as the health services company that used ML to reduce support ticket-resolution time from 48 minutes to six.
In another section, a financial services VP explains that cloud-based ML services enable his company to avoid spending money on computing resources that sit idle.
The guide also includes concrete tips for new ML adopters. For example, a real-estate CIO recommends the use of third-party tools that rely on AI and ML technologies, while a financial services VP highlights the challenge and potential of incorporating unstructured data into ML initiatives.
Download the guide now!
More Relevant Stories for Your Company

How to Enhance Incremental Pipeline Performance while Ingesting Data into BigQuery
When you build a data warehouse, the important question is how to ingest data from the source system to the data warehouse. If the table is small you can fully reload a table on a regular basis, however, if the table is large a common technique is to perform incremental

Delivering analysis-ready financial data at scale
Refinitiv, is a leading provider of financial market data. It serves over 40,000 institutions and operates in 190 countries. “We're constantly looking at solving some of the most difficult problems our users face when accessing new data sets as well as onboarding new sources that will be relevant for workflows

How AI and Analytics in EdTech are Living Upto the Hype
Over the last year, COVID-19 presented unforeseen challenges for practically every type of business and organization—including schools, colleges, and universities. For educational institutions, the pandemic was an unapologetic agent of acceleration, shifting one billion learners from in-person to online learning within two months. The rapid transition to online learning exposed

How Major League Baseball Migrated from Teradata to BigQuery
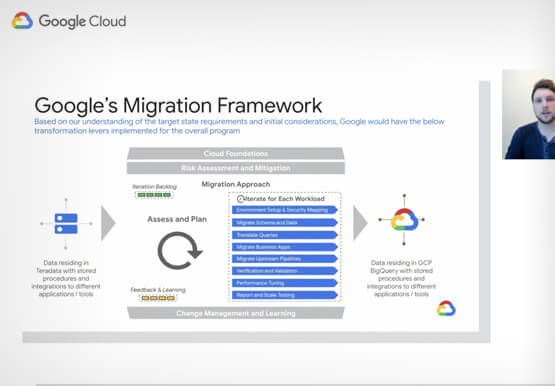
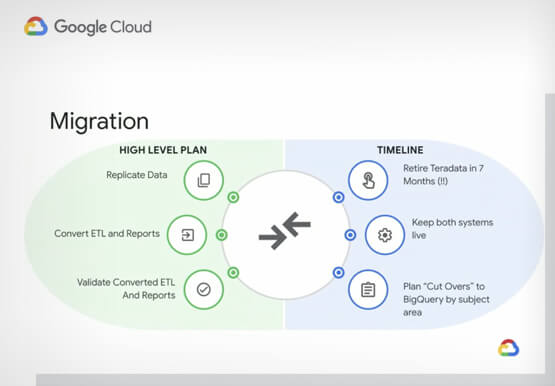
Ever wondered how to jumpstart a migration from your legacy on-premises or cloud data warehouse to BigQuery? In this video Robert Goretsky, VP, Data Engineering, Major League Baseball and Ryan McDowell, Cloud Data Engineer, Google Cloud show you how. They offer a deep-dive into MLB’s Teradata to BigQuery migration journey.
