





2854
Of your peers have already watched this video.
16:00 Minutes
The most insightful time you'll spend today!
Conversational AI in Search, Maps and Online Shopping!
Did you know about 77 percent of customers are likely to make a purchase from a brand they can message with? Direct interaction with the brand to gather product information shortens buyers’ journey and personalizes it with appropriate messages. To helps businesses add speed, simplicity and convenience in brand-customers interaction, Google’s Business Messages helps add chat feature in Search, Maps or other mediums.
Watch the video to learn to integrate conversational AI based on Google’s superior AI and ML features and build interactive and connected chat automation using Google Cloud’s suite of tools and products!
Time-series Model on Google Cloud Allows Better Transparency on Fishing and Marine Activities

4392
Of your peers have already read this article.
3:30 Minutes
The most insightful time you'll spend today!
Who would have known that today technology would enable us with the ability to use machine learning to track vessel activity, and make pattern inferences to help address IUU (illegal, unreported, and unregulated) fishing activities. What’s even more noteworthy is that we now have the computing power to share this information publicly in order to enable fair and sustainable use of our ocean.
An amazing group of humans at the nonprofit Global Fishing Watch took on this massive big data challenge and succeeded. You can immediately access their dynamic map on their website globalfishingwatch.org/map that is bringing greater transparency to fishing activity and supporting the creation and management of marine protected areas throughout the world.
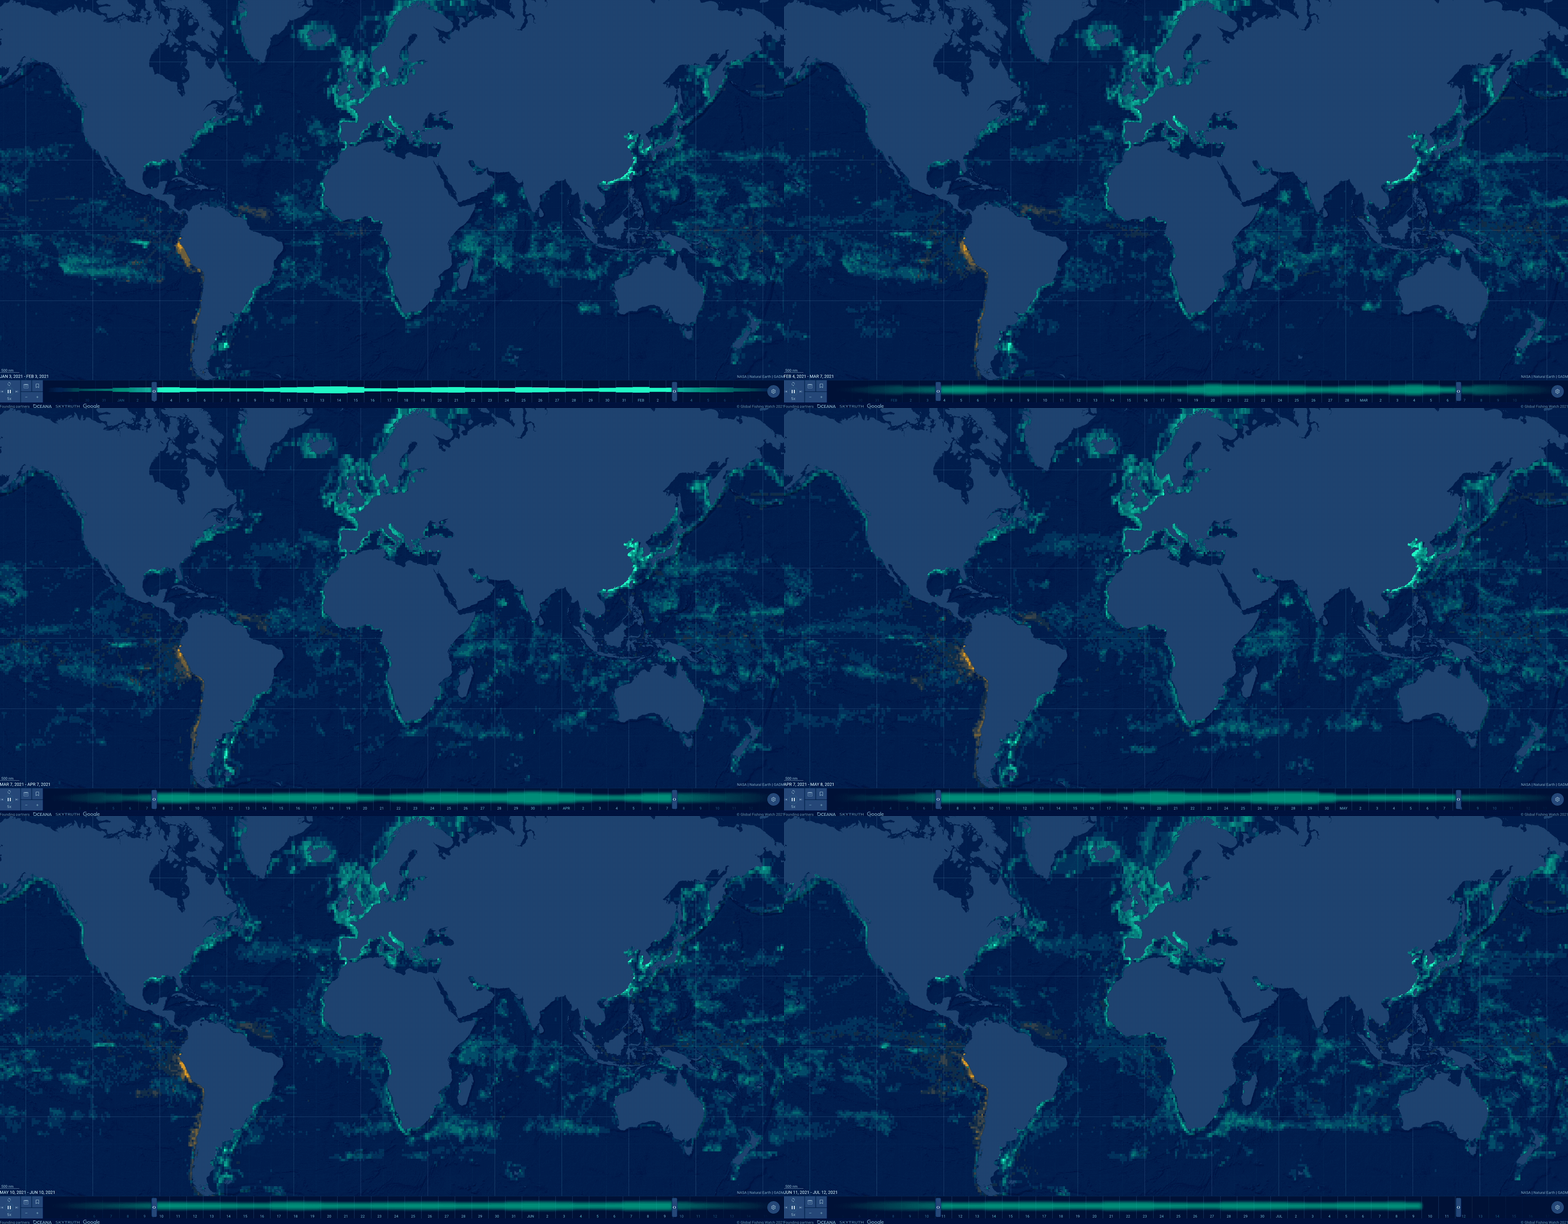
In our second episode of our People and Planet AI series we were inspired by their ML solution to this challenge, and we built a short video and sample with all the relevant code you need to get started with building a basic time-series classification model in Google Cloud, and visualize it in an interactive map.
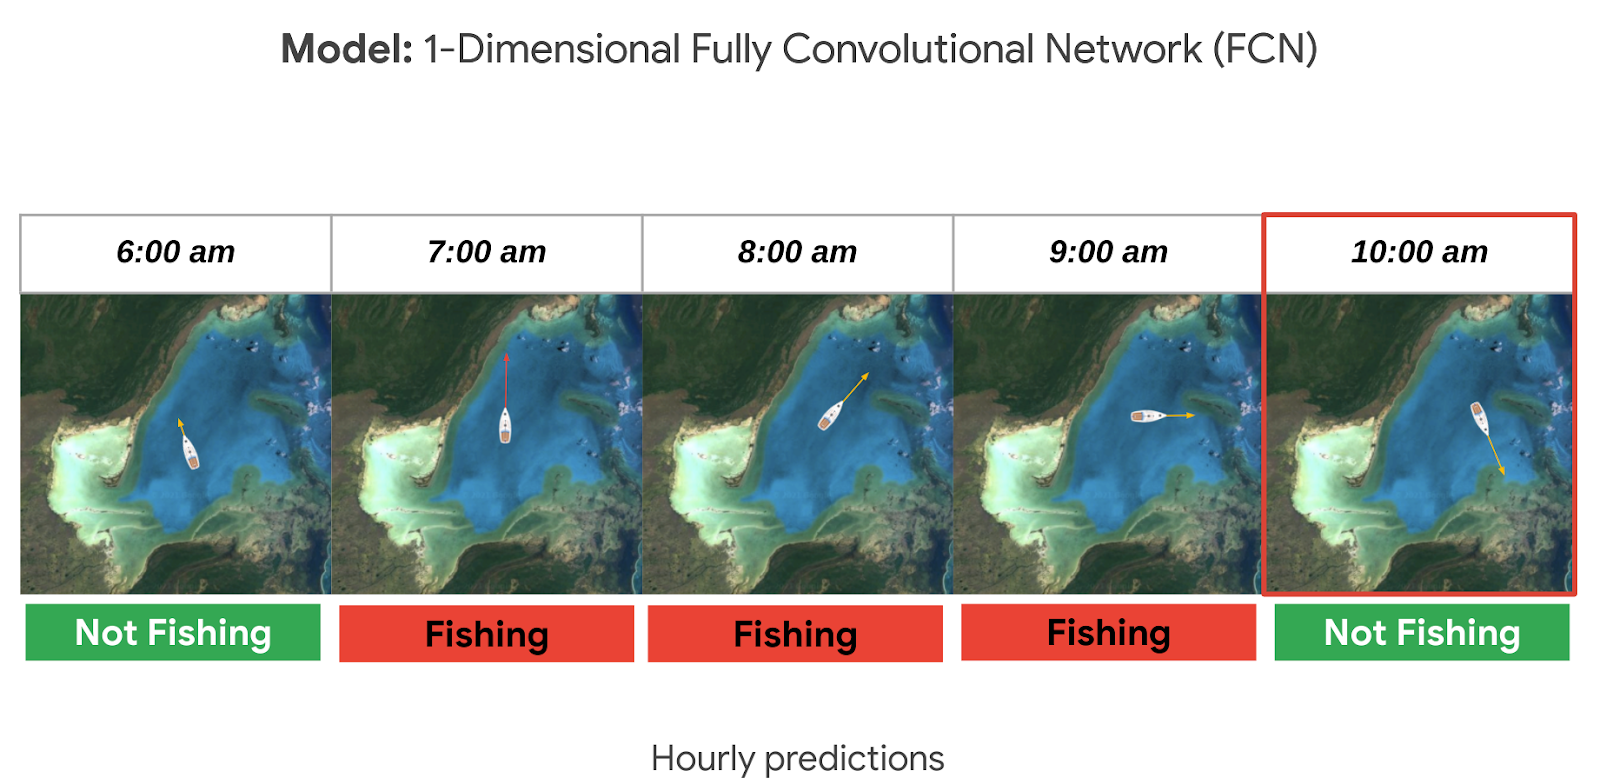
Architecture
These are the components used to build a model for this sample:
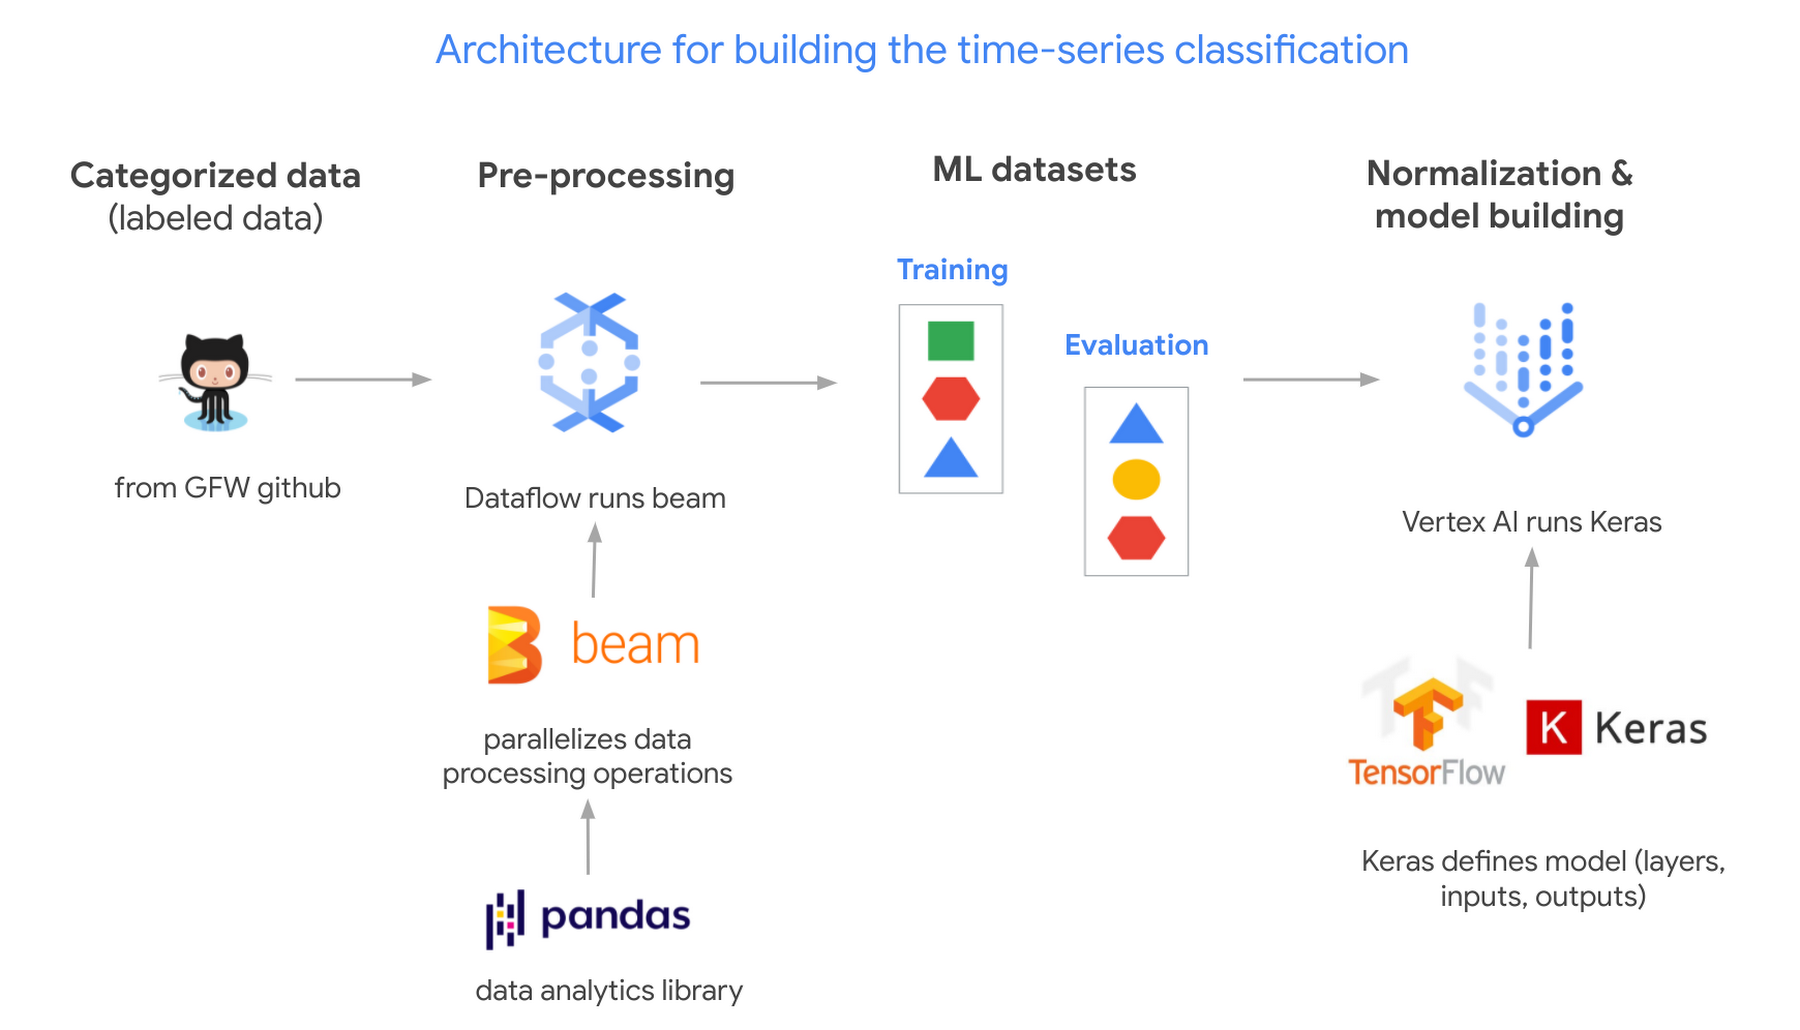
- Global Fishing Watch GitHub: where we got the data
- Apache Beam: (open source library) runs on Dataflow.
- Dataflow: (Google’s data processing service) creates 2 datasets; 1 for training a model and the other to evaluate its results.
- TensorflowKeras: (high level API library) used to define a machine learning model, which we then train in Vertex AI.
- Vertex AI: (a platform to build, deploy, and scale ML models) we train and output the model.
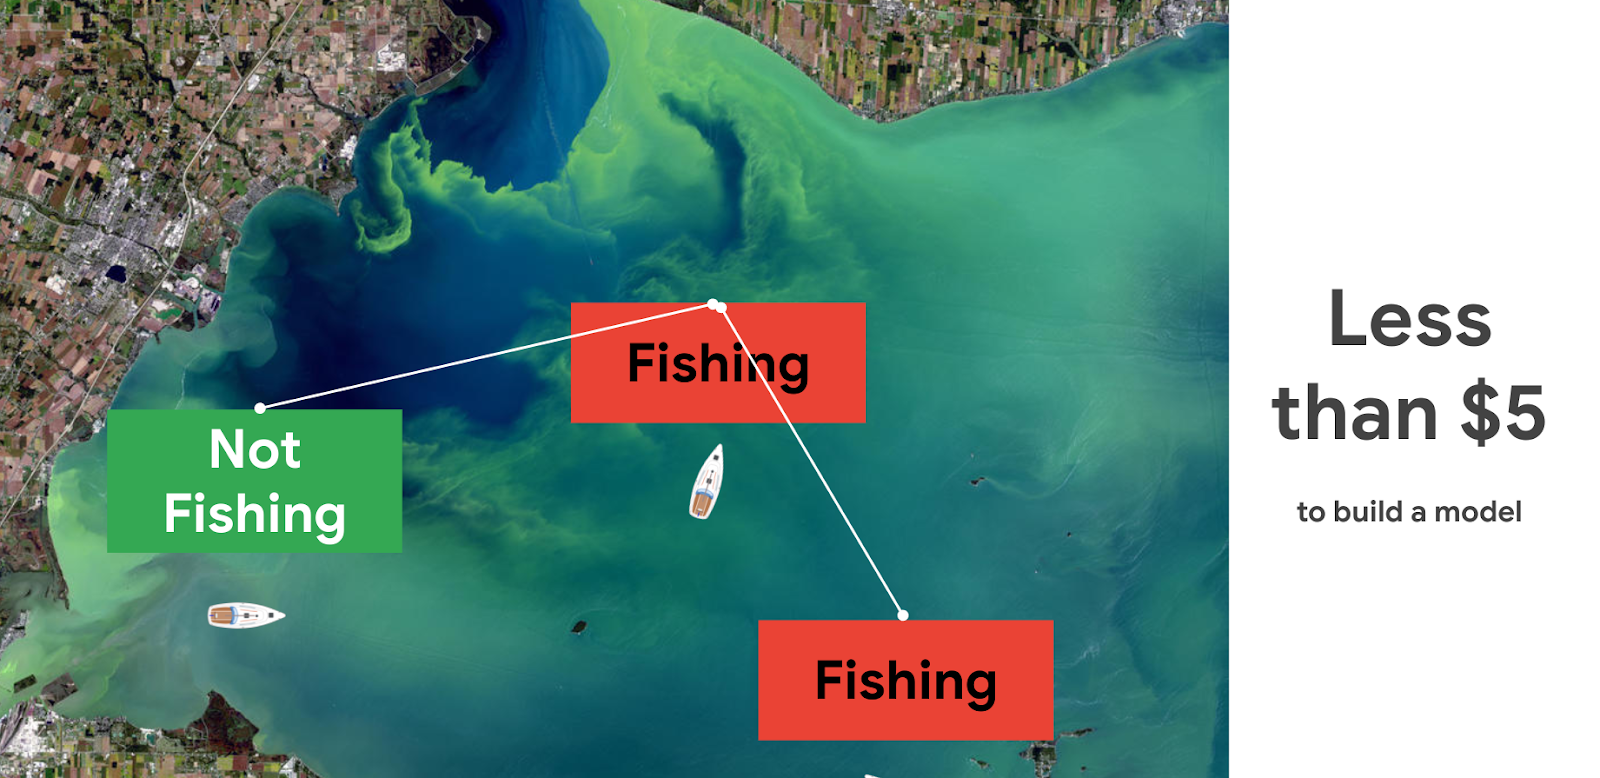
Pricing and steps
The total cost to run this solution was less than $5.
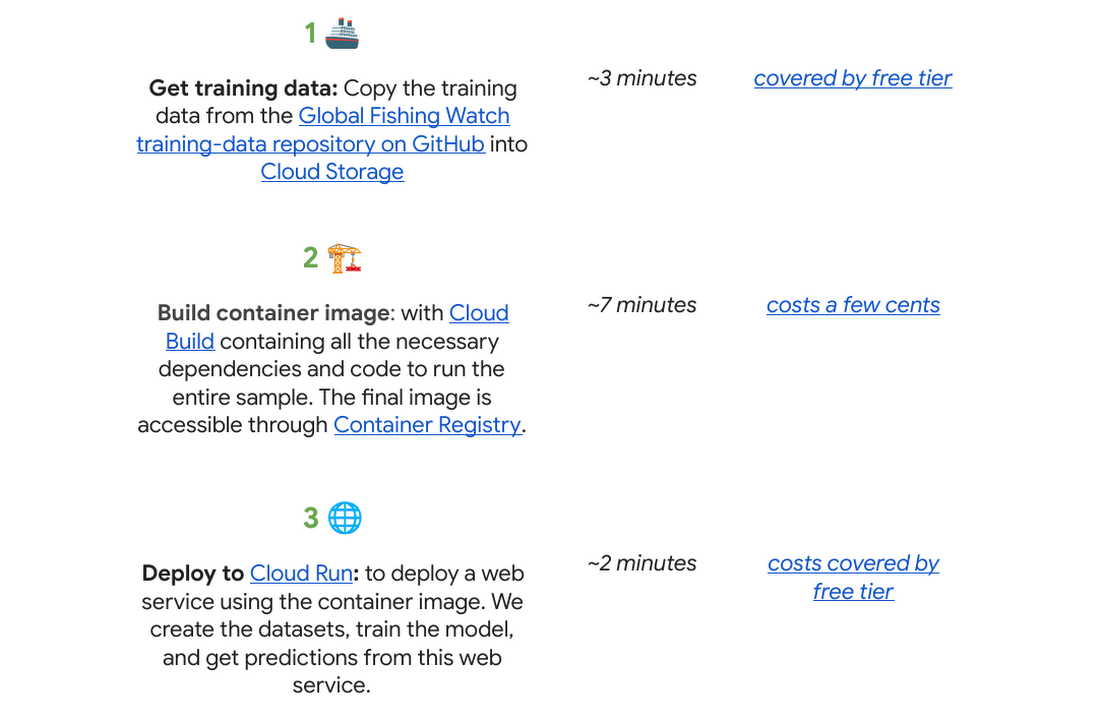
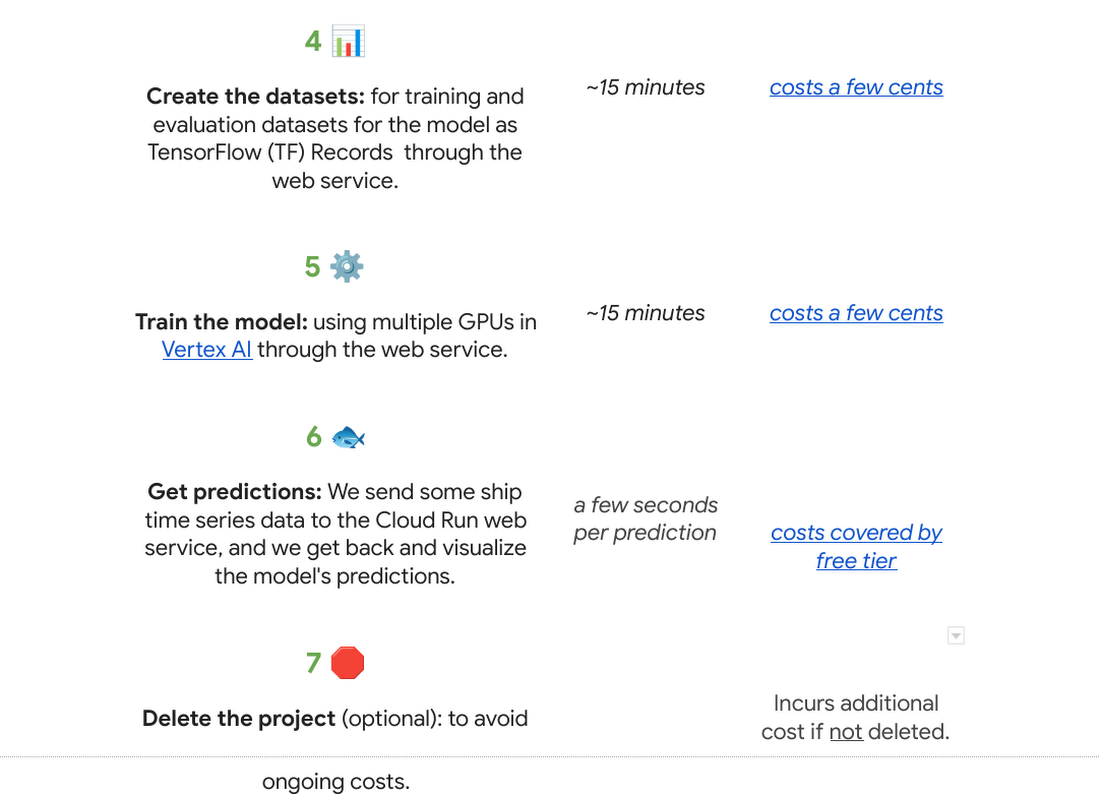
There are seven steps we went through with their approximate time and cost:
Why do we use a time series classification model?
Vessels in the ocean are constantly moving, which creates distinctive patterns from a satellite view.
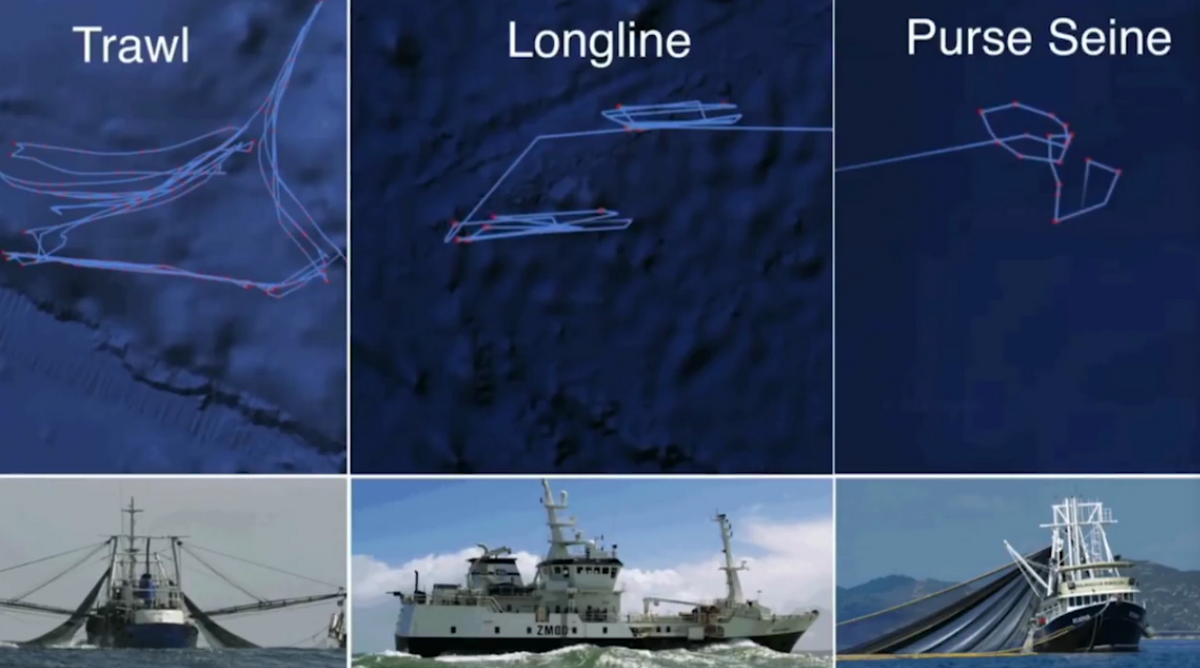
We can train a model to recognize the shapes of a vessel’s trajectory. Large vessels are required to use the automatic identification system, or AIS. The GPS-like transponders regularly broadcast a vessel’s maritime mobile service identity, or MMSI, and other critical information to nearby ships, as well as to terrestrial and satellite receivers. While AIS is designed to prevent collisions and boost overall safety at sea, it has turned out to be an invaluable system for monitoring vessels and detecting suspicious fishing behavior globally.

One tricky part is that the MMSI data location signal (which includes a timestamp, latitude, longitude, distance from port, and more) is not emitted at regular intervals. AIS broadcast frequency changes with vessel speed (faster at higher speeds), and not all AIS messages that are broadcast are received – terrestrial receivers require line-of-sight, satellites must be overhead, and high vessel density can cause signal interference. For example, AIS messages might be received frequently as a vessel leaves the docks and operates near shore, then less frequently as they move further offshore until satellite reception improves. This is challenging for a machine learning model to interpret. There are too many gaps in the data, which makes it hard to predict.
A way to solve this is to normalize the data and generate fixed-sized hourly windows. Then the model can predict if the vessel is fishing or not fishing for each hour.

It could be hard to know if a ship is fishing or not by just looking at its current position, speed, and direction. So we look at the data from the past as well, looking at the future could also be an option if we don’t need to do real time predictions. For this sample, it seemed reasonable to look 24 hours into the past to make a prediction. This means we need at least 25 hours of data to make a prediction for a single hour (24 hours in the past + 1 current hour). But we could predict longer time sequences as well. In general, to get hourly predictions, we need (n+24) hours of data.
Options to deploy and access the model
For this sample specifically we used Cloud Run to host the model as a web app so that other apps can call it to make predictions on an ongoing basis; this is our favorite in terms of pricing if you need to access your model from the internet over an extended period of time (charged per prediction request). You can also host it directly from Vertex AI where you trained and built the model, just note there is an hourly cost for using those VMs even if they are idle. If you do not need to access the model over the internet, you can make predictions locally or download the model onto a microcontroller if you have an IoT sensor strategy.

Want to go deeper?
If you found this project interesting and would like to dive deeper either into the specifics of the thought process behind each step of this solution or even run through the code in your own project (or test project); we invite you to check out our interactive sample hosted on Colab, which is a free Jupyter notebook. It serves as a guide with all the steps to run the sample, including visualizing the predictions on a dynamically moving map using an open source Python library called Folium.
There’s no prior experience required! Just click “open in Colab” which is linked at the bottom of GitHub.
You will need a Google Cloud Platform project. If you do not have a Google Cloud project you can create one with the free $300 Google Cloud credit, you just need to ensure you set up billing, and later delete the project after testing the desired sample.
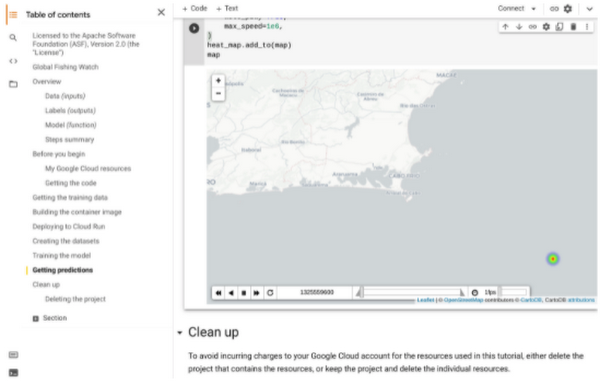
🌏🌎🌍 We hope to inspire you to build other beautiful climate-related solutions.
3129
Of your peers have already watched this video.
19:30 Minutes
The most insightful time you'll spend today!
Becoming Future-Proof: AI-Powered Integrated Business Planning on Google Cloud
If there’s one thing that the pandemic will leave us with it’s this: A deep desire to be better prepared. Not prepared for the next possible catastrophe because that’s hard to do, but better prepared for the repercussions of such disaster.
In this video, Stephan de Barse, Executive Vice President, o9 Solutions, talks about some of the ripple effects of large-scale disruption including demand variability and supply variability.
He shares practical insights on how large retailers and manufacturers can leverage next-generation technology to improve demand forecasting, visibility, and drive a faster response while optimizing their decision-making processes.
He also shares learnings from COVID-19 as well as the critical capabilities needed by industry leaders to become more agile and resilient in the post-pandemic world.
Data to Business Outcomes with Google’s Data Analytics Design Pattern

6732
Of your peers have already read this article.
1:30 Minutes
The most insightful time you'll spend today!
Companies today are inundated with vast amounts of data from various sources. This overwhelming amount of data is meant to benefit the company, but often leaves data teams feeling overwhelmed, which can create data bottlenecks and result in a slow time to value. In fact, only twenty seven percent of companies agree that data and analytics projects produce insights and recommendations that are highly actionable (Accenture). This means that nearly 3 in 4 companies are not unlocking value in their data, which poses a huge challenge for organizations trying to move the needle and drive real business results. We at Google Cloud, however, saw opportunity in this challenge, which is why we created Data Analytics Design Patterns: cross-product technical solutions designed to accelerate a customer’s path to value realization with their data. These industry solutions bring together product capabilities alongside design methodology, open source deployable code, data models, and reference architectures to accelerate your business outcomes.

With Data Analytics Design Patterns, you get access to more than 30 ready-to-deploy data analytics solutions. Design patterns leverage the best of Google and our rich partner ecosystem, including Technology Partners & System Integrators. In this blog, we will cover 3 examples on how a design pattern can be applied to unlock the value of data:
- Improve mobile app experience with Unified App Analytics
- Maximize digital shop’s revenue with Price Optimization
- Protect internal systems from security and malware threat with Anomaly Detection
Unified App Analytics
If mobile apps are part of your go-to-market strategy, you have several data sources that can provide invaluable customer insights. In addition to tools such as CRM (e.g. Salesforce) and customer care (e.g. Zendesk), you likely use Google Analytics to log app events and Firebase Crashlytics to gather data about app errors. But can you easily combine back-end server data with app front-end data to unlock customer insights?
The Unified App Analytics design pattern makes it easy to plug all the disparate data sources into a single warehouse (BigQuery) and start analyzing it with a Business Intelligence tool (Looker). Once you have a complete and real time view of your customer experience with your app, you can take action. For example, if you notice an increase in app errors, you can quickly combine your Crashlytics data with your CRM data to narrow down the crashes with the highest revenue impact and prioritize their resolution. Further, you can automate your issue resolution workflow by creating a rule for any future crash that impacts a subset of VIP customers.

With the Unified App Analytics design pattern, you’ll gain access to valuable insights about your user experience with your app so you can inform your future app strategy. For example, NPR, an American media company, increased user engagement by showing content that better mapped to listener interests and behaviors.
Price Optimization
In a competitive and hectic global marketplace, strategic pricing matters more than ever, but often projects are consumed by the tedium of standardizing, cleaning, and preparing data—from transactions, inventory, demand, among other sources.
Price Optimization solution allows retailers to build a data driven pricing model. The solution consists of three main components:
- Dataprep by Trifacta: integrates different data sources into a single Common Data Model (CDM). Dataprep is an intelligent data service for visually exploring, cleaning, and preparing structured and unstructured data for analysis, reporting, and machine learning.
- BigQuery: allows you to create and store pricing models in a consistent and scalable way as a serverless Cloud Data Warehouse service
- Looker dashboards: surface insights and enable business teams to take action with enterprise ready BI platform
With the Price Optimization design pattern from Google Cloud and our partner Trifacta, you’ll be able to rapidly unify multiple data sources and create a real-time and ML-powered analysis, leveraging predictive models to estimate future sales. For example, PDPAOLA, an online jewelry company, doubled sales with dynamic pricing adjustments enabled by a single data view.

Anomaly Detection
Organizations need to anticipate and act on risks and opportunities to stay competitive in a digitally transforming society. Anomaly detection helps organizations identify and respond to data points and data trends in high velocity, high volume data sets that deviate from historical standards and expected behaviors, allowing them to take action on changing user needs, mitigate malicious actors and behaviors, and prevent unnecessary costs and monetary losses.
The Anomaly Detection design pattern uses Google Pub/Sub, BigQuery, Dataflow, and Looker to:
- Stream events in real time
- Process the events, extract useful data points, train the detection algorithm of choice
- Apply the detection algorithm in near-real time to the events to detect anomalies
- Update dashboards and/or send alerts
The challenge of finding the important insights and anomalies in vast amounts of data applies to organizations across all industries and lines of business, but is especially important to protecting the security of an organization. For example, TELUS, a national communications company, modernized their security analytics platform leveraging this pattern, allowing them to detect anomalies in near real time to detect and mitigate suspicious activity.
Get started
Turn your data into business outcomes with Google Cloud and our broad partner ecosystem by deploying Data Analytics Design Patterns at your organization. There are more than 30 Data Analytics Design Patterns ready for you to use. We have more than 200+ more ideas in the pipeline, so be sure to check in regularly as new patterns will be added soon.
To dive deeper and find out more about how Data Analytics Design Patterns can help your organization accelerate use cases and create faster time to value, check out this video.

4892
Of your peers have already downloaded this article
1:30 Minutes
The most insightful time you'll spend today!
Artificial intelligence and machine learning are already transforming the technological landscape. From digital assistants to image-recognition software to self-driving cars, what was once the stuff of science fiction is now becoming a reality. But what exactly does it mean for marketing and advertising executives?
It could get us closer to one of advertising’s most-sought goals: relevance at scale. Before then, we’re going to see changes to the way we do business.
Technological advances have always created new opportunities for storytelling and marketing. Just as the advent of TV brought an era of truly mass advertising and reach, and the internet and mobile brought a new level of targeting and context, AI will change how people interact with information, technology, brands, and services.
A big part of the opportunity for marketers is how AI will help us fully realize personalization—and relevance—at scale. With platforms like Search and YouTube reaching billions of people everyday, digital ad platforms finally can achieve communication at scale. This scale, combined with customization possible through AI, means we’ll soon be able to tailor campaigns to consumer intent in the moment. It will be like having a million planners in your pocket.
Find out how you can achieve relevance at scale. Download now!
6441
Of your peers have already watched this video.
1:30 Minutes
The most insightful time you'll spend today!
Value Realization with Google Cloud for Retail SAP Data
Retail engagements have changed drastically over the last few years, and by the virtue of COVID-19 pandemic, retail data and customers’ expectations plummeted. To drive value and transformation across the entire value-chain retailers can make most of Google Cloud’s secure, reliable IaaS by migrating their SAP systems and taking advantage of integrations, insights and innovations. In times of change retail companies can gain maximum visibility of SAP data unlocking Google Cloud’s infrastructure modernization and Big Data and analytics capabilities. Watch the video to understand how Google Cloud and SAP partnership is a golden handshake for retail businesses’ future.
More Relevant Stories for Your Company

OCR Engine Upgrade: Document AI Introduces 3 New Capabilities
Documents are indispensable parts of our professional and personal lives. They give us crucial insights that help us become more efficient, that organize and optimize information, and that even help us to stay competitive. But as documents become increasingly complex, and as the variety of document types continues to expand,

redBus: Mastering Big Data with Google BigQuery
In 2006, online travel agency redBus introduced internet bus ticketing in India, unifying tens of thousands of bus schedules into a single booking operation. (Think of it as Expedia for bus booking.) Using BigQuery, redBus crunches terabytes of booking and inventory data in mere seconds and at a fraction of
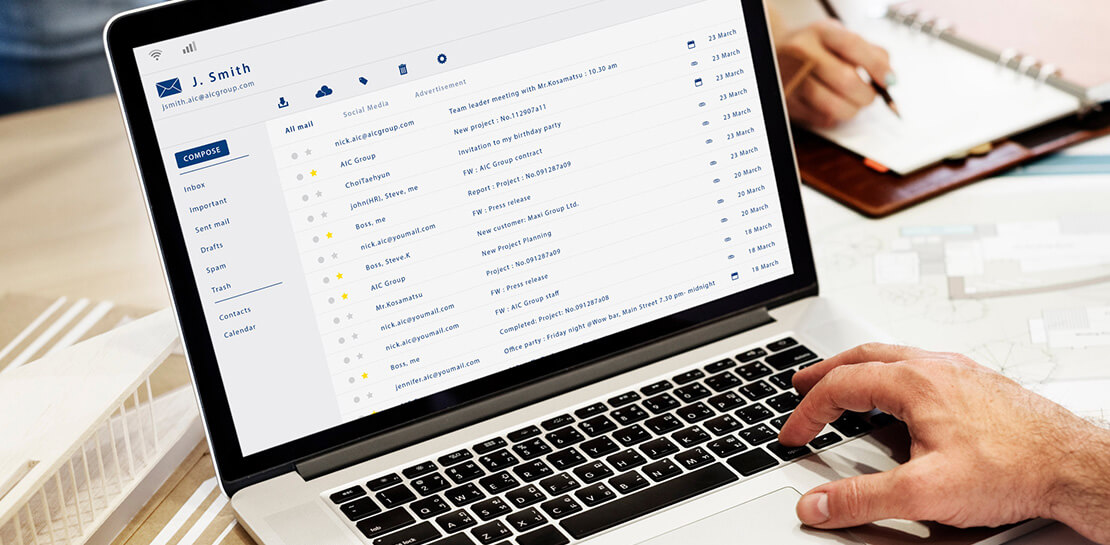
Google Cloud Helped Digitec Galaxus Personalize Over 2 Million Newsletters in a Week
Digitec Galaxus AG is the biggest online retailer in Switzerland, operating two online stores: Digitec, Switzerland's online market leader for consumer electronics and media products, and Galaxus, the largest Swiss online shop with a steadily growing range of consistently low-priced products for almost all daily needs. Known for its efficient, personalized shopping experiences,

Harnessing the Power of Data and AI to Transform Life Science Supply Chains
Global life science supply chains are lengthy and complex with many moving parts. One small disruption can create serious delays and affect your ability to deliver therapeutics for patients. Supply chain disruptors Over the last few years, healthcare organizations have encountered a range of obstacles, from both internal and external
