






Customer Voices: How Firms from Across Industries Leverage Google Cloud
READ FULL INTRODOWNLOAD AGAIN14089
Of your peers have already downloaded this article
1:30 Minutes
The most insightful time you'll spend today!
6174
Of your peers have already watched this video.
16:00 Minutes
The most insightful time you'll spend today!
Easy Access to Stream Analytics with Google Cloud
By 2025, more than a quarter of the data created in the global datasphere will be real-time in nature.
“This is important because in the real-time world, “the window of opportunity diminishes and goes away really fast. You want to be able to respond to your customer needs, their asks, and be able to do prediction or maybe detect some problem and really respond to it really fast,” says Evren Eryurek, Director of Product Management for Stream Analytics at Google Cloud.
Today, streaming analysis of application and user events only continue to become more central to how every business operates. With this development comes an accompanying rise in customer expectations for businesses to be aware, prepared, and delivering real-time solutions. Is your business ready?
In this session, Eryurek will showcase Google Cloud’s latest developments to enable easy access to creation and management of real-time data driven experiences.
Learn the latest about the products powering Google’s streaming capabilities and hear directly from the team bringing them to life.
Google Cloud Helps Northwell Health to Boost Caregiver Productivity and Access to Right Care Using AI

7951
Of your peers have already read this article.
2:00 Minutes
The most insightful time you'll spend today!
Lung cancer is the leading cause of cancer death in the United States and like any cancer, early detection is crucial to survival. Screening at-risk populations is an important part of reducing mortality, and if concerning nodules are found on imaging, further testing may be required. Today, we’ll share how Northwell Health uses Google Cloud products such as Cloud Healthcare APIs and BigQuery to increase caregiver productivity and deliver better care for patients with findings that indicate potential development of lung cancer.
Northwell is New York’s largest healthcare provider
Northwell Health is New York’s largest healthcare provider with 23 hospitals and nearly 800 outpatient facilities. Northwell’s nearly 4,000 doctors care for millions of patients each year, and at this scale, there is an immense amount of healthcare data to manage. To better manage and leverage this data, Northwell Health partnered with Google Cloud starting in 2018.
Enabling caregivers to spend more time with patients
Nic Lorenzen, the lead developer of Northwell Emerging Technology and Innovation team, has a mission to put together data for caregivers in a way that makes sense. It is no secret that inefficient electronic health records systems have a negative impact on a physician’s ability to deliver quality care. Traditional EHRs have information distributed across many tabs, which forces caregivers to spend considerable time at the computer trying to find information. Moreover, speed of care matters. If care is delayed, patients may have to spend more time in the hospital and may suffer worse health outcomes.
To solve this problem, Nic’s team focused on giving caregivers the most relevant pieces of data at the right time by developing an intelligent clinician rounding app. The data needed to derive these insights can depend on the caregiver’s role–a nurse cares about different things than a cardiologist. This system aggregates multiple data sources, and provides patient-specific insights to caregivers.
This system would not have been possible before with traditional EHRs and data warehouses that have proprietary data models and rarely sync data in real time. Now with data easily accessible through Google Cloud’s Healthcare solutions, Nic’s team can deliver the right clinical information to the right people instantly. These days, Nic says, “instead of spending 75% of our time dealing with architecting the underlying platforms, we spend 75% of our time focused on higher value use cases for clinicians and patients. Google Cloud’s Healthcare solutions have greatly improved our developer productivity and time to value.”
Caregivers have found this new system to be a game changer.Before the implementation of this system, caregivers would spend, on average, seven to nine minutes finding the data needed to make medical decisions for one patient. Now, that aggregated information is delivered to a caregiver’s mobile device in less than a second.
Ensuring patients get the right care with the power of AI
There are a number of reasons why patients might not get the care that they need. For example, patients today can go to multiple hospitals and clinics settings, and coordinating care across multiple facilities is complex. Regional hospitals and clinics have their own siloed view of their data, so pertinent information gathered by one clinic might not be seen by another. These gaps in clinical data lead to gaps in patient care.
When a patient gets radiologic imaging, they may have findings unrelated to the reason they initially got the imaging. For example, a chest CT for a car accident might reveal an incidental lung nodule that could be cancerous. Unfortunately, research shows that a large portion of patients do not get follow up for these incidental findings because it isn’t the primary reason why the patient is seeing a doctor. Moreover, social determinants of health are a factor that affects which patients receive follow-up care. Identifying these patients and providing the necessary follow up care prevents adverse events related to delayed detection of cancer.

With Cloud Healthcare solutions, Northwell built an AI model to identify these patients so that oncologists can appropriately follow up with patients who have findings suspicious for lung cancer. The AI model detects incidental pulmonary nodules in radiology reports so that doctors can then contact the patients that need follow-up care. Nic says his team was able to build this system in a week: “Google Cloud did a lot of heavy-lifting for us and allowed us to get to the AI applications much faster. It allowed us to build a platform that just works.”
Healthcare systems can now rapidly generate healthcare insights with one end-to-end solution, Google Cloud Healthcare Data Engine. It builds on and extends the core capabilities of the Google Cloud Healthcare API to make healthcare data more immediately useful by enabling an interoperable, longitudinal record of patient data. Northwell Health uses Google Cloud as the core of their platform, enabling their developers to create solutions to the most pressing healthcare problems.
Special thanks to Kalyan Pamarthy, Product Management Lead on Cloud Healthcare and Natural Language APIs for contributing to this blog post.
How to Enhance Incremental Pipeline Performance while Ingesting Data into BigQuery

6320
Of your peers have already read this article.
3:00 Minutes
The most insightful time you'll spend today!
When you build a data warehouse, the important question is how to ingest data from the source system to the data warehouse. If the table is small you can fully reload a table on a regular basis, however, if the table is large a common technique is to perform incremental table updates. This post demonstrates how you can enhance incremental pipeline performance when you ingest data into BigQuery.
Setting up a standard incremental data ingestion pipeline
We will use the below example to illustrate a common ingestion pipeline that incrementally updates a data warehouse table. Let’s say that you ingest data into BigQuery from a large and frequently updated table in the source system, and you have Staging and Reporting areas (datasets) in BigQuery.

The Reporting area in BigQuery stores the most recent, full data that has been ingested from the source system tables. Usually you create the base table as a full snapshot of the source system table. In our running example, we use BigQuery public data as the source system and create reporting.base_table as shown below. In our example each row is identified by a unique key which consists of two columns: block_hash and log_index.
CREATE TABLE reporting.base_table --156 GB processedPARTITION BY TIMESTAMP_TRUNC(block_timestamp, DAY) ASSELECT log_index, data, topics, block_timestamp, block_hashFROM bigquery-public-data.crypto_ethereum.logsWHERE block_timestamp BETWEEN TIMESTAMP '2020-01-01' AND TIMESTAMP '2020-11-30';
In data warehouses it is common to partition a large base table by a datetime column that has a business meaning. For example, it may be a transaction timestamp, or datetime when some business event happened, etc. The idea is that data analysts who use the data warehouse usually need to analyze only some range of dates and rarely need the full data. In our example, we partition the base table by block_timestamp which comes from the source system.
After ingesting the initial snapshot you need to capture changes that happen in the source system table and update the reporting base table accordingly. This is when the Staging area comes into the picture. The staging table will contain captured data changes that you will merge into the base table. Let’s say that in our source system on a regular basis we have a set of new rows and also some updated records. In our example we mock the staging data as follows: first, we create new data, than we mock the updated records:
CREATE TABLE staging.load_delta AS --5 GB processedSELECT log_index, data, topics, block_timestamp, block_hashFROM bigquery-public-data.crypto_ethereum.logsWHERE block_timestamp BETWEEN TIMESTAMP '2020-12-01' AND TIMESTAMP '2020-12-07';INSERT INTO staging.load_delta --2 GB processedSELECT log_index, CONCAT(data, RAND()), topics, block_timestamp, block_hashFROM bigquery-public-data.crypto_ethereum.logs TABLESAMPLE SYSTEM (5 PERCENT)WHERE block_timestamp BETWEEN TIMESTAMP '2020-10-01' AND TIMESTAMP '2020-11-30';
Next, the pipeline merges the staging data into the base table. It joins two tables by unique key and than updates the changed value or inserts a new row
MERGE INTO reporting.base_table T --161 GB processedUSING staging.load_delta SON T.block_hash = S.block_hashAND T.log_index = S.log_indexWHEN MATCHED THEN UPDATE SETT.data = S.dataWHEN NOT MATCHED THEN INSERT (log_index, data, topics, block_timestamp, block_hash)VALUES (log_index, data, topics, block_timestamp, block_hash);
It is often the case that the staging table contains keys from various partitions but the number of those partitions are relatively small. It holds, for instance, because in the source system the recently added data may get changed due to some initial errors or ongoing processes but older records are rarely updated. However, when the above MERGE gets executed, BigQuery scans all partitions in the base table and processes 161 GB of data. You might add additional join condition on block_timestamp:
MERGE INTO reporting.base_table T --161 GB processedUSING staging.load_delta SON T.block_hash = S.block_hashAND T.log_index = S.log_indexAND T.block_timestamp = S.block_timestampWHEN MATCHED THEN UPDATE SETT.data = S.dataWHEN NOT MATCHED THEN INSERT (log_index, data, topics, block_timestamp, block_hash)VALUES (log_index, data, topics, block_timestamp, block_hash);
But BigQuery would still scan all partitions in the base table because condition T.block_timestamp = S.block_timestamp is a dynamic predicate and BigQuery doesn’t automatically push such predicates down from one table to another in MERGE.
Can you improve the MERGE efficiency by making it scan less data? The answer is Yes.
As described in the MERGE documentation, pruning conditions may be located in a subquery filter, a merge_condition filter, or a search_condition filter. In this post we show how you can leverage the first two. The main idea is to turn a dynamic predicate into a static predicate.
Steps to enhance your ingestion pipeline
The initial step is to compute the range of partitions that will be updated during the MERGE and store it in a variable. As was mentioned above, in data ingestion pipelines, staging tables are usually small so the cost of the computation is relatively low.
DECLARE src_range STRUCT<date_min TIMESTAMP, date_max TIMESTAMP> --115 MB processedDEFAULT(SELECT STRUCT(MIN(block_timestamp) AS date_min,MAX(block_timestamp) AS date_max) FROM staging.load_delta);
Based on your existing ETL/ELT pipeline, you can add the above code as-is to your pipeline or you can compute date_min, data_max as part of some already existing transformation step. Alternatively, date_min, data_max can be computed on the Source System side while capturing the next ingestion data batch.
After computing date_min, date_max you pass those values to the MERGE statement as static predicates. There are several ways to enhance the MERGE and prune partitions in the base table based on precomputed date_min, data_max.
If your initial MERGE statement uses a subquery, you can incorporate a new filter into it:
BEGINDECLARE src_range STRUCT<date_min TIMESTAMP, date_max TIMESTAMP> --115 MB processedDEFAULT(SELECT STRUCT(MIN(block_timestamp) AS date_min,MAX(block_timestamp) AS date_max) FROM staging.load_delta);MERGE INTO reporting.base_table T --41 GB processedUSING (SELECT *FROM staging.load_deltaWHERE block_timestamp BETWEEN src_range.date_min AND src_range.date_max) SON T.block_hash = S.block_hashAND T.log_index = S.log_indexAND T.block_timestamp = S.block_timestampWHEN MATCHED THEN UPDATE SETT.data = S.dataWHEN NOT MATCHED THEN INSERT (log_index, data, topics, block_timestamp, block_hash)VALUES (log_index, data, topics, block_timestamp, block_hash);END;
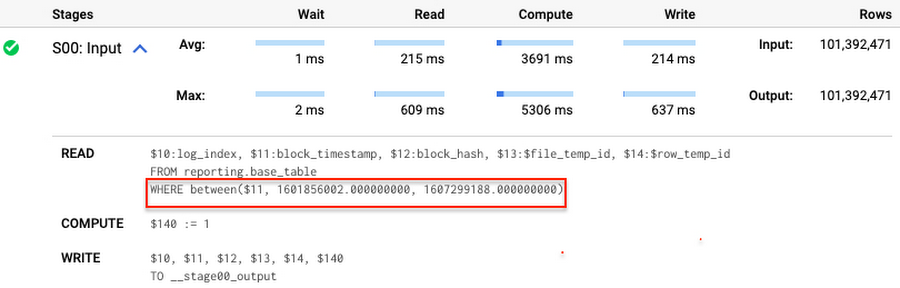
Note that you add the static filter to the staging table and keep T.block_timestamp = S.block_timestamp to convey to BigQuery that it can push that filter to the base table. This MERGE processes 41 GB of data in contrast to the initial 161 GB. You can see in the query plan that BigQuery pushes the partition filter from the staging table to the base table:
This type of optimization, when a pruning condition is pushed from a subquery to a large partitioned or clustered table, is not unique for MERGE. It also works for other types of queries. For instance:
SELECT * -- 41 GB processedFROM reporting.base_table TINNER JOIN staging.load_delta SON T.block_hash = S.block_hashAND T.log_index = S.log_indexAND T.block_timestamp = S.block_timestampWHERE S.block_timestamp BETWEEN TIMESTAMP '2020-10-05' AND TIMESTAMP '2020-12-07'
And you can check the query plan to verify that BigQuery pushed down the partition filter from one table to another.
Moreover, for SELECT statements, BigQuery can automatically infer a filter predicate on a join column and push it down from one table to another if your query meets the following criteria:
- The target table must be clustered or partitioned.
- The result size of the other table, i.e. after applying all filters, must qualify for broadcast join. Namly, the result set must be relatively small, less than ~100MB.
In our running example, reporting.base_table is partitioned by block_timestamp. If you define a selective filter on staging.load_delta and join two tables, you can see an inferred filter on the join key pushed to the target table
SELECT *FROM reporting.base_table TINNER JOIN staging.load_delta SON T.block_timestamp = S.block_timestampWHERE S.block_hash = '0x0c1caa16b34d94843aabfebc0d5a961db358135988f7498a6fdc450ad55f0870'
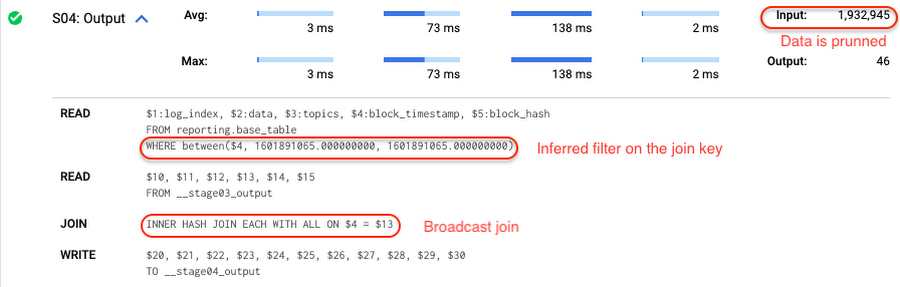
There is no requirement to join tables by partitioning or clustering key to kick off this type of optimization. However, in this case the pruning effect on the target table would be less significant.
But let us get back to the pipeline optimizations. Another way to enhance MERGE is to modify the merge_condition filter by adding static predicate on the base table:
BEGINDECLARE src_range STRUCT<date_min TIMESTAMP, date_max TIMESTAMP> --115 MB processedDEFAULT(SELECT STRUCT(MIN(block_timestamp) AS date_min,MAX(block_timestamp) AS date_max) FROM staging.load_delta);MERGE INTO reporting.base_table T --41 GB processedUSING staging.load_delta SON T.block_hash = S.block_hashAND T.log_index = S.log_indexAND T.block_timestamp BETWEEN src_range.date_min AND src_range.date_maxWHEN MATCHED THEN UPDATE SETT.data = S.dataWHEN NOT MATCHED THEN INSERT (log_index, data, topics, block_timestamp, block_hash)VALUES (log_index, data, topics, block_timestamp, block_hash);END;
To summarize, here are the steps that you can perform to enhance incremental ingestion pipelines in BigQuery. First you compute the range of updated partitions based on the small staging table. Next, you tweak the MERGE statement a bit to let BigQuery know to prune data in the base table.
All the enhanced MERGE statements scanned 41 GB of data, and setting up the src_range variable took 115 MB. Compare it with the initial 161 GB scan. Moreover, given that computing src_range may be incorporated into some existing transformation in your ETL/ELT, it results in a good performance improvement which you can leverage in your pipelines.
In this post we described how to enhance data ingestion pipelines by turning dynamic filter predicates into static predicates and letting BiQuery prune data for us. You can find more tips on BigQuery DML tuning here.
Special thanks to Daniel De Leo, who helped with examples and provided valuable feedback on this content.
3395
Of your peers have already listened to this podcast
30:54 Minutes
The most insightful time you'll spend today!
AI-as-a-Service is Here. It’s Really Almost Plug-and-Play
From powering everyday operations and accelerating application innovation, to providing tools for specific business needs and executing on big ideas, to advancing the security of technology solutions, companies from across industries have leveraged Google Cloud for business benefits.
Companies from across industries have turned to Google Cloud for transforming their business, modernizing their infrastructure, and gleaning intelligence from data. For instance:
- Johnson & Johnson achieved a 41% increase in search results from high-quality job applicants, significantly improving the company’s ability to quickly hire top talent.
- Sony Network Communications now processes 10 billion monthly queries faster, which advances data analysis.
- University College Dublin saw significant 6-figure savings by eliminating legacy hardware, software, and maintenance.
And there are many such examples. Read the collection of case studies to find out how companies from across industries and geographies leveraged Google Cloud for measurable business benefits and for solving complex problems.
AgroStar: Small farms in India getting big help from the cloud

13223
Of your peers have already read this article.
3:30 Minutes
The most insightful time you'll spend today!
AgroStar has launched a cloud-based mobile app that is helping to boost crop yields and encourage best practices for small farmers in India. Launched as an on-premises ecommerce platform selling farm tools in 2008, the firm turned to Google Cloud Platform (GCP) to expand its offering. It now uses cloud-based analytics and is deploying ML models to provide timely advice in five languages on everything from seed optimization, crop rotation, and soil nutrition to pest control.
A 2018 survey underscored the demand for agricultural planning for Indian farmers. While farming remains a dominant sector in India, employing half of its labor force, 70 percent of small farmers – those cultivating fewer than three acres – said their crops are damaged by unforeseen weather and pests. An even higher number – 74 percent – say they lack access to farming-related information.
Widening that gap is the relative lack of access to new, higher yield seeds and improved soil analyses for small farmers, who must otherwise rely on traditional methods. “It could take a few years for innovative information to trickle down from universities to small, grassroots farmers,” says Pritesh Gudge, AgroStar Software Engineer. “Today, just by clicking through our Android application, farmers learn about new, effective farming practices and receive advice customized to their crop and soil.”
Connecting a million farmers in the cloud
Operating in the Indian states of Gujarat, Maharashtra, Rajasthan, Orissa, Bihar, and Karnataka, AgroStar is closing the knowledge gap with a full-service, cloud-based SaaS solution – the only one of its kind in India. It combines agronomy, data science, and analytics to help farmers by providing a variety of resources.
AgroStar has reached over a million farmers through its Android app, the AgroStar Agri-Doctor. The mobile client is available as a web-based or full-featured native app. Both provide access to the firm’s knowledge base hosted on GCP, a Q&A forum that connects farmers to each other to help understand and better solve problems and to learn about innovative practices and products. Farmers can also click through to follow local and national market trends that help forecast crop prices.
In addition to the self-service knowledge base, AgroStar provides access to agronomy experts who use cloud-based analytics tools and historical data to provide season-and locale-specific advice to each farmer. “We are now tracking thousands of calls in 5 languages each day,” says Pritesh.
The AgroStar app also provides links to purchase and then track the delivery of farm tools and supplies such as cultivators and fertilizers. An in-house platform manages fulfillment centers and a doorstep delivery network simplifies the supply chain while giving farmers what they need, when they need it. By procuring directly from the manufacturers and primary distributors of farm supplies, Agrostar is achieving cost savings, which it passes on to farmers.
Build fast, pivot faster
From the start, the human and environmental variables of farming in India, not to mention the volume of AgroStar’s few hundred thousand monthly active users, made a highly scalable cloud-based solution inevitable. Farmers rely on the firm’s Agri-Doctor app to provide advice in multiple languages on topics that range widely throughout three growing seasons, each with distinct crop nutrition and rotation cycles and farm implementation requirements.
“For farmers, the focus keeps changing every month, and every season,” says Pritesh. “To serve our growing community, we needed a platform that could process images at high volume, fulfill tools and seed orders across thousands of miles, and respond to multilingual queries. We quickly moved away from spreadsheets and server-based solutions – we needed to build fast and pivot faster.”
Ending late-night deployments
The firm’s first cloud experience was with an AWS solution. At the time, AWS was the only cloud provider in India, but AgroStar wanted to find a solution that was easier to use and offered better integration with Android devices. “Deployment and processing costs were very high, and the developer tools and documentation were not as intuitive as we needed,” says Pritesh.
When GCP service arrived in India in October 2017, AgroStar embarked on a platform re-implementation that made possible dramatic changes in the way it developed and deployed its solution. Using Google Kubernetes Engine (GKE) for crop advice management and Compute Engine for its production application services, the firm built the backend for the Agri-Doctor discussion forum in only three weeks. The platform’s microservice architecture is implemented in Python and Golang and deployed on GCP.
AgroStar began to realize significant efficiencies in its build, deploy, and test cycles. “We previously needed to work overnight to deploy to production,” says Pritesh. “Now using Google for Kubernetes containers and a rolling update strategy, we can deploy during the day without any problems or interruptions to service.”
The move to GCP streamlined AgroStar’s stack. “We were running 12 independent instances on AWS,” says Pritesh. “With Google Kubernetes Engine, we are deployed on a single cluster at a cost savings of $1,300 per month and growing.”
Improving customer response times by 85 percent
With a managed deployment capability, AgroStar can devote more time and resources to executing on its platform and Agri-Doctor app development plan. A strategic goal was managing customer response times as the firm grew its base. GCP has helped the firm meet that goal, achieving an 85 percent improvement in customer response times even as traffic grew significantly.
“With our on-premises solution, we could handle around 100 customers daily, which took 30 to 50 minutes for each customer,” says Pritesh. “We now handle thousands of customers daily, taking only 4 to 5 minutes for each one.”
AgroStar used Firebase to implement its Agri-Doctor app. A real-time cloud database, Firebase provides an API that enables the Agri-Doctor advice forum to be synchronized across all its far-flung mobile clients, effectively sharing knowledge base updates with one million users in near real time.
Using cloud tools to manage and monitor
Cloud Pub/Sub, Kafka, and Cloud Dataflow manage data ingestion and queueing of event and transaction data to the analytics layer. BigQuery fetches and persists data to Cloud Storage. Cloud SQL and dashboards powered by Tableau deliver farmer crop and soil profiles within minutes.
Cloud IAM helps AgroStar control access to all its cloud resources. And Stackdriver, the integrated logging aggregation capability for GCP, helps monitor and speed debugging on every tier of the AgroStar solution.
Machine learning to enhance yields
AgroStar is developing a variety of ML components to improve responsiveness and extend its platform offerings.
To speed up the diagnosis of and treatment for crop blight, AgroStar is building a deep learning pipeline using TensorFlow. The pipeline relies on GoogLeNet models that use multi-layered convolutional visual pattern recognition. It will assess uploaded images to support a disease-detection capability on the mobile app. Based on the commercially successful AI algorithms that automated postal code processing, GoogLeNet offers improved performance and computational efficiencies by using a creative layering technique that distinguishes them from older, sequential recognition engines.
To improve its customer search experience, AgroStar is developing an ML pipeline that shrinks fetch times by suggesting tags mapped to stored data. Processed using TPUs, Cloud Natural Language and Video AI, the tags provide a metadata layer that supports queries in any of the ten natural languages that AgroStar farmers can use.
The AgroStar search pipeline consists of Long Short-Term Memory (LSTM) models of Recurrent Neural Networks. Recurrent networks exhibit “memory” through iterative processing and are distinguished from feedforward networks by a feedback loop connected to their past decisions, ingesting their own outputs moment after moment as input.
Implementing a recommendation engine
The firm is also adapting the Random Forests TensorFlow AI model to develop a crop and product recommendation engine. The model is trained by consuming numerical (rainfall, humidity, water availability per acre) and categorical (soil type, water sources) parameters to suggest appropriate products by season, region, and locale.
To simplify the product suggestion experience, AgroStar developers are testing Cloud Dialogflow, the Google Cloud conversational interface, to build a chatbot capability into its mobile app. The bot will track a farmer’s crop schedules and answer simple questions by linking to the recommendation engine.
AgroStar is also extending its analytics platform with AI-powered sales planning and forecasting. Using linear regression models implemented in TensorFlow and powered by Cloud ML Engine, the capability will enhance supply chain logistics as the company scales its operations across India.
To provide a credit on-demand offering for a range of seed-to-harvest cycle products, AgroStar is attempting to use Vision API to create an AI model that will convert uploaded photos of customer application records into standard data formats. The firm’s credit policy features a grace period in which farmers begin paying back loans after harvested crops go to market.
A versatile and friendly development ecosystem
AgroStar credits the convivial tools and documentation that GCP offers and its incremental, pay-as-you-go pricing model for both the firm’s success and its ability to manage growth.
“What Google Cloud offers is extremely good documentation and extremely simple-to-use tools and interfaces across all services,” says Pritesh. “It helped us initially deploy our platform and at every scale that we have required since then, and its cost effectiveness enabled us to staff up to meet new feature milestones.”
More Relevant Stories for Your Company

Quantum Metric Increases Business 10-fold
At Quantum Metric, we’re in the business of bringing our customers business insights that are based on customer experience data and analytics for mid-market and Fortune 500 companies. Our software, powered by big data, machine intelligence, and Google Cloud, helps our customers identify, quantify, prioritize and measure opportunities to improve

A CIO’s Guide to Data Analytics and Machine Learning
Breakthroughs in artificial intelligence (AI) have captured the imaginations of business and technical leaders alike. The AI techniques underlying these breakthroughs are finding diverse application across every industry. Early adopters are seeing results, particularly encouraging is that AI is starting to transform processes in established industries, from retail to financial

Largest Beauty Retailer in the US Powers Digital Transformation with Google Cloud Smart Analytics
Digital technology offers increasing flexibility and choice to consumers. As a result, the retail industry is dramatically shifting toward more tailored and personalized experiences for shoppers, and businesses are rethinking how they deliver value to customers. This couldn’t be more true for the beauty retailing industry where leading companies are
Collateral IT: Leveraging Google Cloud for Enhanced Asset Allocation at HSBC
Have you ever heard of an optimization problem? Imagine you have a million marbles, all of different sizes, colors, patterns, and weights. You need to fill up 1,000 jars of different sizes with them, but each jar has restrictions as to which colors, patterns, and how many marbles of each
