





3572
Of your peers have already watched this video.
1:30 Minutes
The most insightful time you'll spend today!
Building a Powerful Digital Payments Solution
See how the Payeezy business platform, which enables merchants to establish and grow their eCommerce business, was set up and how it works.
The platform enables the exposure of First Data services, processes, and data to partners. The Payeezy API provides all the tools partners need to set up payments in their apps, set up merchant accounts on behalf of clients, and get paid.
First Data partners with Apigee to offer a powerful and easy to use developer portal.The Apigee Edge API management platform enabled First Data to accelerate development of the Payeezy APIs.
Pizza Hut India: Increasing Customer Coverage and Delivering Pizzas on Time

4979
Of your peers have already read this article.
3:30 Minutes
The most insightful time you'll spend today!
A subsidiary of United States-headquartered corporation Yum! Brands, Pizza Hut prides itself on serving more pizzas than any other pizza business. Founded in 1958, Pizza Hut operates 18,000 restaurants in over 100 countries. In the Indian subcontinent, Pizza Hut and franchise partners Devyani International and Sapphire Foods India operate more than 500 pizza restaurants, including 430 in India itself.
Yum! Brands aims to increase the number of Pizza Hut restaurants in India to 700 by 2022 and has nominated the country as one of the keys to its future growth. The business also operates the KFC and Taco Bell brands in India.
“Globally we are the number one pizza chain in the world based on store count and we aim to be the single biggest pizza brand in India,” says Prashant Gaur, Chief Brand and Customer Officer, Pizza Hut India Subcontinent.
Google Cloud Results
- Maximizes customer coverage and helps ensure riders deliver pizzas to customers within required timeframes
- Onboards new stores to delivery in half a day, rather than the one month required previously
- Meets tech-savvy customer demands to interact across new social media messaging channels
- Launch of live tracking delivers superior customer experience, driving positive word of mouth and repeat business
Pizza Hut launched initially in the country in the late 1990s as a dine-in restaurant brand. However, with changing customer needs, Pizza Hut soon included delivery and takeaway to provide customers with the best tasting pizzas whenever and wherever they wanted them. “Pizza is always at the center of the experience, whether through delivery, dine-in, or takeaway,” says Gaur. “Convenience is key in allowing people to access our products.”
Manual processes
While the business had long shifted into a model that featured delivery and takeaway options, it still used some manual processes. For example, some restaurants used manual listings of customer addresses to manage delivery, which ended up excluding some customers and compromising the brand. In other cases it could take the business up to a week to create a trade zone – a delivery zone assigned to a restaurant – for each new outlet, delaying the commencement of delivery services and costing the business money.
In addition, Pizza Hut India identified an opportunity to more closely track whether pizzas were being delivered within targeted timeframes.
“In some cases, we were using a manual, self-reporting mechanism that provided information about the number of orders that reached consumers less than 30 minutes after an order was placed,” explains Ashish Agarwal, Director, Technology and eCommerce, Pizza Hut India Subcontinent. “We wanted to objectively track and verify delivery times.”
Manual order tracking and execution also limited the number of orders that could be processed effectively during demand peaks. Further, customers could not monitor the status of their pizza orders, including estimated time of arrival.
“Millennial consumers expect products and services to be available when and where they want them. Our focus is to retain the heritage of the brand, which is the dine-in environment, legendary service, and great assets in terms of our stores, while responding to this demand,” adds Gaur.
Pizza Hut India also needed improved analytics in order to identify where the best returns could be achieved by opening new restaurants; how to improve the customer experience; and operate more efficiently.
The business decided to implement a transformation program underpinned by two imperatives: the need to deliver operational efficiencies and scale faster by accelerating the opening of new stores, and the need to give consumers the option of connecting with the brand using the most convenient channel.
A ground-breaking initiative
Pizza Hut India evaluated potential technology partners that could help deliver the program and decided to partner with digital consulting services company MediaAgility, and use Google Maps Platform and Google Cloud Platform services.
“Our journey with MediaAgility and Google incorporated two key initiatives that had a specific impact on our brand and consumers,” says Gaur. “The first of these initiatives was the launch of a feature that enabled consumers and our business to track delivery riders in real time.”
This initiative was ground-breaking for a business that had, until recent years, focused on establishing itself as a restaurant brand. However, with delivery an increasingly important part of its revenue mix, Pizza Hut India decided to build customer engagement through the channel. “By allowing customers to track delivery riders in real time, we could improve engagement – but more importantly give them control,” says Gaur.
During the evaluation, MediaAgility demonstrated Google Maps Platform to Pizza Hut India. “We loved Google Maps Platform as its accuracy and value was proven by consumers using Google Maps for their day-to-day needs,” says Agarwal.
Pizza Hut India conducted brainstorming sessions with MediaAgility and its franchise partners to develop its strategy and complete the implementation. The business then completed several proofs of concept to determine how best to deploy and adapt the technology to some operational processes. “We submitted some data points to our franchise partners and our Pizza Hut brand operations team, and they determined which option to adopt,” says Agarwal.
Google Maps Platform powers delivery
MediaAgility, Pizza Hut India, and the franchise partners then completed a three-month implementation that included onboarding all existing restaurants and new restaurants to the delivery platform based on Google Maps Platform and on Google Cloud Platform.
Pizza Hut India now uses Distance Matrix API through Google Maps Platform to provide travel time and distance based on recommended routes between origins and destinations. This service helps provide delivery riders’ estimated time of arrival to customers.
Directions Service calculates directions by communicating with the Google Maps API Directions Service, which receives direction requests and returns efficient paths based on travel time and factors such as distance and number of turns. This service provides a view of the delivery rider’s position relative to the customer’s location.
Through the Nearest Roads service included in Roads API, Pizza Hut India obtains individual road segments for given GPS coordinates, while Snap to Roads provides the best-fit road geometry for given GPS coordinates.
The business employs Maps Javascript API to customize maps with dedicated content and imagery for websites and mobile devices – showing a map view to store managers and customers – and uses Maps SDK for Android to add maps based on Google Maps to its applications.
Google Cloud Platform runs the delivery platform
Pizza Hut India is running its delivery platform on a Google Cloud Platform architecture that comprises App Engine to run its web applications; virtual machine instances provided through Compute Engine; Cloud Datastore to run a NoSQL document database; Firebase to develop and run its mobile applications; Cloud Storage to store data; and a BigQuery analytics data warehouse.
Realizing goals
With Google Maps Platform and Google Cloud Platform, Pizza Hut India and its franchise partners are realizing the goals of the transformation program.
Rather than take up to seven days to manually map trade zones for stores, Pizza Hut India uses Google Maps Platform to create and update them as required. “After we started working with MediaAgility and Google, we digitized those maps and created trade zones – zones within which Pizza Hut India restaurants will deliver – based on estimated travel times during the busiest time of the week,” says Gaur. “This minimizes the risk of late deliveries.
“The other benefit was reduced time to activate new stores,” he adds. “If you are launching 100 stores per year, this becomes a big, big task. Now we can bring new stores into the market much more quickly.”
With MediaAgility and Google Maps Platform, the business can also help ensure newly built establishments – such as blocks of flats – are captured within trade zones, allowing stores to deliver to residents.
Delivery accounts for increased transactions
Pizza Hut India now automatically allocate orders to delivery riders using a rider tracking application on their mobile phones. When a rider starts his or her journey, Google Maps Platform enables point-by-point tracking by consumers and store managers. The Pizza Hut India delivery operations team monitors delivery performance through a real-time dashboard.
Pizza Hut India is meeting customer expectations of live, map-based streaming of delivery status on their devices – enhancing customer experience and loyalty, and adding accountability to the process. The business is reaping the rewards of its investment, with delivery now a large slice of its overall offering. “We have taken significant strides in the past three to four years to change our customers’ online ordering experience, and the last-mile delivery experience to the customers’ homes,” says Gaur.
Launching delivery tracking has also had a dramatic impact on Pizza Hut India’s internal key performance indicators. “The proportion of calls to our call center that are following up on an order, as opposed to placing an order, has fallen dramatically,” says Gaur.
Advanced analytics
Further, Pizza Hut India is running advanced analysis of data in the BigQuery data warehouse, enabling the business to determine which restaurants are doing well, which deliveries may be delayed, and what locations are most promising to open a new store. These insights enable the business to boost productivity, expand effectively, and operate more efficiently.
The business can now onboard new stores to delivery in half a day, rather than the month required previously. “The process enabled by Google Cloud and MediaAgility is also delivering significant operational cost savings as well as helping us open and grow new stores quickly,” says Agarwal.
“MediaAgility acted as our development partner across the project, helping us deploy everything from zones to rider tracking,” he says. “It’s been with us from the strategy discussion through the implementation and stabilization phases.”
Chatbot in development
MediaAgility has also helped Pizza Hut India create a chatbot using the Dialogflow development suite for creating conversational interfaces. “This project is about giving millennials and other customers one more channel to reach out and connect to the brand,” explains Agarwal.
Pizza Hut India is now ideally placed to continue growing and position itself as a brand of choice for tech-savvy consumers. “We’re extremely pleased with the contribution of all the parties involved in this project and look forward to continue transforming our business to meet the demands of the digital age,” says Agarwal.
While Gaur acknowledges it is difficult to predict change over the next two to five years, he believes delivery is likely to become more prominent in Pizza Hut India’s combination of offerings. “When we began our online journey in 2016, we predicted delivery would be about 25 percent of the mix by 2020,” he says. “With Google and MediaAgility, I think it will keep growing.”
Ease Your Migration and Modernization Journey with Microsoft and Windows on Google Cloud Demo Center
8301
Of your peers have already read this article.
2:00 Minutes
The most insightful time you'll spend today!
If you’re looking to migrate and modernize your Microsoft and Windows workloads, Google Cloud is your premiere destination. No matter what migration strategy you’ve selected or what value you’re looking to achieve, with Google Cloud you’re able to:
- simplify your migration and modernization journey
- reduce your on-prem footprint and increase agility
- optimize license usage to reduce costs
- modernize to reduce single-vendor dependencies
- rely on enterprise-class support backed by Microsoft
Whether you’re looking to migrate applications running on Windows virtual machines, adopt Windows containers in Google Kubernetes Engine (GKE), convert SQL databases to Cloud SQL, or something else, Google Cloud offers you the first-class experience you need.
But we don’t want you to take our word for it. Try it out yourself with our new online Microsoft and Windows on Google Cloud Demo Center without any commitment or friction.
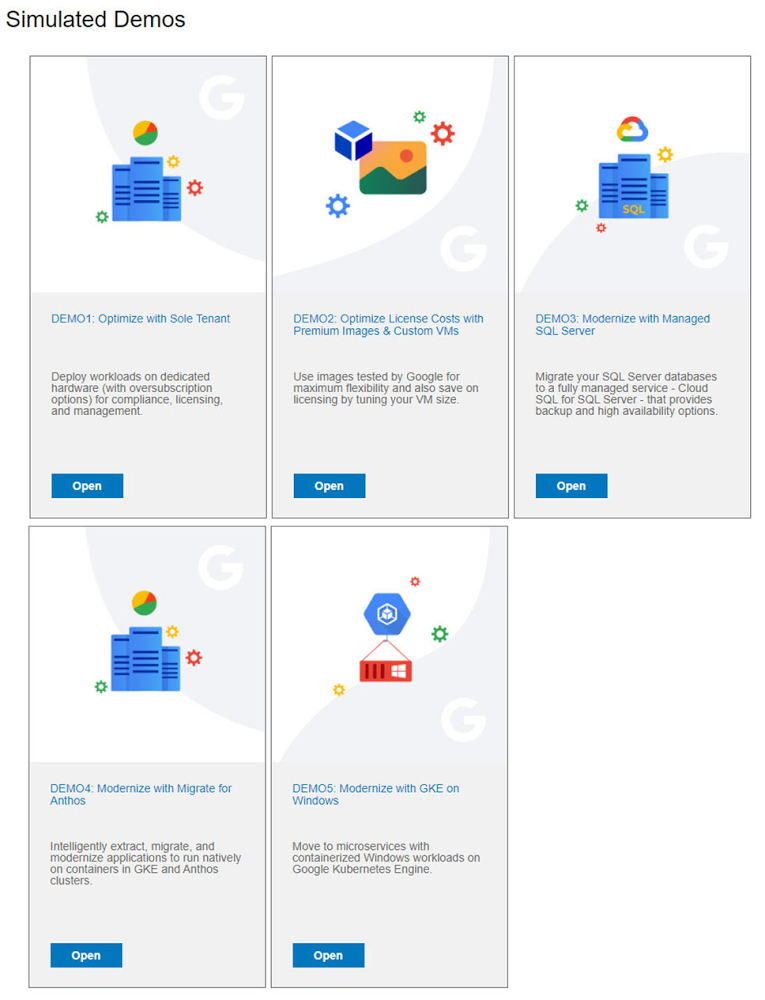
The demo center uses hands-on guided simulations to walk you through several scenarios for solving business critical challenges with Google Cloud’s Microsoft and Windows solutions. Because these are all simulated, you’ll see how it works without any deployment, configuration, or commitment. It’s a seamless way for you to see exactly how Google Cloud can help you.
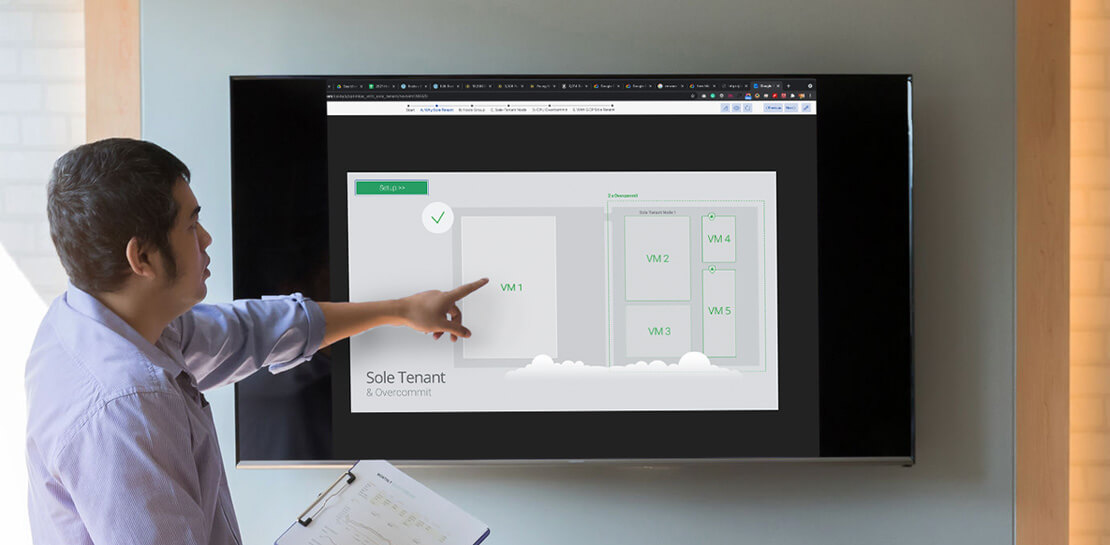
Run dedicated hardware and optimize with sole tenant
Sometimes you might want to run your workloads on dedicated hardware (with oversubscription options) for compliance, licensing, and management. Google Cloud provides sole-tenant nodes that allow you to easily deploy your virtual machines onto dedicated machines to avoid “noisy neighbor” issues, address regulatory or licensing constraints, and optimize inter-VM communications.
Plus, the CPU Overcommit option allows oversubscribing sole-tenant node resources by up to 2x, therefore helping save on per-physical core licensing for many licensed workloads like SQL Server.
Learn how to set up a sole tenant group and node.
Optimize license costs with premium images & custom VMs
One of the easiest ways to optimize your cloud experience with virtual machines (VM) is to pick the right VM image. Google Cloud provides premium license-included VM images that are thoroughly tested and optimized, including SQL Server options with pay-as-you-go licensing. These are great for workloads that don’t need to run all the time or when you do not have spare licenses for bring your own license (BYOL).
Explore some Windows & SQL images and learn how CPU/Memory options can help optimize deployment and save on licensing.
Modernize your databases with Managed SQL Server
Sometimes you need to manage your SQL Server instance to achieve certain business or operational goals. But more often, managing SQL Server deployments can be undifferentiated: backups, high-availability, updates, and patching are just some of the many things you have to take care of when going the do-it-yourself route. One way to modernize your database tier is to migrate to a managed service like Cloud SQL, which is a fully managed Relational Database service for SQL.
Explore the process of creating an instance in just a few clicks!
Extract apps from VMs and move to containers in GKE with Migrate for Anthos
Many Windows workloads running on virtual machines such as Internet Information Services (IIS) are ideal candidates for migrating to containers without major changes like rewriting or rearchitecting. However, doing this migration manually can be tedious, which is why Migrate for Anthos can help easily re-platform a .NET app running on IIS into a container-based app.
Simulate intelligently extracting, migrating, and modernizing applications to run natively on containers in GKE and Anthos clusters.
Move .NET applications to GKE on Windows without code changes
When you’re looking to go fully cloud native, you can leverage Windows containers in GKE without rewriting your .NET applications. Simply create clusters with Windows nodes and deploy containerized Windows workloads in a few clicks, even alongside Linux containers. These deployments reduce operational overhead with features such as auto-upgrade, auto-repair, and release channels.
Learn how easy it is to build a GKE cluster with a Windows node and deploy an app.
Now that you’ve gotten a feel for what’s available, go check out the Demo Center. You can also visit us at Windows and Microsoft on Google Cloud to learn more.

3699
Of your peers have already downloaded this article
2:30 Minutes
The most insightful time you'll spend today!
In today’s connected digital world, people expect their various applications to work together seamlessly. The key to making this happen is APIs. A robust library of APIs allows developers to connect applications and deliver new services quickly and easily. But to get the most out of APIs, companies need an API management platform that will deliver manageability and security.
However, as the Citrix team looked to quickly expand its API library, it realized that the company needed a leading API platform. “We researched every API platform and the clear leader was Apigee Edge,” says Adam Brancato, Senior Manager of Customer Applications at Citrix. “With Apigee Edge, we expanded our API support from 10 APIs to more than 50 APIs in a year.”
As a result, Citrix now supports a wide range of APIs for both internal and external use, including email, support cases, single sign- on, licensing, accounts, assets management, contacts, Salesforce integration, order validation, and more.
Download this case study to understand how the Citrix team leveraged Apigee to save time and boost productivity.
3 Ways To Reduce App Downtime With Google Cloud’s API Monitoring Tools

3084
Of your peers have already read this article.
2:30 Minutes
The most insightful time you'll spend today!
How many times have you closed an application when you encounter the “spinning wheel of death” (a melodramatic way of saying an application that is taking too long to load)? In today’s digital economy where many organizations rely on applications as a primary source of revenue, that spinning wheel of death (or poor application performance) can mean lost users or revenue. And just about every modern application relies on APIs as the nervous system across distributed systems, third-party services and microservice architectures. While meeting the need for rapid release cycles and frequent API updates, it is also imperative for IT teams to ensure that your APIs are meeting SLOs, performance requirements, and proactively mitigating issues.
Why are synthetic monitoring tools not enough?
When thousands or even millions of users are making multiple requests to your APIs, just relying on synthetic monitoring tools (that rely on sampling or limited API availability information) is not enough for precision diagnoses or useful forensics. At the same time, monitoring every single aspect just increases your overhead and mean time to diagnosis. Apropos, API monitoring has become absolutely critical — and a fusion of art and science — for operations teams to make sure all APIs are running and performing as intended. If you are worried about monitoring blind spots or overheads, let us look at 3 key practices you can follow to stop dreading your sev1 alerts.
#1 Prioritize alerts for critical events requiring immediate investigation
- Ask any engineer on-call for a critical service and they will tell you about the overheads created by incorrectly prioritized alerts. For example let us imagine a distributed application with 20 APIs. Even if you set up basic alert monitors across latency, error, and traffic for these APIs, you end up monitoring and maintaining 60 alert definitions – which is a lot. To balance avoiding monitoring blindspots and alert fatigue at the same time, operations teams must develop a clear understanding of all events and prioritize configuring alerts for events supporting critical traffic.
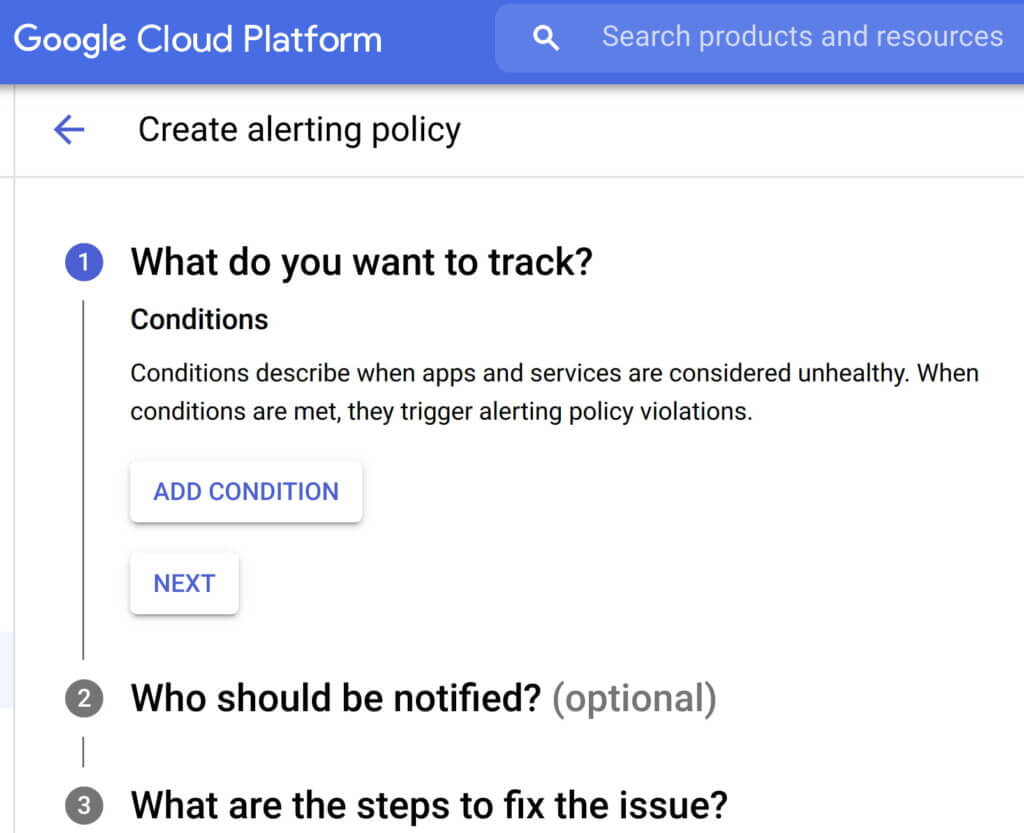
- Consider quality over quantity while defining new alert conditions where each new condition is urgent, actionable, and actively or imminently user-visible. Every alert condition created should also contain intelligence that requires active engagement from a user as opposed to a mere robotic response. Apigee’s API monitoring allows creation of alert conditions based on metrics or logs while providing actionable information (Ex: status code, rate etc.,) and playbooks for diagnosi
- In today’s multilayered systems, one team’s symptom (“what’s broken?”) is another downstream system’s cause (“Why?”). Even if some events are not suitable for actionable alerts, a failure needs to create an informational broadcast to a downstream system to mitigate the impact of the upstream dependency. In such cases, investing in automating alerts, grouping multiple incidents in notification channels, and incident tracking. For example, Apigee lets you integrate and group your alert notifications in channels like Slack, Pagerduty, webhooks etc.,
- Modern production systems are ever-evolving where an alert that’s currently rare might become frequent and automatable. Analogous to ticket backlog grooming, alert policies need to be reviewed periodically to make sure new conditions are identified and existing alerts are refined with new thresholds, prioritization and correlation. Controls like Advanced API Ops leverage AI and ML to detect anomalous traffic differentiated from random fluctuations to help define accurate alert definitions
Check out some examples of alerts here
#2 Isolate problem areas quickly with dashboards
Google’s Site Reliability Engineering book presents the case for efficient diagnosis by building dashboards that answer basic questions about every service, normally including some form of the four golden signals — latency, traffic, errors and saturation. But at the same time, capturing just these golden metrics at different levels of granularity can quickly add up. Like all software systems, monitoring can become an endless pit of complexity, complicated to change and a burden to maintain. In the same book, the most effective direction to create a well-functioning standalone system is to collect and aggregate basic metrics, paired with alerting and dashboards.
If you are running a large scale API program with a dedicated team to monitor your APIs, you can leverage the out-of-the-box monitoring dashboards in your API Management solution (like Apigee’s API monitoring) to gather real-time insights into your API performance, availability, latency, and errors. In other cases, you can use solutions like Cloud Monitoring that can provide visibility across your full application stack where individual metrics, events, and metadata can be visualized in a rich query language for rapid analysis. Leveraging a single system for your application stack provides observability in context and can reduce your time spent navigating between systems (Apigee customers can use Cloud Monitoring by default or integrate with other systems using Cloud Monitoring API)
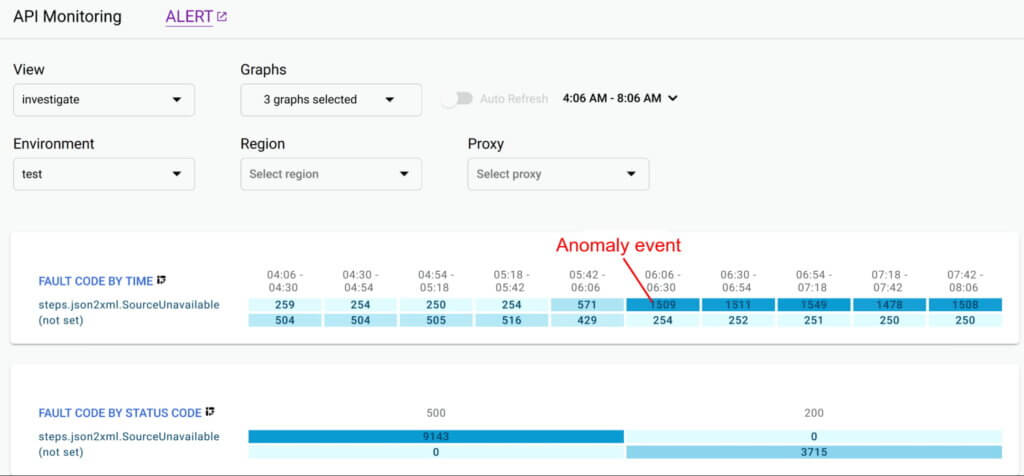
Even after you collect and aggregate the metrics, it is important to have impactful data visualizations to quickly understand the issue and identify correlations during diagnosis. In data visualizations as well, focusing on too many dashboards creates a steep learning curve and increases mean time for every diagnosis. For example, Apigee API Monitoring provides the following visualizations as a standard to balance simplicity and efficiency:
- Timeline view to diagnose traffic (in 1 min intervals), error rates (4xx and 5xx across traffic) and latencies (50th, 90th, 95th and 99th percentiles)
- Pivot tables of metrics and attributes for all API traffic, to help compare activity across different metrics
- Treemaps of recent API traffic by proxy to get a snapshot of incidents, error rates and latencies
#3 Incorporate distributed tracing into your end to end observability strategy
Modern application development accelerated the adoption of technologies and practices like cloud, containers, APIs, microservice architectures, DevOps, SRE etc. While this increases release velocity, it also introduces complexity and more points of failure in an application stack. For example, a slow response to a customer request spans across multiple micro services owned (and monitored) by various teams who might not observe any individual performance issues. Without an end-to-end contextual view of a request, it is nearly impossible to isolate the point of high latency.
In such cases, distributed tracing is the best way for DevOps, Operations and SREs to get answers to questions such as service health, root cause of defects, or performance bottlenecks in a distributed system. Organizations should invest in instrumenting their distributed applications using open source standards such as OpenCensus and Zipkin. Using tools like Cloud Trace with a broad platform, language and environment support can help easily ingest data from any source — open instrumentation or proprietary agents.
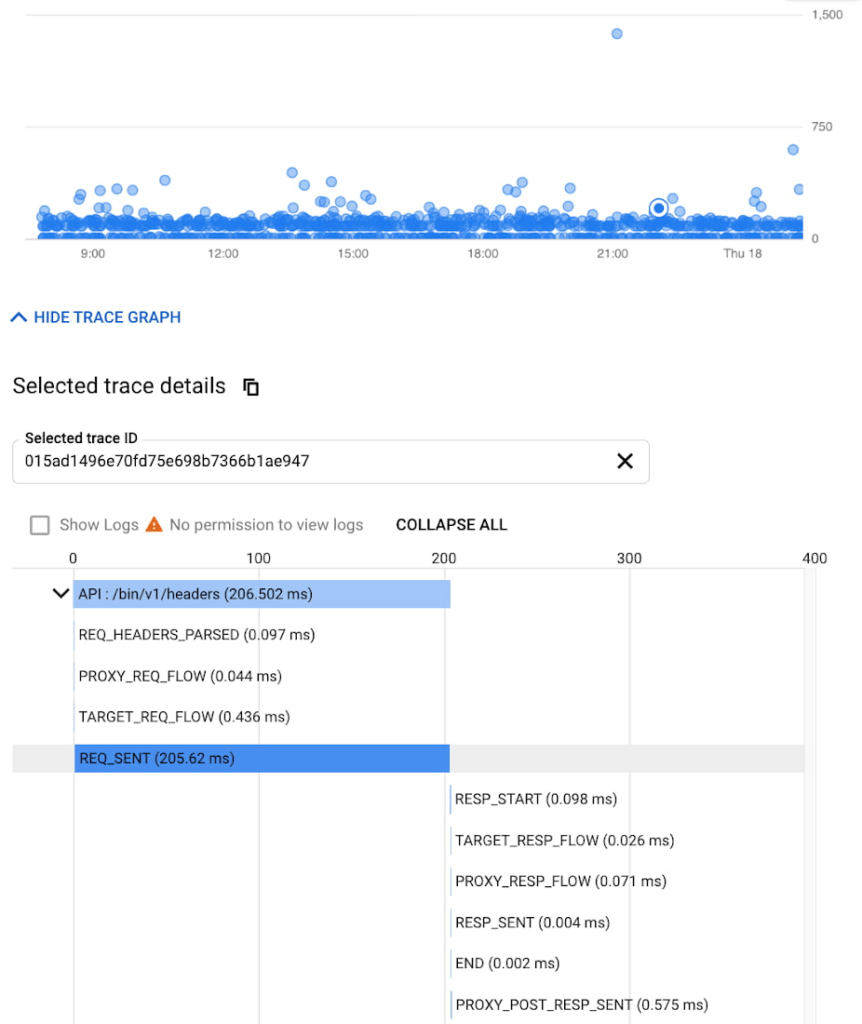
While distributed tracing helps in narrowing the issue to a given service, in some cases you might need further context to pinpoint the root cause. For example: Even if you have isolated the source of a performance issue to an API proxy, it is still a tedious process to identify the right bottleneck among multiple policies being executed. Tools like Apigee Debug enable you to zoom into an API proxy flow and probe the details of each step to see internal details like policy executions, performance issues, and routing etc.,
As soon as a request starts to span across a handful of microservices, tools like distributed tracing and Debug will become crucial elements of your monitoring strategy. When every service in a distributed system emits a trace, the amount of data can quickly become overwhelming leading to the classic “needle in the haystack” problem. In such scenarios, it becomes vital to ask the right questions and choose between head-based sampling (randomly selecting which traces will be sampled for analysis) and tail-based sampling (observe all trace information and sample the traces with unusual latency or errors) based on application complexity
Implement effective API monitoring in Apigee
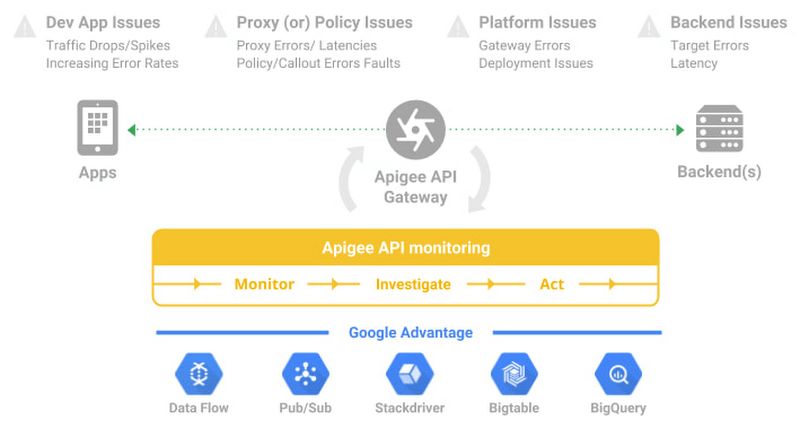
Apigee’s API monitoring (based on metrics exposed by the internals of the system) capabilities work with your existing monitoring infrastructure to help reduce mean time to diagnosis and increase application resiliency. Specifically, operations teams can leverage
- Monitoring dashboards to gain in-depth insights into API availability and performance metrics.
- Debug to precisely diagnose with deeper insights into an API proxy flow without toggling multiple tools.
- Alerts and notifications to gather contextual Insights, facilitate customization, and grouping with first class integrations to various tools (like Slack, PagerDuty, email and support for webhooks).
- Best of Google technologies such as Data Flow, Pub/Sub, Stackdriver, Bigtable and BigQuery to handle massive volumes and complex metrics at scale
Using Apigee’s API monitoring will help you maintain high application resiliency with comprehensive controls to reduce mean time to diagnosis and resolution. Get started with Apigee today or explore Apigee’s API monitoring for free here. Check out our documentation for additional information on API monitoring.
3243
Of your peers have already watched this video.
1:30 Minutes
The most insightful time you'll spend today!
How to Become a Hero by Metering and Understanding Your Utilization on GKE
It’s hard to believe that GKE is already celebrating its fifth birthday. Over these last five years it’s been inspiring to see what businesses have accomplished with Google Cloud and GKE—from powering multi-million QPS retail services, to helping a game publisher deploy 1700 times to production in the week of its launch, to accelerating research into discovery of treatments for both rare and common conditions in cardiology and immunology, to helping map the human brain. These were all made possible by Kubernetes.
The benefits of containers and Kubernetes over traditional on-premises architectures are well-documented and understood. This video introduces the concept of cost or efficiency control with GKE autoscaling. Together with our customer and design partner OpenX, we show the story of tuning and controlling infrastructure utilization while balancing cost through use of the GKE autoscalers.
More Relevant Stories for Your Company

Vodafone Turns to Google Maps Platform to Expand and Improve its Network
Vodafone India had a manual, labor-intensive process for determining network capabilities and reach. The company sent field operatives to every customer location to conduct a feasibility study. These feasibility studies help Vodafone determine whether they can provide connectivity and services to customers based on the infrastructure at that location. Everyone


Reduce Costs, Increase Profits by Modernizing Your Mainframe Applications with Google Cloud
Mainframe powers much of global commerce and for decades—with its proprietary platform and legendary lock-in—was resistant to effective competition. Even years after most organizations began adopting public cloud, migrating off the mainframe remains too complex for many organizations to undertake. Google Cloud brings a unique, automated approach to modernization enabling

Latest News: Secure Digital Infrastructure Services with Apigee Advanced API Security for Google Cloud
Organizations in every region and industry are developing APIs to enable easier and more standardized delivery of services and data for digital experiences. This increasing shift to digital experiences has grown API usage and traffic volumes. However, as malicious API attacks also have grown, API security has become an important

Lower risk, greater return: Public sector organizations are focusing on multicloud adoption
Government organizations are starting to realize that no single cloud can meet their wide range of needs. According to the Nutanix 2022 Enterprise Cloud Index1, 75% of public sector organizations agree that multicloud is ideal, and more public sector organizations than average have adopted multicloud as a primary IT operating
