





7473
Of your peers have already watched this video.
1:15 Minutes
The most insightful time you'll spend today!
An Indian Example of How to Really Up Your Customer Experience Game and Increase Conversion Rates With AI
How about selfie analysis of users to recommend them the right lipstick color?
That’s just one of the many ideas folks at Purplle.com came up with to improve the buying experience of Indian consumers.
And without the power of Google Cloud, it would probably have remained just that…an idea.
But today, thanks to Google Cloud, “Nothing seems impossible,” says Suyash Katyayani, CTO, Purplle.
Purplle.com is an online e-commerce company in India and one of the pioneers in creating a digitally-native beauty brands in India.
“The beauty industry is so data intensive that we needed to have a strong data strategy and we were looking out for solutions which would enable us to have a strong data pipeline and a strong data warehousing solution,” says Katyayani.
That’s when it turned to Google Cloud.
Additionally, Purplle.com, says Katyayani, does not have to worry about at what scale the company operates at because they have access to state-of-the-art infrastructure from Google Cloud available to them so that their developers can run experiments.
“The biggest plus point for us has been the agility that Google Cloud has added,” says Katyayani.
Making Streaming Analytics Simpler and More Cost-Effective With Cloud Dataflow

3888
Of your peers have already read this article.
8:30 Minutes
The most insightful time you'll spend today!
Streaming analytics helps businesses to understand their customers in real time and adjust their offerings and actions to better serve customer needs. It’s an important part of modern data analytics, and can open up possibilities for faster decisions.
For streaming analytics projects to be successful, the tools have to be easy to use, familiar, and cost-effective. Since its launch in 2015, Cloud Dataflow, Google’s fully managed streaming analytics service, has been known for its powerful API available in Java and Python. Businesses have almost unlimited customization capabilities for their streaming pipelines when they use these two languages, but these capabilities come at the cost of needing programming skills that are sometimes hard to find.
To advance Google Cloud’s streaming analytics further, Google Cloud is announcing new features available in the public preview for Cloud Dataflow SQL, as well as the general availability of Cloud Dataflow Flexible Resource Scheduling (FlexRS) for a very cost-effective way of batch processing of events. These new features make streaming analytics easier and more accessible to data engineers, particularly those with database experience.
Here’s more detail about each of these new features:
Cloud Dataflow SQL to create streaming (and batch) pipelines using SQL
We know that SQL is the standard for defining data transformations, and that you want more GUI-based tools for creating pipelines. With that in mind, several months ago we launched a public preview of Cloud Dataflow SQL, an easy way to use SQL queries to develop and run Cloud Dataflow jobs from the BigQuery web UI. Today, we are launching several new features in Cloud Dataflow SQL, including Cloud Storage file support and a visual schema editor.
Cloud Dataflow SQL allows you to join Cloud Pub/Sub streams with BigQuery tables and Cloud Storage files. It also provides several additional features:
- Using Streaming SQL extensions for defining time windows and calculating window-based statistics;
- Integration with Cloud Data Catalog for storing the schema of Cloud Pub/Sub topics and Cloud Storage file sets—a key enabler for using SQL with streaming messages;
- A simple-to-use graphical editor available in the BigQuery web UI. If you are familiar with BigQuery’s SQL editor, you can create Cloud Dataflow SQL jobs.
To switch the BigQuery web UI to Cloud Dataflow SQL editing mode, open the BigQuery web UI, go to More>Query settings and select “Cloud Dataflow” as the query engine.
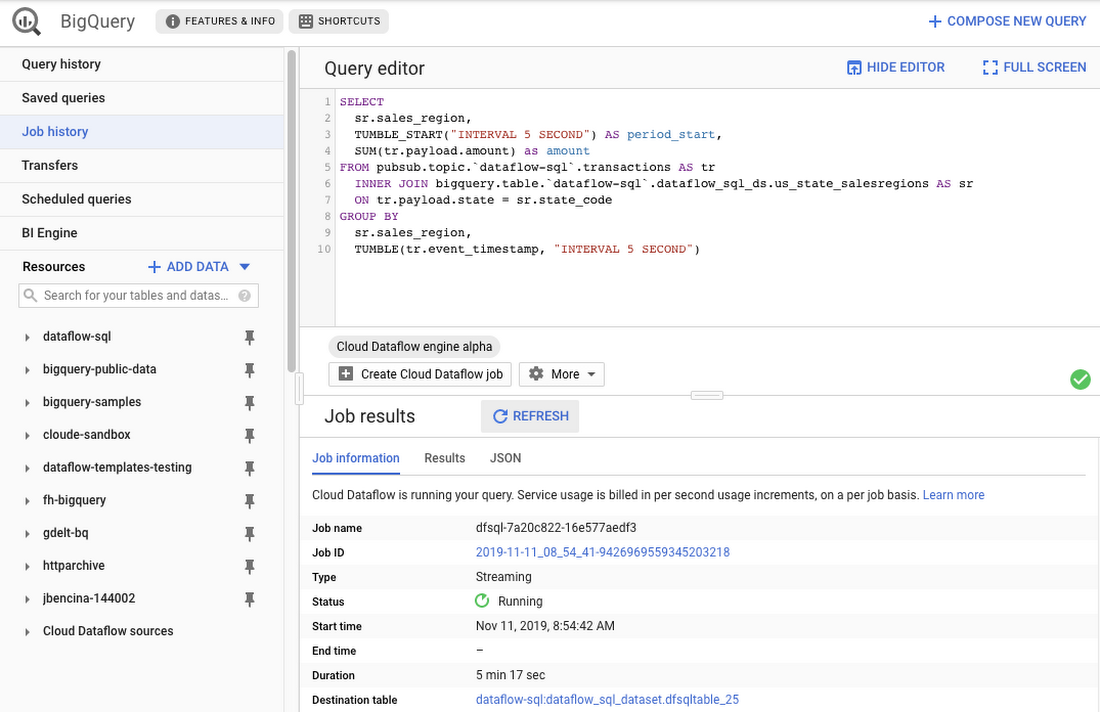
As an example, let’s say you have a Cloud Pub/Sub stream of sales transactions, and you want to build a real-time dashboard for the sales managers of your organization showing them the up-to-date stats of the sales in their regions. You can accomplish this in a few steps: write a SQL statement like the following one, launch a Cloud Dataflow SQL job, direct the output to a BigQuery table, then use one of the many supported dashboarding tools, including Google Sheets, Data Studio, and others, to visualize the results.
SELECTsr.sales_region,TUMBLE_START("INTERVAL 5 SECOND") AS period_start,SUM(tr.payload.amount) as amountFROM pubsub.topic.`dataflow-sql`.transactions AS trINNER JOIN bigquery.table.`dataflow-sql`.dataflow_sql_ds.us_state_salesregions AS srON tr.payload.state = sr.state_codeGROUP BYsr.sales_region,TUMBLE(tr.event_timestamp, "INTERVAL 5 SECOND")
In this example, we are joining the “transactions” Cloud Pub/Sub topic in the “dataflow-sql” project with a metadata table in BigQuery called “us_state_salesregions.” This table contains a mapping between the state codes (present in the “transactions” Cloud Pub/Sub topic) and the sales regions “Region_1”, “Region_2”, .., “Region_N” that are relevant to the sales managers in our example organization. In addition to the join, we’ll do a streaming aggregation of our data, using one of the several windowing functions supported by Cloud Dataflow. In our case, we will use TUMBLE windows, which will divide our stream into fixed five-second time intervals, group all the data in those time windows by the sales_region field, and calculate the sum of sales in the sales region. We also want to preserve the start of each time window, via TUMBLE_START("INTERVAL 5 SECOND"), to plot sales amounts as a time series.
To start a Cloud Dataflow job, click on “Create Cloud Dataflow job” in the BigQuery web UI.
When data starts flowing into the destination table, it will contain three fields: the sales_region, the timestamp of the period start, and the amount of sales.
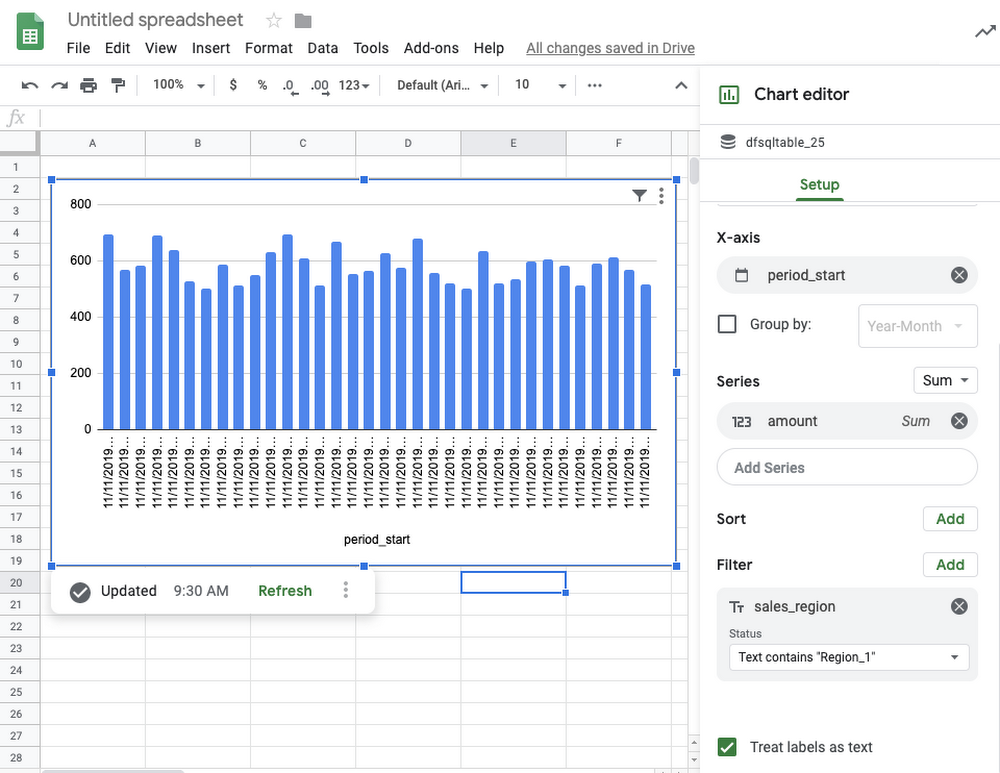
In the next step, we will create a BigQuery Connected Sheet that shows a column chart of sales in “Region_1” over time. Select the destination BigQuery table in the nav tree. In our case, it’s the dfsqltable_25 table.
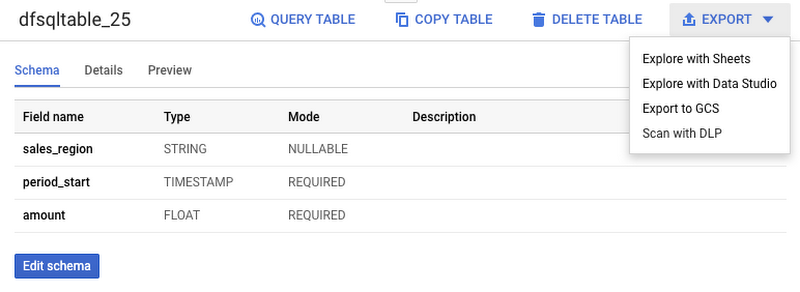
Then, select Export>Explore with Sheets to chart your data. Do it from the tab where your BigQuery table is shown, and not from the tab where your original Cloud Dataflow SQL was. In Sheets, create the column chart using the data connection to BigQuery, and choose period_start for the X-axis, amount as your data series, and add a sales_region filter. This is all you have to do to build a chart in Sheets that visualizes streaming data.
Mixing and joining data in Cloud Pub/Sub and BigQuery helps solve many real-time dashboarding cases, but quite a few customers have also asked for support of their Cloud Storage files to join those files with events in Cloud Pub/Sub or with tables in BigQuery. This is now possible in Dataflow SQL, enabled by our integration with Data Catalog’s Cloud Storage file sets.
In the following example, you’ll see an archive of transactions stored in CSV files in the “transactions_archive” Cloud Storage bucket.
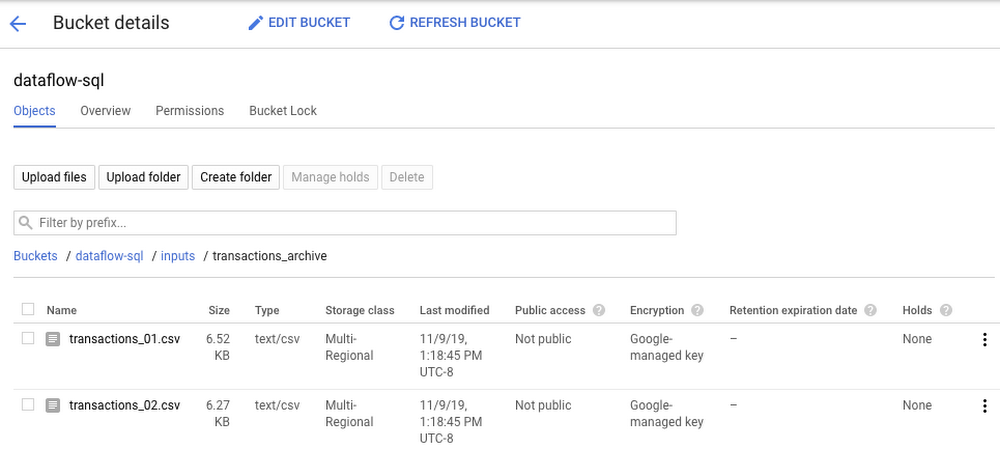
Two gcloud commands can define a Cloud Storage file set and entry group in Data Catalog.
#Create a GCS entrygroupgcloud beta data-catalog entry-groups create transactions_archive_eg --location=us-central1#Create the filesetgcloud beta data-catalog entries create transactions_archive_fs --location=us-central1 --entry-group=transactions_archive_eg --gcs-file-patterns=gs://dataflow-sql/inputs/transactions_archive/*.csv --description="Historical Archive of Transactions"
Notice how we defined the file pattern “gs://dataflow-sql/inputs/transactions_archive/*.csv” as part of the file set entry definition. This pattern is what will allow Cloud Dataflow to find the CSV files once we write the SQL statement that references this file set.
We can even specify the schema of this transactions_archive_fs file set using a GUI editor. For that, go to the BigQuery web UI (make sure it is running in Cloud Dataflow mode), select “Add Data” in the left navigation and choose “Cloud Dataflow sources.” Search for your newly added Cloud Storage file set and add it to your active datasets in the BigQuery UI.
This will allow you to edit the schema of your file set after you select it in the nav tree. The “Edit schema” button is right there on the “Schema” tab. The visual schema editor is new and works for both Cloud Storage file sets as well as for Cloud Pub/Sub topics.
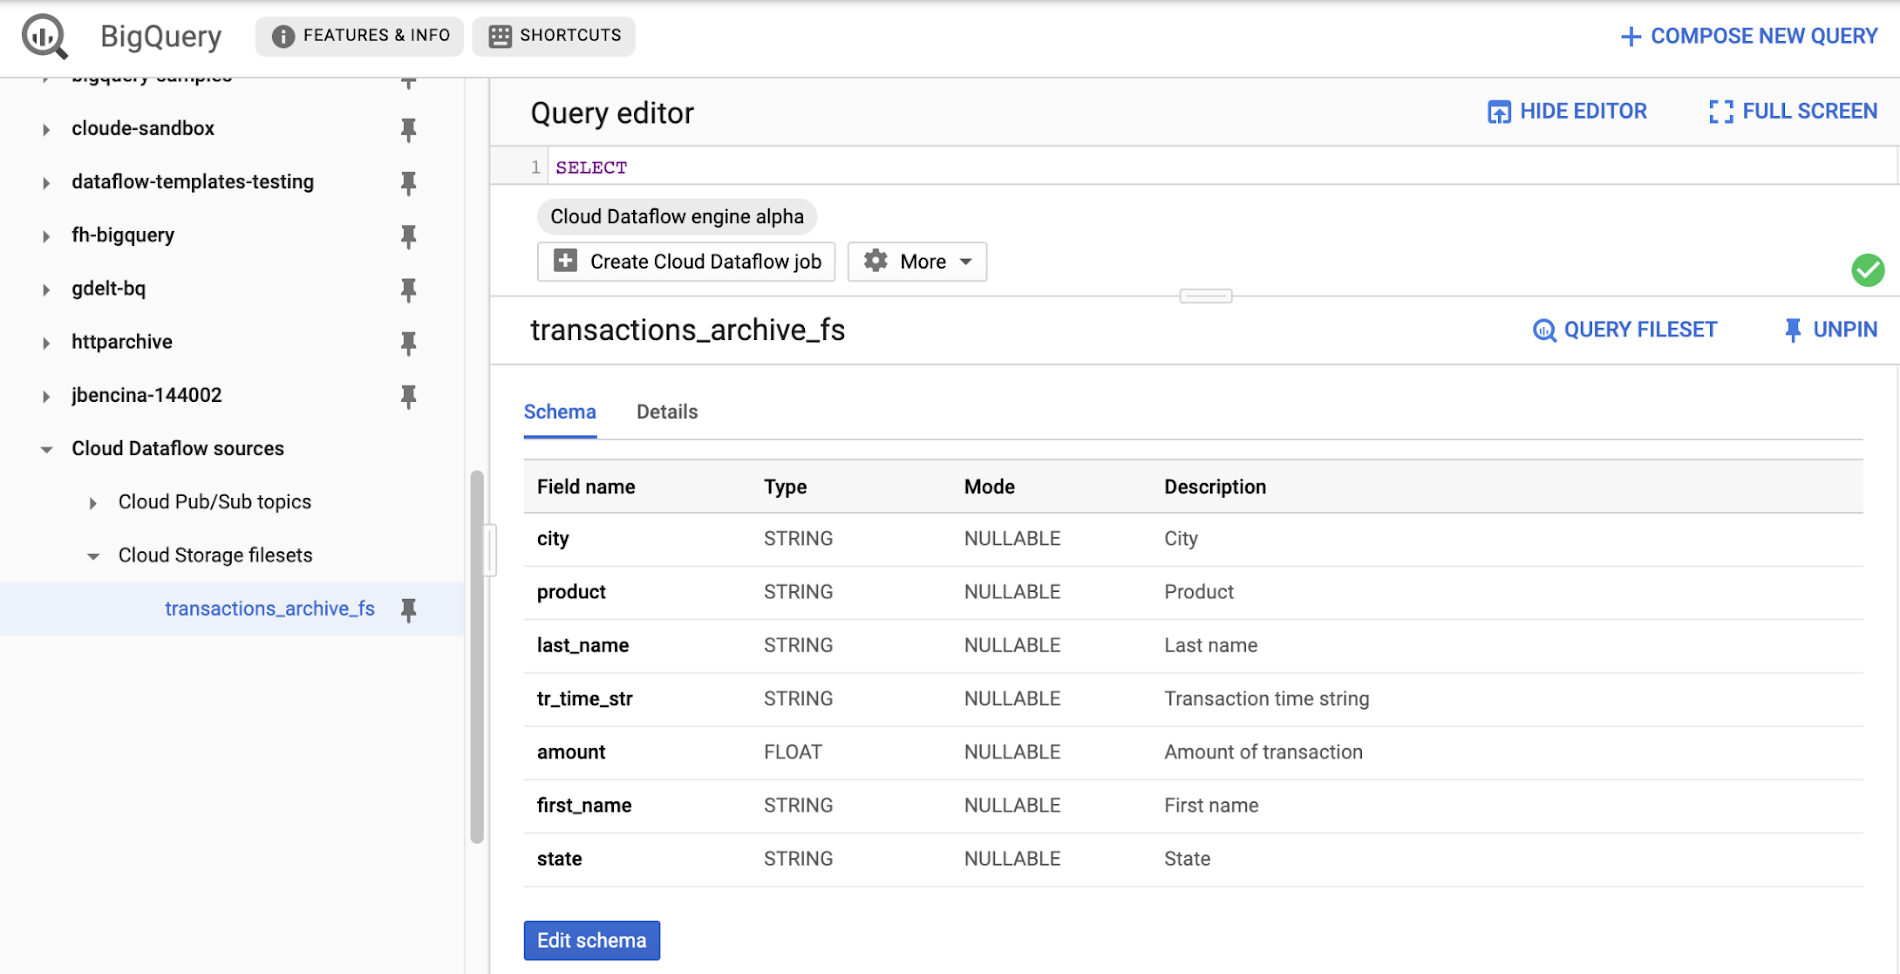
Once you’ve registered the file set in Data Catalog and defined a schema for it, you can query it in Cloud Dataflow SQL. In the next example, we’ll join the transactions archive in Cloud Storage with the metadata mapping table in BigQuery.
SELECTsr.sales_region,TUMBLE_START("INTERVAL 5 SECOND") AS period_start,SUM(tr.amount) as amountFROM datacatalog.entry.`dataflow-sql`.`us-central1`.transactions_archive_eg.transactions_archive_fs AS trINNER JOIN bigquery.table.`dataflow-sql`.dataflow_sql_ds.us_state_salesregions AS srON tr.state = sr.state_codeGROUP BYsr.sales_region,TUMBLE(CAST(tr.tr_time_str AS TIMESTAMP), "INTERVAL 5 SECOND")
Notice how similar this SQL statement is to the one that queries Cloud Pub/Sub. The TUMBLE window function even works on Cloud Storage files, although we will define the windows based on a field “tr_time_str” that is inside the files (the Cloud Pub/Sub SQL statement used the tr.event_timestamp attribute of the Cloud Pub/Sub stream). The only other difference is the reference to the Cloud Storage file set. We accomplish this by specifying datacatalog.entry.`dataflow-sql`.`us-central1`.transactions_archive_eg.transactions_archive_fs AS tr
Because both of the job inputs are bounded (batch) sources, Cloud Dataflow SQL will create a batch job (instead of a streaming job created for the first SQL statement using a Cloud Pub/Sub source) which will join your Cloud Storage files with the BigQuery table, and write the results back to BigQuery.
And now you have both a streaming pipeline feeding your real-time dashboard from a Cloud Pub/Sub topic, as well as a batch pipeline capable of onboarding historical data from CSV files. Check out the SQL Pipelines tutorial to start applying your SQL skills for developing streaming (and batch) Cloud Dataflow pipelines.
FlexRS for cost-effective batch processing of events
While real-time streaming processing is an exciting use case that’s growing rapidly, many streaming practitioners know that every stream processing system needs a sprinkle of batch processing (as you saw in the SQL example). When you bootstrap a streaming pipeline, you usually need to onboard historical data, and this data tends to reside in files stored in Cloud Storage. When streaming events need to be reprocessed due to changes in business logic (i.e., time windows get readjusted, or new fields are added), this reprocessing is also better done in batch mode.
The Apache Beam SDK and the Cloud Dataflow managed service are well-known in the industry for their unified API approach to batch and streaming analytics. The same Cloud Dataflow code can run in either mode with just minimal changes (usually replacing the data source from Cloud Pub/Sub to Cloud Storage). Remember our SQL example, where switching the SQL statement from a streaming source to a batch source was no trouble at all? And while it’s easy to go back and forth between streaming and batch processing in Cloud Dataflow, an important factor influencing the processing choice is cost. Customers who gravitate to batch processing have always looked to find the right balance between the speed of execution and costs. In many cases, that may mean you can be flexible with the amount of time it takes to process a dataset if the overall cost of processing is reduced in a significant fashion.
Our new Cloud Dataflow FlexRS feature reduces batch processing costs by up to 40% using advanced resource scheduling techniques and a mix of different virtual machine (VM) types (including the preemptible VM instances) to decrease processing costs while providing the same job completion guarantees as regular Cloud Dataflow jobs. FlexRS uses the Cloud Dataflow Shuffle service, which allows it to handle the preemption of worker VMs better because the Cloud Dataflow service does not have to redistribute unprocessed data to the remaining workers.
Using FlexRS requires no code changes in your pipeline and can be accomplished by simply specifying the following pipeline parameter:
--flexRSGoal=COST_OPTIMIZED
Running Cloud Dataflow jobs with FlexRS requires autoscaling, a regional endpoint in the intended region, and specific machine types, so you should review the recommendations for other pipeline settings. While Cloud Dataflow SQL does not yet support FlexRS, it will in the future.
Simultaneously with launching FlexRS in general availability, we are also extending its availability to five additional regions, covering all regions now where we have regional endpoints and Cloud Dataflow Shuffle:
- us-central1
- us-east1
- us-west1
- europe-west1
- europe-west4
- asia-east1
- asia-northeast1
To learn more about Cloud Dataflow SQL, check out our tutorial and try creating your SQL pipeline using the BigQuery web UI. Visit our documentation site for additional FlexRS usage and pricing information.
Check out other recently launched streaming and batch processing features:
- We deployed Cloud Dataflow Shuffle and Cloud Dataflow Streaming Engine to three additional regions, bringing total availability to seven regions.
- We launched the ability to protect your pipeline state with customer-managed encryption keys.
Python streaming support from Cloud Dataflow is now generally available.
Google Cloud’s Virtual Appointment Scheduling Tool (VAST) Helps State of Arizona Recover from Unemployment Situation

6552
Of your peers have already read this article.
2:00 Minutes
The most insightful time you'll spend today!
When the world was forced to go primarily online, state governments also faced the reality of needing to provide community services without the health risk of meeting in person. Old systems that relied on interpersonal contact could not keep up. An unprecedented number of displaced workers swamped every unemployment system. The capacity challenges weren’t limited to state labor departments either. Everything from birth certificates and marriage licenses to apostilles and court system services that could usually be handled by a simple walk-in had to be scheduled in advance. Both internal and external communication suffered.
To meet these challenges, many organizations turned to new technology solutions and innovative approaches.
How VAST helped Arizona get back to work
The State of Arizona had tens of thousands of constituents who relied on pandemic unemployment insurance and would also need tools to reenter the workforce.Tim Tucker, Deputy Administrator of the Workforce Development Administration for the Arizona Department of Economic Security, started preparing in late 2020. He collaborated with Google Cloud and SADA to introduce the Virtual Appointment Scheduling Tool (VAST) to State of Arizona staff members. Using VAST reduced the excessive workload taken on by the Workforce Development Administration as they got Arizona back to work. VAST lets constituents book an appointment, upload documents and forms, and conduct career counseling virtually. This helped constituents move through the system faster so they could successfully reenter the workforce.
That preparation paid off. As of September 2021, Arizona had recovered the majority of the jobs lost during the pandemic. It has also seen one of the smallest percent change in employment compared with pre-pandemic numbers. Even more impressive, Arizona is one of only five states where unemployment claims are now lower than pre-pandemic numbers. Using VAST helped them get people back to work faster and has become a permanent part of their unemployment program.
Bringing streamlined services to the community
To fully realize a solution to the challenges faced by our public sector customers, we focused on three key areas in which we knew we needed VAST to excel:
- Efficient staff allocation
- Streamlined internal meetings
- Confident constituent interactions
We also knew our customers needed to get VAST online fast, and it needed to work with existing infrastructure without requiring a total overhaul. These areas informed the design of VAST’s features and have allowed us to meet the challenges faced by agencies such as the Arizona Department of Economic Security.
Virtual Agent support and integrations
VAST gives constituents 24×7 virtual agent support powered by Google Cloud’s contact center AI virtual agents. Virtual agents are custom programmed to fit the specific needs of each agency and community they serve. It’s easy to add new options and information whenever an update is needed. Virtual agents can be designed to understand the user’s intent and serve up relevant content for a smooth user experience on both ends of the system. Virtual agents run at scale and offer multi-language support, ensuring they can serve everyone in the community. By pairing these with VAST, constituents can experience seamless self-service.
6 week deployment time
Most of our public sector clients needed a solution yesterday. VAST can be deployed rapidly, taking about six weeks from start to finish, which includes everything–even staff training time.
Integration with Google Workspace and Chrome
VAST securely integrates with other Google solutions, such as Google Workspace and Chromebooks. We work to ensure VAST is fully functional within your existing systems.
Collaboration and support
SADA collaborates with each organization to ensure that the design, development, and functionality of VAST align with their needs. SADA specializes in helping public sector customers migrate to Google Cloud.
Analytics
Application administrators have access to analytic data gathered by VAST and options to customize and add additional datasets.This data helps organizations find blind spots in coverage, fix service bottlenecks, and better organize internal resources. Leveraging this data gives organizations the power to make changes, resulting in everything from a smoother customer experience to cost savings.
To learn more about how Google Cloud has supported Arizona during the pandemic, check out this blog on how their vaccination distribution system leveraged Google Cloud to get the vaccine to more people. For more information on how VAST can streamline a customer experience.
Four Key Takeaways from Google and Quantum Metric’s Back-to-School Retail Benchmark Study

4785
Of your peers have already read this article.
2:00 Minutes
The most insightful time you'll spend today!
Is it September yet? Hardly! School is barely out for the summer. But according to Google and Quantum Metric research, the back-to-school and off-to-college shopping season – which in the U.S. is second only to the holidays in terms of purchasing volume1 – has already begun. For retailers, that means planning for this peak season has kicked off as well.
We’d like to share four key trends that emerged from Google research and Quantum Metric’s Back-to-School Retail Benchmarks study of U.S. retail data, explore the reasons behind them, and outline the key takeaways.
- Out-of-stock and inflation concerns are changing the way consumers shop. Back-to-school shoppers are starting earlier every year, with 41% beginning even before school is out – even more so when buying for college1. Why? The behavior is driven in large part by consumers’ concerns that they won’t be able to get what they need if they wait too long. 29% of shoppers start looking a full month before they need something1.
Back-to-school purchasing volume is quite high, with the majority spending up to $500 and 21% spending more than $1,0001. In fact, looking at year-over-year data, we see that average cart values have not only doubled since November 2021, but increased since the holidays1. And keep in mind that back-to-school spending is a key indicator leading into the holiday season.
That said, as people are reacting to inflation, they are comparing prices, hunting for bargains, and generally taking more time to plan. This is borne out by the fact that 76% of online shoppers are adding items to their carts and waiting to see if they go on sale before making the purchase1. And, to help stay on budget and reduce shipping costs, 74% plan to make multiple purchases in one checkout1. That carries over to in-store shopping, when consumers are buying more in one visit to reduce trips and save on gas.
2. The omnichannel theme continues. Consumers continue to use multiple channels in their shopping experience. As the pandemic has abated, some 82% expect that their back-to-school buying will be in-store, and 60% plan to purchase online. But in any case, 45% of consumers report that they will use both channels; more than 50% research online first before ever setting foot in a store2. Some use as many as five channels, including video and social media, and these 54% of consumers spend 1.5 times more compared to those who use only two channels4.
And mobile is a big part of the journey. Shoppers are using their phones to make purchases, especially for deadline-driven, last-minute needs, and often check prices on other retailers’ websites while shopping in-store. Anecdotally, mobile is a big part of how we ourselves shop with our children, who like to swipe on the phone through different options for colors and styles. We use our desktops when shopping on our own, especially for items that require research and represent a larger investment – and our study shows that’s quite common.
3. Consumers are making frequent use of wish lists. One trend we have observed is a higher abandonment rate, especially for apparel and general home and school supplies, compared to bigger-ticket items that require more research. But that can be attributed in part to the increasing use of wish lists. Online shoppers are picking a few things that look appealing or items on sale, saving them in wish lists, and then choosing just a few to purchase. Our research shows that 39% of consumers build one or two wish lists per month, while 28% said they build one or two each week, often using their lists to help with budgeting1.
4. Frustration rates have dropped significantly. Abandonment rates aside, shopper annoyance rates are down by 41%, year over year1. This is despite out-of-stock concerns and higher prices. But one key finding showed that both cart abandonment and “rage clicks” are more frequent on desktops, possibly because people investing time on search also have more time to complain to customer service.
And frustration does still exist. Some $300 billion is lost each year in the U.S. from bad search experiences5. Data collected internationally shows that 80% of consumers view a brand differently after experiencing search difficulties, and 97% favor websites where they can quickly find what they are looking for5.
Lessons to Learn
What are the key takeaways for retailers? In general, consider the sources of customer pain points and find ways to erase friction. Improve search and personalization. And focus on improving the customer experience and building loyalty. Specifically:
80% of shoppers want personalization6. Think about how you can drive personalized promotions or experiences that will drive higher engagement with your brand.
46% of consumers want more time to research1. Drive toward providing more robust research and product information points, like comparison charts, images, and specific product details.
43% of consumers want a discount1, but given current economic trends, retailers may not be offering discounts. In order to appease budget-conscious shoppers, retailers can consider other retention strategies such as driving loyalty using points, rewards, or faster-shipping perks.
Be sure to keep returns as simple as possible so consumers feel confident when making a purchase, and reduce possible friction points if a consumer decides to make a return. 43% of shoppers return at least a quarter of the products they buy and do not want to pay for shipping or jump through hoops1.
How We Can Help
Google-sponsored research shows that price, deals, and promotions are important to 68% of back-to-school shoppers.7 In addition, shoppers want certainty that they will get what they want. Google Cloud can make it easier for retailers to enable customers to find the right products with discovery solutions. These solutions provide Google-quality search and recommendations on a retailer’s own digital properties, helping to increase conversions and reduce search abandonment. In addition, Quantum Metric solutions, available on the Google Cloud Marketplace, are built with BigQuery, which helps retailers consolidate and unlock the power of their raw data to identify areas of friction and deliver improved digital shopping experiences.
We invite you to watch the Total Retail webinar “4 ways retailers can get ready for back-to-school, off-to college” on demand and to view the full Back-to-School Retail Benchmarks report from Quantum Metric.
Sources:
1. Back-to-School Retail Benchmarks report from Quantum Metric
2. Google/Ipsos,Moments 2021, Jun 2021, Online survey, US, n=335 Back to School shoppers
3. Google/Ipsos, Moments 2021, Jun 2021, Online survey, US, n=2,006 American general population 18+
4. Google/Ipsos, Holiday Shopping Study, Oct 2021 – Jan 2022, Online survey, US, n=7,253, Americans 18+ who conducted holiday shopping activities in past two days
5. Google Cloud Blog, Nov 2021, “Research: Search abandonment has a lasting impact on brand loyalty”
6. McKinsey & Company, “Personalizing the customer experience: Driving differentiation in retail”
7. Think with Google, July 2021, “What to expect from shoppers this back-to-school season”

3856
Of your peers have already listened to this podcast
25:30 Minutes
The most insightful time you'll spend today!
Cloud Dataprep: The Easiest Way to Cleanse Data
How about selfie analysis of users to recommend them the right lipstick color?
That’s just one of the many ideas folks at Purplle.com came up with to improve the buying experience of Indian consumers.
And without the power of Google Cloud, it would probably have remained just that…an idea.
But today, thanks to Google Cloud, “Nothing seems impossible,” says Suyash Katyayani, CTO, Purplle.
Purplle.com is an online e-commerce company in India and one of the pioneers in creating a digitally-native beauty brands in India.
“The beauty industry is so data intensive that we needed to have a strong data strategy and we were looking out for solutions which would enable us to have a strong data pipeline and a strong data warehousing solution,” says Katyayani.
That’s when it turned to Google Cloud.
Additionally, Purplle.com, says Katyayani, does not have to worry about at what scale the company operates at because they have access to state-of-the-art infrastructure from Google Cloud available to them so that their developers can run experiments.
“The biggest plus point for us has been the agility that Google Cloud has added,” says Katyayani.
How OnlineSales.ai and Google Cloud Helped TATA 1mg Increase Ad Revenue by 700%

1378
Of your peers have already read this article.
3:30 Minutes
The most insightful time you'll spend today!
Editor’s note: We invited partners from across our retail ecosystem to share stories, best practices, and tips and tricks on how they are helping retailers transform during a time that continues to see tremendous change. This original blog post was published by OnlineSales.ai. Please enjoy this updated entry from our partner.

Tata’s online healthcare entity, Tata 1mg, aims to revolutionize how a consumer finds the right healthcare professional for their needs. The platform offers e-pharmacy services, diagnostics, and health content and has more than 200,000 active brands in its rapidly expanding list of suppliers, sellers and manufacturers. Several of these brands would need regular involvement from the marketplace team in order to set up and run ad campaigns. As one of the largest platforms, Tata 1mg approached OnlineSales.ai to address their growing needs for an efficient Retail Media Monetisation suite to help scale up their existing monetisation efforts.
Tata 1mg needed more data-driven insights and customizability for their monetisation efforts
Tata 1mg saw several challenges that they needed to address.
- Manual effort: Tata 1mg marketplace team’s monetization process was largely manual and required heavy time and resource investment to activate advertisers, which subsequently ate into their overall ad revenues.
- Non-scalable framework: Given the fast-growing number of advertisers on their marketplace – well into the hundreds of thousands – it became increasingly clear that their existing monetization framework was not scalable.
- Inadequate reporting & analytics: The existing framework facilitated only simple reporting, and brands were not able to draw the deep insights they needed to make data-led decisions and refine their advertising ROIs.
- Steep learning curve: Several brands lacked dedicated advertising experts who could bring the experience and skills needed to plan successful ad campaigns and optimize budgets. The involved learning curve led to increased advertiser-churn.
- Lack of personalized offerings: The manual nature of Tata 1mg’s monetization framework left little room for customizability, and account managers could offer very little in terms of tailored ad-buying experiences to different types of advertisers.
All of these issues led to regular revenue leakage. Tata 1mg realized the need for a central platform that addressed the above-mentioned issues and would also be able to cater to new ad channels and the requirements thereof. Developing such a solution in house was evaluated, but was found to be expensive and would require a lot of time to build.
OnlineSales.ai’s AI/ML-powered solution on Google Cloud offered the automation and flexibility to support modern omnichannel advertising needs
Therefore, Tata 1mg looked to OnlineSales.ai Monetize, an AI/ML-powered retail media monetisation suite on Google Cloud, to help address their needs for a cloud-based monetisation platform that offered the flexibility to support omnichannel advertising models, had automation built in to reduce manual tasks, provided detailed intelligence and analytics, and delivered quick, reliable scalability.
- White labeled self-serve platform: OnlineSales.ai’s retail media platform was implemented within a short 4 weeks. After thorough testing and implementation, the platform was successfully launched, and enabled sellers to run ads on a fully self-serve platform. This required zero involvement from the Tata team.
- Unified omni channel buying: The team at OnlineSales.ai worked closely with the platform’s core teams to activate and mobilize various advertising products through a self-serve platform, while simultaneously addressing any unique requirements they had.
- Omnichannel analytics with AI-led suggestions: Sellers are now also able to generate detailed reports that provide them critical insights into campaigns, and help them make better use of their budgets – enhancing their experience and interest in advertising on the platform.
- Personalized buying experiences: The tailored UX offered by OnlineSales.ai’s Monetize helped Tata engage brands of all levels in technical aptitude to use the platform easily. This also allowed admins to configure what types of inventories were available to different brands or advertiser segments.
OnlineSales.ai makes use of Google Cloud Dataflow to facilitate computations on real-time streaming. Microservices are deployed on the Google Kubernetes Engine (GKE) platform due to the solution’s well-known ability to handle scale.
In addition, Dataproc is used by the company to run batch processing apps while Cloud Load Balancing helps manage traffic across different regions; all at scale. Onlinesales.ai also uses Memorystore as a database for their ad servers in order to have very low latency, and deploys BigQuery to run analytical applications and facilitate powerful reporting. The bulk of their office applications are deployed on different VMs on Compute Engine, and the company also makes use of Cloud Storage for data storage and transfers between applications.
Learn more about OnlineSales.ai available on the Google Cloud Marketplace.
About OnlineSales.ai
OnlineSales.ai, offers a fully white labeled retail media platform which helps retailers unlock additional revenue by activating advertising real estate on their platform. With its AI/ML-powered solution, OnlineSales.ai allows retailers to turn brands of all sizes into advertisers – at scale. Its self-serve platform simplifies the ad buying process, and enhances outcomes with smart automation, boosting ad retailers’ ad revenues by multiples.
More Relevant Stories for Your Company

Cart.com to Transform e-Commerce for Brands Globally
The ecommerce playing field has been hard to navigate for most retailers, and Cart.com is on a mission to change that. Traditionally, retailers needing to run their online store, order fulfillment, customer service, marketing, and other essential activities have had to cobble together systems to get the capabilities they need

How to Enhance Incremental Pipeline Performance while Ingesting Data into BigQuery
When you build a data warehouse, the important question is how to ingest data from the source system to the data warehouse. If the table is small you can fully reload a table on a regular basis, however, if the table is large a common technique is to perform incremental

Serverless and BigQuery Together on Google Cloud: Behind the L’Oreal Beauty Tech Data Platform
Editor's note: In Today's guest post we hear from beauty leader L'Oréal about their approach to building a modern data platform on fully managed services: managing the ingest of diverse datasets into BigQuery with Cloud Run, and orchestrating transformations into relevant business domain representations for stakeholders across the organization. Learn

Quantum Metric Increases Business 10-fold
At Quantum Metric, we’re in the business of bringing our customers business insights that are based on customer experience data and analytics for mid-market and Fortune 500 companies. Our software, powered by big data, machine intelligence, and Google Cloud, helps our customers identify, quantify, prioritize and measure opportunities to improve
