





AI-powered Business Messages for Timely, Engaging and Helpful Conversations with Customers

9388
Of your peers have already read this article.
2:00 Minutes
The most insightful time you'll spend today!
Over the last two years, we’ve seen a significant uptick in the number of people using messaging to connect with businesses. Whether it was checking hours of operation, verifying what was in stock, or scheduling a pick-up, the pandemic caused a significant shift in consumer behavior.
- 45% of users are spending more time on messaging services because of the pandemic
- 85% of consumers would like to message brands directly
With the rise in demand for messaging, consumers expect communication with businesses to be speedy, simple, and convenient. For businesses, keeping up with customer inquiries can be a labor-intensive process, and offering 24/7 support outside of store hours can be costly.
To help businesses seamlessly deliver helpful, timely, and engaging conversations with customers when and where they need help, we introduced AI-powered Business Messages.
https://youtube.com/watch?v=fcgP3RHjBLY%3Fenablejsapi%3D1%26
What is AI-powered Business Messages?
With AI-powered Business Messages, you can connect with your customers in their moment of need, in the places they’re looking for answers—such as Google Search, Google Maps, or any brand-owned channel. For instance, check out how Walmart customers in the US are able to receive real-time information on product availability, straight from a search results page.
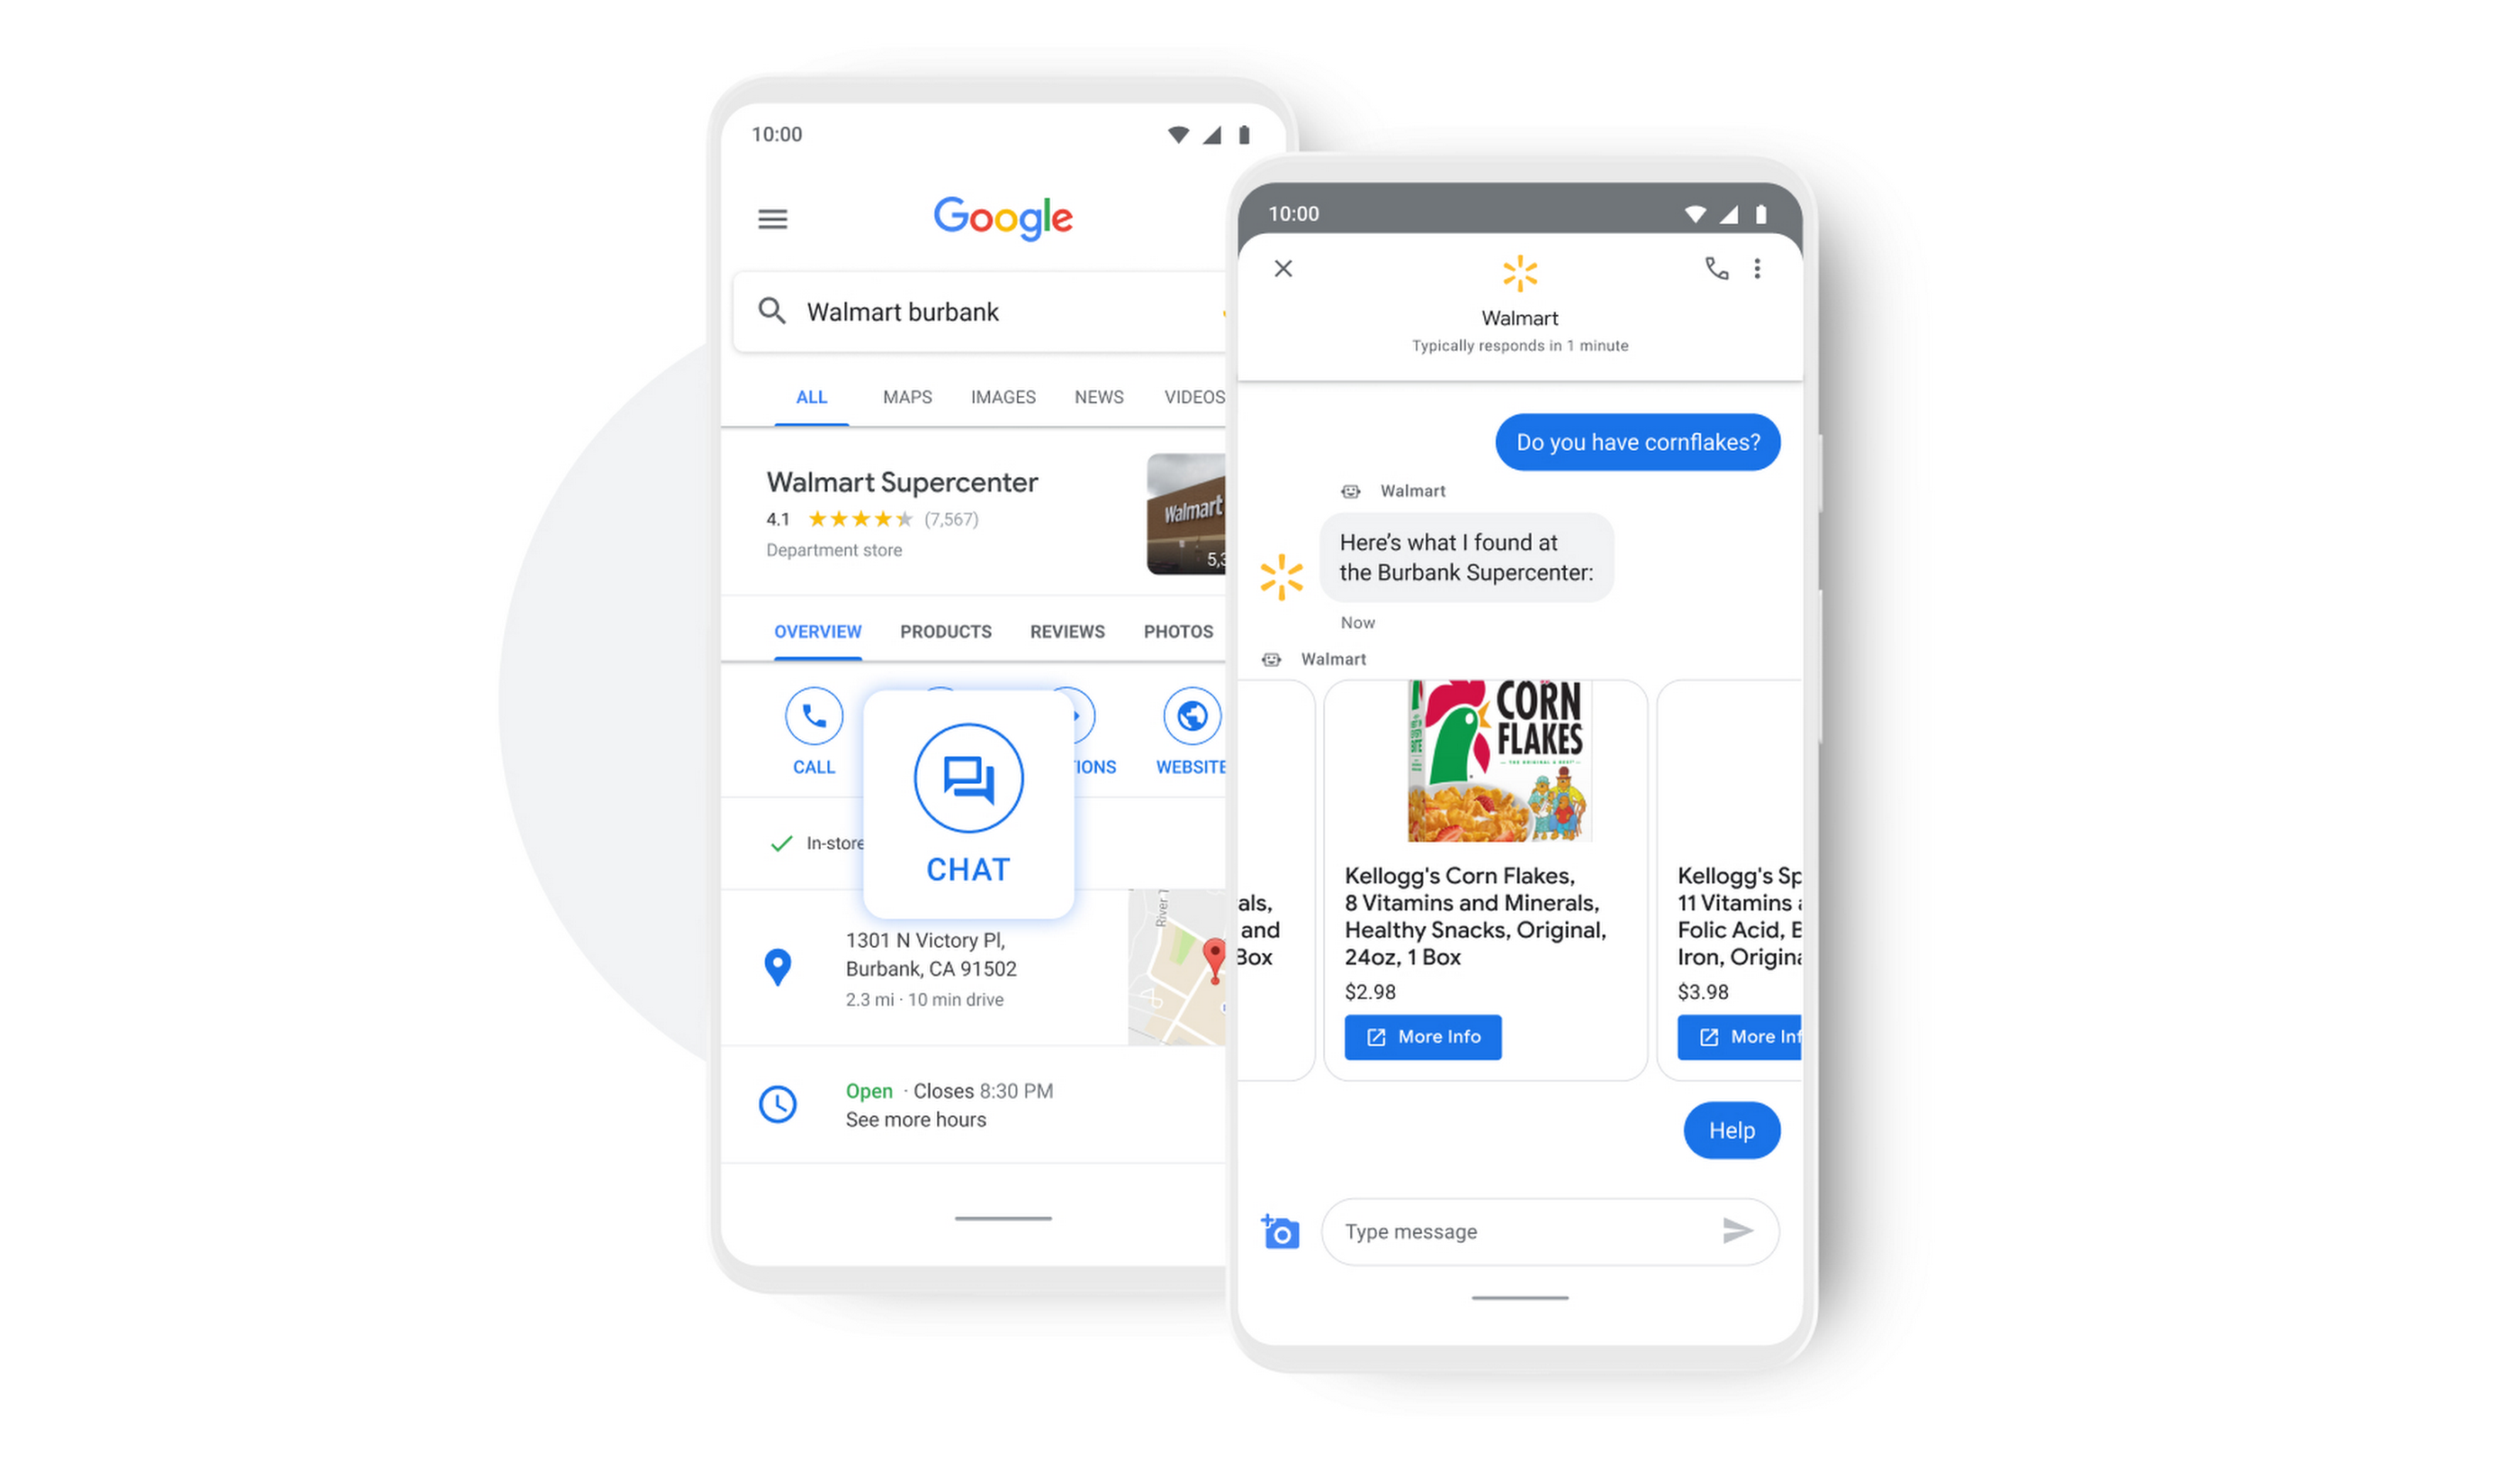
People turn to Google when they are searching for answers to their questions, looking to buy something, or trying to accomplish a particular task with one of our many tools. In fact, 68% of all online experiences begin with a search engine.
At Google, we know how important it is for interactions with a brand to be personalized, helpful, and simple. With AI-powered Business Messages, customers are able to chat with virtual agents that understand, interact, and respond in natural ways.
We are also combining smart automation with the ability for customers to chat with live agents when it’s really needed. This approach saves your customers precious time, while also saving you money. And with Business Messages automatically handling many customer inquiries in the background, businesses have the option to distribute their human customer service agents to address other needs.
Getting started with conversational AI is easy with Bot-in-a-Box
We know it can be difficult to get started with AI. That’s why we are utilizing existing Google AI tools like Dialogflow—part of Google Cloud Contact Center AI—to create the capability within Google’s Business Messages called Bot-in-a-Box, which makes getting started with Conversational AI easy. Bot-in-a-Box allows for fast and effective adoption of automation for businesses of all sizes.
Enabling Business Messages with Bot-in-a-Box can be as simple as leveraging an existing customer FAQ document you already have, whether it’s from a web page or an internal document. And since the conversational AI is powered by Business Messages and Dialogflow working together, your chat bot is able to understand and respond to customer questions automatically without the need to write code.
Bot-in-a-Box also supports other critical journeys like “Custom Intents.” That means that your bot is able to understand the different ways customers express a similar question and respond accurately by using machine learning capabilities.

Finding success
In April 2021, Wake County courthouses in North Carolina partnered with Tango Technology to implement Business Messages when it became apparent that being able to provide the public and attorneys with around-the-clock access to information would significantly reduce the pressure on courthouse staff. Using Bot-in-a-Box, Tango Technology was able to customize a solution for Wake County Courthouse, Justice Center, and Clerk of Superior Court in just four days.
“With the combination of Google’s Business Messages, GCP, and Dialogflow, we were able to spin up an AI-driven bot for the courts in days. And the technology stack allows us to continually improve by adding functionality in an agile process.”— Mike Lotz, Co-Founder, Tango Technology
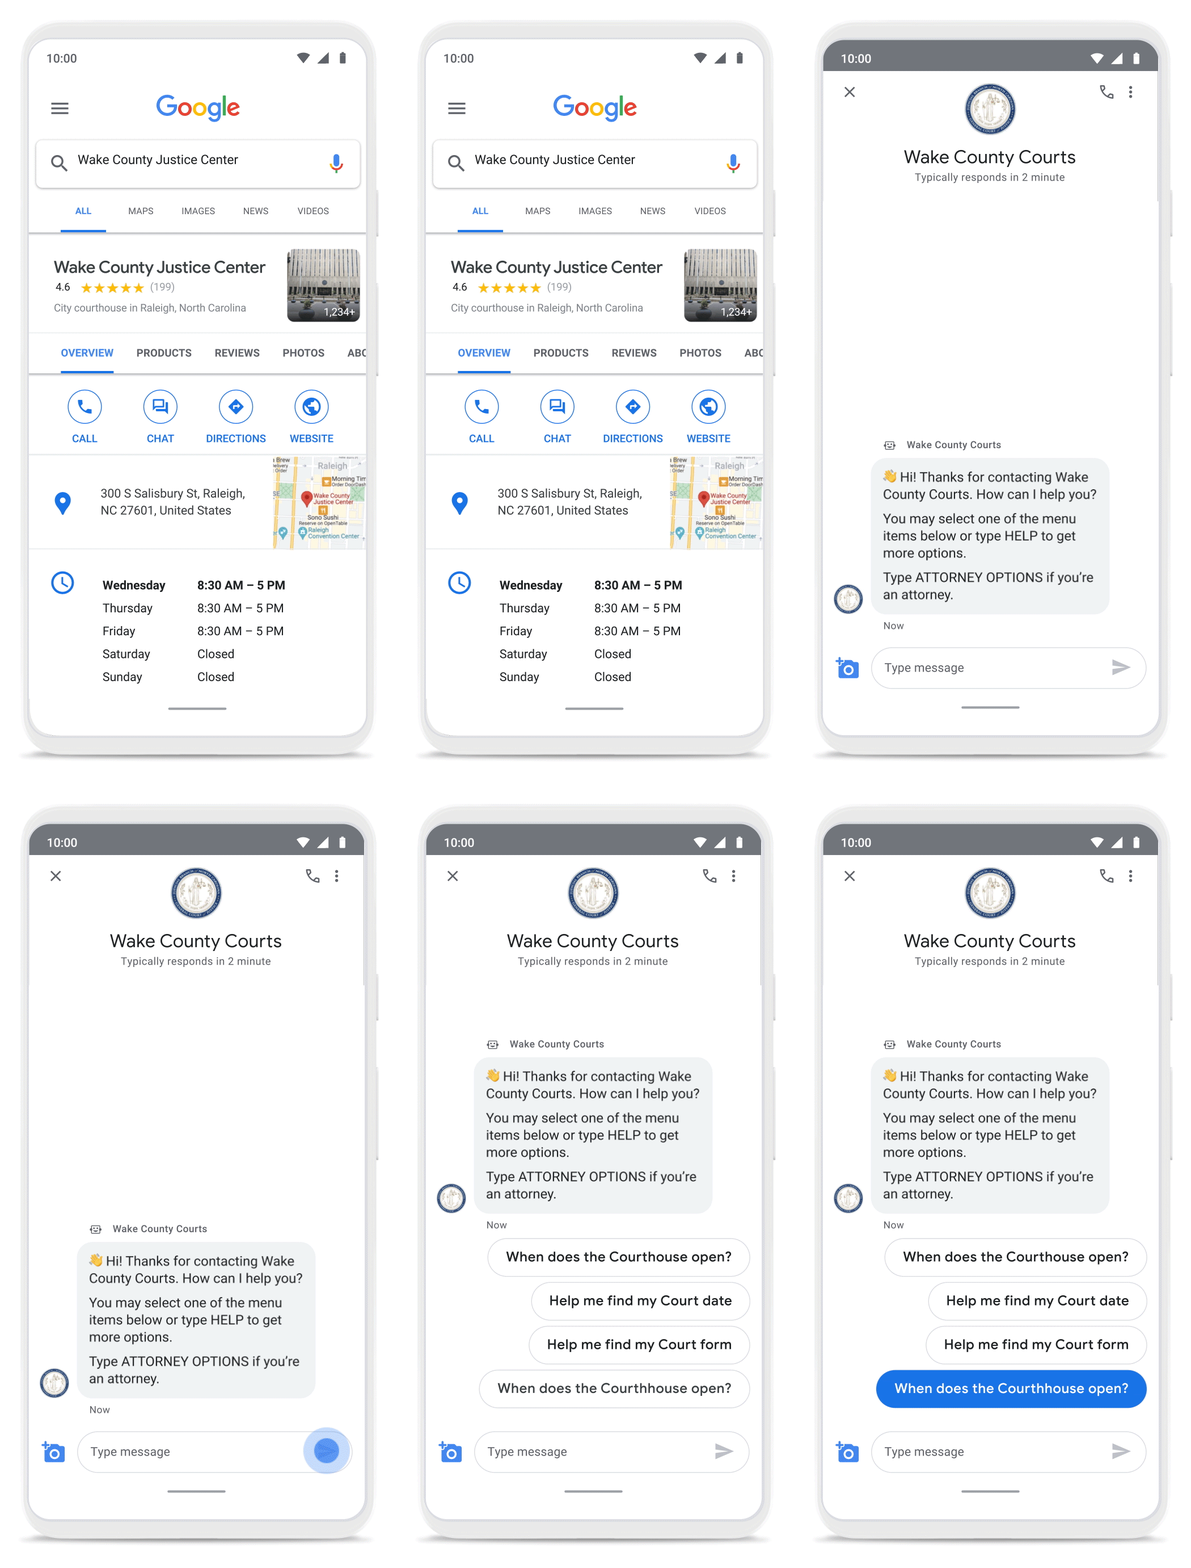
With Business Messages, North Carolina courthouses saw a 37% decrease in the call volume handled by courthouse staff. With 398,298 fewer phone calls during the first year of operation, the AI-based messages helped Wake County Courthouse work more efficiently and productively.
We’ve seen many brands benefiting from AI-powered Business Messages. For instance, Levi’s saw a 30% increase in off-hours shoppers and surpassed 85% customer satisfaction scores after implementing Business Messages. They also drove 30x more store-related questions than Levi’s website chat.
Bring Google’s conversational AI to your storefront with Business Messages
Google’s Business Messages makes it easier for businesses of all sizes to engage their existing or potential customers in a virtual conversation, when and where they need it.
To learn more, watch our Cloud Next session here or visit us at g.co/businessmessages. We have specialized services to help you get started and can share the wisdom of our channel partners and dedicated experts who specialize in unleashing the potential of conversational AI.
2848
Of your peers have already watched this video.
22:00 Minutes
The most insightful time you'll spend today!
Deploying Real-time AI: A Walkthrough
Enterprises are increasingly looking to leverage streaming data (customer interactions, sales transactions, machine logs) for building new innovative features, increasing sales, and protecting against risks.
AI/ML (artificial intelligence/machine learning) technologies make it possible to amp up the detection of insights in large volumes of data: insights that otherwise would be impossible to gain with manual inspection.
Learn how Dataflow together with TensorFlow Extended (TFX) and Cloud AI are enabling the extraction of label and classification information from video clips and natural text, predicting probabilities and detecting anomalies, fraud, and patterns in streams of business data.
Four Key Takeaways from Google and Quantum Metric’s Back-to-School Retail Benchmark Study

4788
Of your peers have already read this article.
2:00 Minutes
The most insightful time you'll spend today!
Is it September yet? Hardly! School is barely out for the summer. But according to Google and Quantum Metric research, the back-to-school and off-to-college shopping season – which in the U.S. is second only to the holidays in terms of purchasing volume1 – has already begun. For retailers, that means planning for this peak season has kicked off as well.
We’d like to share four key trends that emerged from Google research and Quantum Metric’s Back-to-School Retail Benchmarks study of U.S. retail data, explore the reasons behind them, and outline the key takeaways.
- Out-of-stock and inflation concerns are changing the way consumers shop. Back-to-school shoppers are starting earlier every year, with 41% beginning even before school is out – even more so when buying for college1. Why? The behavior is driven in large part by consumers’ concerns that they won’t be able to get what they need if they wait too long. 29% of shoppers start looking a full month before they need something1.
Back-to-school purchasing volume is quite high, with the majority spending up to $500 and 21% spending more than $1,0001. In fact, looking at year-over-year data, we see that average cart values have not only doubled since November 2021, but increased since the holidays1. And keep in mind that back-to-school spending is a key indicator leading into the holiday season.
That said, as people are reacting to inflation, they are comparing prices, hunting for bargains, and generally taking more time to plan. This is borne out by the fact that 76% of online shoppers are adding items to their carts and waiting to see if they go on sale before making the purchase1. And, to help stay on budget and reduce shipping costs, 74% plan to make multiple purchases in one checkout1. That carries over to in-store shopping, when consumers are buying more in one visit to reduce trips and save on gas.
2. The omnichannel theme continues. Consumers continue to use multiple channels in their shopping experience. As the pandemic has abated, some 82% expect that their back-to-school buying will be in-store, and 60% plan to purchase online. But in any case, 45% of consumers report that they will use both channels; more than 50% research online first before ever setting foot in a store2. Some use as many as five channels, including video and social media, and these 54% of consumers spend 1.5 times more compared to those who use only two channels4.
And mobile is a big part of the journey. Shoppers are using their phones to make purchases, especially for deadline-driven, last-minute needs, and often check prices on other retailers’ websites while shopping in-store. Anecdotally, mobile is a big part of how we ourselves shop with our children, who like to swipe on the phone through different options for colors and styles. We use our desktops when shopping on our own, especially for items that require research and represent a larger investment – and our study shows that’s quite common.
3. Consumers are making frequent use of wish lists. One trend we have observed is a higher abandonment rate, especially for apparel and general home and school supplies, compared to bigger-ticket items that require more research. But that can be attributed in part to the increasing use of wish lists. Online shoppers are picking a few things that look appealing or items on sale, saving them in wish lists, and then choosing just a few to purchase. Our research shows that 39% of consumers build one or two wish lists per month, while 28% said they build one or two each week, often using their lists to help with budgeting1.
4. Frustration rates have dropped significantly. Abandonment rates aside, shopper annoyance rates are down by 41%, year over year1. This is despite out-of-stock concerns and higher prices. But one key finding showed that both cart abandonment and “rage clicks” are more frequent on desktops, possibly because people investing time on search also have more time to complain to customer service.
And frustration does still exist. Some $300 billion is lost each year in the U.S. from bad search experiences5. Data collected internationally shows that 80% of consumers view a brand differently after experiencing search difficulties, and 97% favor websites where they can quickly find what they are looking for5.
Lessons to Learn
What are the key takeaways for retailers? In general, consider the sources of customer pain points and find ways to erase friction. Improve search and personalization. And focus on improving the customer experience and building loyalty. Specifically:
80% of shoppers want personalization6. Think about how you can drive personalized promotions or experiences that will drive higher engagement with your brand.
46% of consumers want more time to research1. Drive toward providing more robust research and product information points, like comparison charts, images, and specific product details.
43% of consumers want a discount1, but given current economic trends, retailers may not be offering discounts. In order to appease budget-conscious shoppers, retailers can consider other retention strategies such as driving loyalty using points, rewards, or faster-shipping perks.
Be sure to keep returns as simple as possible so consumers feel confident when making a purchase, and reduce possible friction points if a consumer decides to make a return. 43% of shoppers return at least a quarter of the products they buy and do not want to pay for shipping or jump through hoops1.
How We Can Help
Google-sponsored research shows that price, deals, and promotions are important to 68% of back-to-school shoppers.7 In addition, shoppers want certainty that they will get what they want. Google Cloud can make it easier for retailers to enable customers to find the right products with discovery solutions. These solutions provide Google-quality search and recommendations on a retailer’s own digital properties, helping to increase conversions and reduce search abandonment. In addition, Quantum Metric solutions, available on the Google Cloud Marketplace, are built with BigQuery, which helps retailers consolidate and unlock the power of their raw data to identify areas of friction and deliver improved digital shopping experiences.
We invite you to watch the Total Retail webinar “4 ways retailers can get ready for back-to-school, off-to college” on demand and to view the full Back-to-School Retail Benchmarks report from Quantum Metric.
Sources:
1. Back-to-School Retail Benchmarks report from Quantum Metric
2. Google/Ipsos,Moments 2021, Jun 2021, Online survey, US, n=335 Back to School shoppers
3. Google/Ipsos, Moments 2021, Jun 2021, Online survey, US, n=2,006 American general population 18+
4. Google/Ipsos, Holiday Shopping Study, Oct 2021 – Jan 2022, Online survey, US, n=7,253, Americans 18+ who conducted holiday shopping activities in past two days
5. Google Cloud Blog, Nov 2021, “Research: Search abandonment has a lasting impact on brand loyalty”
6. McKinsey & Company, “Personalizing the customer experience: Driving differentiation in retail”
7. Think with Google, July 2021, “What to expect from shoppers this back-to-school season”
3040
Of your peers have already watched this video.
24:00 Minutes
The most insightful time you'll spend today!
How to Modernize Your Data infrastructure and Analytics: Case Study
Data modernization is key to digital transformation. Legacy systems are slow, expensive and cannot keep up with changing requirements. Data teams often spend more time on data pipelines than they do on data analysis or data science.
in this video, Harish Ramachandraiah, Director Eng. & Analytics, Sunrun, speaks with Joel Mckelvey, Product Marketing Manager, Google Cloud. They discuss how Sunrun leveraged Looker and BigQuery to reduce the complexity of legacy extract-transform-load processes, improve database performance, and adapt quickly to changes in data.
Now Sunrun makes data accessible where it’s needed, in near-real time.
Mckelvey shows how a modern data stack helps companies simplify the data pipeline, consolidate vital data, and accelerate analytics performance while improving agility, efficiency, and data governance.
2990
Of your peers have already watched this video.
39:00 Minutes
The most insightful time you'll spend today!
Verizon Media Shows the Solution Architecture it Uses for a 100+ PB Analytics Platform
Verizon Media owns and operates more than a dozen brands including Yahoo Mail, Yahoo News, AOL, Huffington Post, TechCrunch, and Engadget among others.
These web properties are visited by millions of users on a daily basis.
In this session, Shakil Memon, Customer Engineer, Google Cloud and Nikhil Mishra, Sr Director, Engineering, Verizon Media, present how Verizon Media is generating actionable insights from the wealth of data that they have.
They will discuss:
- Challenge with large scale and large volumes of data
- Basic principles of a data warehousing and data analytics project
- Showcase a reference architecture
- A complete end-to-end solution architecture for building a 100+ PB internet-scale analytics platform on Google Cloud, including how Looker fits in the end-to-end solution and how actionable insights are generated from data.
They will also provide unique perspectives, behind-the-scenes thinking, and some insight on how the architecture has evolved in its current form over the years.
BigQuery Explainable AI for Demystifying the Inner Workings of ML Models. Now GA!

6571
Of your peers have already read this article.
2:00 Minutes
The most insightful time you'll spend today!
Explainable AI (XAI) helps you understand and interpret how your machine learning models make decisions. We’re excited to announce that BigQuery Explainable AI is now generally available (GA). BigQuery is the data warehouse that supports explainable AI in a most comprehensive way w.r.t both XAI methodology and model types. It does this at BigQuery scale, enabling millions of explanations within seconds with a single SQL query.
Why is Explainable AI so important? To demystify the inner workings of machine learning models, Explainable AI is quickly becoming an essential and growing need for businesses as they continue to invest in AI and ML. With 76% of enterprises now prioritizing artificial intelligence (AI) and machine learning (ML) over other initiatives in 2021 IT budgets, the majority of CEOs (82%) believe that AI-based decisions must be explainable to be trusted according to a PwC survey.
While the focus of this blogpost is on BigQuery Explainable AI, Google Cloud provides a variety of tools and frameworks to help you interpret models outside of BigQuery, such as with Vertex Explainable AI, which includes AutoML Tables, AutoML Vision, and custom-trained models.
So how does Explainable AI in BigQuery work exactly? And how might you use it in practice?
Two types of Explainable AI: global and local explainability
When it comes to Explainable AI, the first thing to note is that there are two main types of explainability as they relate to the features used to train the ML model: global explainability and local explainability.
Imagine that you have a ML model that predicts housing price (as a dollar amount), based on three features: (1) number of bedrooms, (2) distance to the nearest city center, and (3) construction date.
Global explainability (a.k.a. global feature importance) describes the features’ overall influence on the model and helps you understand if a feature had a greater influence than other features over the model’s predictions. For example, global explainability can reveal that the number of bedrooms and distance to city center typically has a much stronger influence than the construction date on predicting housing prices. Global explainability is especially useful if you have hundreds or thousands of features and you want to determine which features are the most important contributors to your model. You may also consider using global explainability as a way to identify and prune less important features to improve the generalizability of their models.
Local explainability (a.k.a. feature attributions) describes the breakdown of how each feature contributes towards a specific prediction. For example, if the model predicts that house ID#1001 has a predicted price of $230,000, local explainability would describe a baseline amount (e.g. $50,000) and how each of the features contributes on top of the baseline towards the predicted price. For example, the model may say that on top of the baseline of $50,000, having 3 bedrooms contributed an additional $50,000, close proximity to the city center added $100,000, and construction date of 2010 added $30,000, for a total predicted price of $230,000. In essence, understanding the exact contribution of each feature used by the model to make each prediction is the main purpose of local explainability.
What ML models does BigQuery Explainable AI apply to?
BigQuery Explainable AI applies to a variety of models, including supervised learning models for IID data and time series models. The documentation for BigQuery Explainable AI provides an overview of the different ways of applying explainability per model. Note that each explainability method has its own way of calculation (e.g. Shapley values), which are covered more in-depth in the documentation.

Examples with BigQuery Explainable AI
In this next section, we will show three examples of how to use BigQuery Explainable AI in different ML applications:
Regression models with BigQuery Explainable AI
Let’s use a boosted tree regression model to predict how much a taxi cab driver will receive in tips for a taxi ride, based on features such as number of passengers, payment type, total payment and trip distance. Then let’s use BigQuery Explainable AI to help us understand how the model made the predictions in terms of global explainability (which features were most important?) and local explainability (how did the model arrive at each prediction?).
The taxi trips dataset comes from the BigQuery public datasets and is publicly available in the table: bigquery-public-data.new_york_taxi_trips.tlc_yellow_trips_2018.
First, you can train a boosted tree regression model.
CREATE OR REPLACE MODEL bqml_tutorial.taxi_tip_regression_modelOPTIONS (model_type='boosted_tree_regressor',input_label_cols=['tip_amount'],max_iterations = 50,tree_method = 'HIST',subsample = 0.85,enable_global_explain = TRUE) ASSELECTvendor_id,passenger_count,trip_distance,rate_code,payment_type,total_amount,tip_amountFROM`bigquery-public-data.new_york_taxi_trips.tlc_yellow_trips_2018`WHERE tip_amount >= 0LIMIT 1000000
Now let’s do a prediction using ML.PREDICT, which is the standard way in BigQuery ML to make predictions without explainability.
SELECT *FROMML.PREDICT(MODEL bqml_tutorial.taxi_tip_regression_model,(SELECT"0" AS vendor_id,1 AS passenger_count,CAST(5.85 AS NUMERIC) AS trip_distance,"0" AS rate_code,"0" AS payment_type,CAST(55.56 AS NUMERIC) AS total_amount))

But you might wonder—how did the model generate this prediction of ~11.077?
BigQuery Explainable AI can help us answer this question. Instead of using ML.PREDICT, you use ML.EXPLAIN_PREDICT with an additional optional parameter top_k_features. ML.EXPLAIN_PREDICT extends the capabilities of ML.PREDICT by outputting several additional columns that explain how each feature contributes to the predicted value. In fact, since ML.EXPLAIN_PREDICT includes all the output from ML.PREDICT anyway, you may want to consider using ML.EXPLAIN_PREDICT every time instead.
SELECT *FROMML.EXPLAIN_PREDICT(MODEL bqml_tutorial.taxi_tip_regression_model,(SELECT"0" AS vendor_id,1 AS passenger_count,CAST(5.85 AS NUMERIC) AS trip_distance,"0" AS rate_code,"0" AS payment_type,CAST(55.56 AS NUMERIC) AS total_amount),STRUCT(6 AS top_k_features))

The way to interpret these columns is:
Σfeature_attributions + baseline_prediction_value = prediction_value
Let’s break this down. The prediction_value is ~11.077, which is simply the predicted_tip_amount. The baseline_prediction_value is ~6.184, which is the tip amount for an average instance. top_feature_attributions indicates how much each of the features contributes towards the prediction value. For example, total_amount contributes ~2.540 to the predicted_tip_amount.
ML.EXPLAIN_PREDICT provides local feature explainability for regression models. For global feature importance, see the documentation for ML.GLOBAL_EXPLAIN.
Classification models with BigQuery Explainable AI
Let’s use a logistic regression model to show you an example of BigQuery Explainable AI with classification models. We can use the same public dataset as before: bigquery-public-data.new_york_taxi_trips.tlc_yellow_trips_2018.
Train a logistic regression model to predict the bracket of the percentage of the tip amount out of the taxi bill.
CREATE OR REPLACE MODEL bqml_tutorial.taxi_tip_classification_modelOPTIONS(model_type='logistic_reg',input_label_cols=['tip_bucket'],enable_global_explain=true) ASSELECTvendor_id,passenger_count,trip_distance,rate_code,payment_type,total_amount,CASEWHEN tip_amount > total_amount*0.20 THEN '20% or more'WHEN tip_amount > total_amount*0.15 THEN '15% to 20%'WHEN tip_amount > total_amount*0.10 THEN '10% to 15%'ELSE '10% or less'END AS tip_bucketFROM`bigquery-public-data.new_york_taxi_trips.tlc_yellow_trips_2018`WHERE tip_amount >= 0LIMIT 1000000
Next, you can run ML.EXPLAIN_PREDICT to get both the classification results and the additional information for local feature explainability. For global explainability, you can use ML.GLOBAL_EXPLAIN. Again, since ML.EXPLAIN_PREDICT includes all the output from ML.PREDICT anyway, you may want to consider using ML.EXPLAIN_PREDICT every time instead.
SELECT *FROMML.EXPLAIN_PREDICT(MODEL bqml_tutorial.taxi_tip_classification_model,(SELECT"0" AS vendor_id,1 AS passenger_count,CAST(5.85 AS NUMERIC) AS trip_distance,"0" AS rate_code,"0" AS payment_type,CAST(55.56 AS NUMERIC) AS total_amount),STRUCT(6 AS top_k_features))

Similar to the regression example earlier, the formula is used to derive the prediction_value:
Σfeature_attributions + baseline_prediction_value = prediction_value
As you can see in the screenshot above, the baseline_prediction_value is ~0.296. total_amount is the most important feature in making this specific prediction, contributing ~0.067 to the prediction_value, though followed by trip_distance. The feature passenger_count contributes negatively to prediction_value by -0.0015. The features vendor_id, rate_code, and payment_type did not seem to contribute much to the prediction_value.
You may wonder why the prediction_value of ~0.389 doesn’t equal the probability value of ~0.359. The reason is that unlike for regression models, for classification models, prediction_value is not a probability score. Instead, prediction_value is the logit value (i.e., log-odds) for the predicted class, which you could separately convert to probabilities by applying the softmax transformation to the logit values. For example, a three-class classification has a log-odds output of [2.446, -2.021, -2.190]. After applying the softmax transformation, the probability of these class predictions is [0.9905, 0.0056, 0.0038].
Time-series forecasting models with BigQuery Explainable AI

Explainable AI for forecasting provides more interpretability into how the forecasting model came to its predictions. Let’s go through an example of forecasting the number of bike trips in NYC using the new_york.citibike_trips public data in BigQuery.
You can train a time-series model ARIMA_PLUS:
CREATE OR REPLACE MODEL bqml_tutorial.nyc_citibike_arima_modelOPTIONS(model_type = 'ARIMA_PLUS',time_series_timestamp_col = 'date',time_series_data_col = 'num_trips',holiday_region = 'US') ASSELECTEXTRACT(DATE from starttime) AS date,COUNT(*) AS num_tripsFROM`bigquery-public-data.new_york.citibike_trips`GROUP BY dateNext, you can first try forecasting without explainability using ML.FORECAST:SELECT*FROMML.FORECAST(MODEL bqml_tutorial.nyc_citibike_arima_model,STRUCT(365 AS horizon, 0.9 AS confidence_level))
This function outputs the forecasted values and the prediction interval. Plotting it in addition to the input time series gives the following figure.

But how does the forecasting model arrive at its predictions? Explainability is especially important if the model ever generates unexpected results.
With ML.EXPLAIN_FORECAST, BigQuery Explainable AI provides extra transparency into the seasonality, trend, holiday effects, level (step) changes, and spikes and dips outlier removal. In fact, since ML.EXPLAIN_FORECAST includes all the output from ML.FORECAST anyway, you may want to consider using ML.EXPLAIN_FORECAST every time instead.
SELECT*FROMML.EXPLAIN_FORECAST(MODEL bqml_tutorial.nyc_citibike_arima_model,STRUCT(365 AS horizon, 0.9 AS confidence_level))

Compared to the previous figure which only shows the forecasting results, this figure shows much richer information to explain how the forecast is made.
First, it shows how the input time series is adjusted by removing the spikes and dips anomalies, and by compensating the level changes. That is:
time_series_adjusted_data = time_series_data - spikes_and_dips - step_changes
Second, it shows how the adjusted input time series is decomposed into different components such as both weekly and yearly seasonal components, holiday effect component and trend component. That is
time_series_adjusted_data = trend + seasonal_period_yearly + seasonal_period_weekly + holiday_effect + residual
Finally, it shows how these components are forecasted separately to compose the final forecasting results. That is:
time_series_data = trend + seasonal_period_yearly + seasonal_period_weekly + holiday_effect
For more information on these time series components, please see the documentation here.
Conclusion
With the GA of BigQuery Explainable AI, we hope you will now be able to interpret your machine learning models with ease.
Thanks to the BigQuery ML team, especially Lisa Yin, Jiashang Liu, Amir Hormati, Mingge Deng, Jerry Ye and Abhinav Khushraj. Also thanks to the Vertex Explainable AI team, especially David Pitman and Besim Avci.
More Relevant Stories for Your Company

Fairygoodboss and Google Cloud Tied to Advancing Diversity and Female Leadership at Workplaces
May is Asian American Pacific Islander Heritage Month — a time for us to come together to celebrate and remember the important people and history of Asian and Pacific Island heritage. This feature highlights founder Georgene Huang and how her startup Fairygodboss uses easy to use Google Cloud tools to

S4 Agtech Transforms Agriculture with Google Cloud
Like countless other industries, farming is going digital and undergoing big changes—driven by access to more actionable information. The agriculture business can now gather and analyze georeferenced data from satellites, combined with data from IoT sensors in fields, crop rotation and yield histories, weather patterns, seed genotypes and soil composition to help
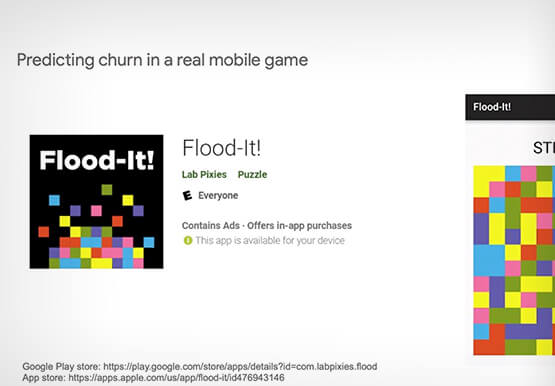

Predict User Churn on Gaming Apps with Google Analytics Data using BigQuery ML
User retention can be a major challenge for mobile game developers. According to the Mobile Gaming Industry Analysis in 2019, most mobile games only see a 25% retention rate for users after the first day. To retain a larger percentage of users after their first use of an app, developers can

Candidate360: Google Cloud and Deloitte Product Improves Universities’ Enrollment and Admission Processes
Given the May 1 deadline for students to enroll, colleges and universities have been carefully watching the numbers of students who put down deposits and commit to a school. Like nearly every other sector in the U.S., colleges and universities have been hit hard by the pandemic and economic downturn,
