





Serverless and BigQuery Together on Google Cloud: Behind the L’Oreal Beauty Tech Data Platform

5360
Of your peers have already read this article.
4:00 Minutes
The most insightful time you'll spend today!
Editor’s note: In Today’s guest post we hear from beauty leader L’Oréal about their approach to building a modern data platform on fully managed services: managing the ingest of diverse datasets into BigQuery with Cloud Run, and orchestrating transformations into relevant business domain representations for stakeholders across the organization. Learn more about how businesses have benefited from Cloud Run in Forrester’s report on Total Economic Impact.
L’Oréal was born out of science. For over 100 years, we have always shaped the future of beauty, and taken its eternal quest to new horizons. This has earned us our current position as the world’s uncontested beauty leader (~€ 32 B annual sales in 2021), present in 150 countries with over 85,000 employees.
Today, with the power of our game-changing science, multiplied by cutting-edge technologies, we continue our lifelong journey of shaping the future of beauty.
As a Beauty Tech company, we leverage our decades-long heritage of rich data assets to empower our decision-making with instant, sophisticated analysis.
Because we oversee global brands, which must adapt to local requirements, we need to maintain a deep understanding of what a brands’ data represents, while managing disparate legal and regulatory requirements for different countries. Our end goal is to run a safe, compliant and sustainable data warehouse as efficiently and effectively as possible.
We sync and aggregate internal and external data from a wide variety of sources across organizations and retail stores. This made the management of our data warehouse infrastructure used to be very complex and hard to manage before Google Cloud. L’Oréal’s footprint was so large that we once found it impossible to have a standardized method to handle data. Every process was vendor-specific, and the infrastructure was brittle. We went looking for a solution to our complex data infrastructure needs, and defined the following non-negotiable principles:
- No Ops: The job of a developer at L’Oréal is not to manage servers. We need an elastic infrastructure that scales on demand, so that our developers can focus on delivering customized and inclusive beauty experiences to all consumers, rather than focusing on managing servers.
- Secure: We have strict security and compliance requirements which vary by country, and we employ a zero-trust security strategy. We must keep both our own internal data and customer data safe and encrypted.
- Sustainable : Our data lives in multiple environments, including on-prem data centers and public cloud services. We must be able to securely access and analyze this data while minimizing the complexity and environmental impact of moving and duplicating data.
- End-to-end supervision: Because developers shouldn’t be managing servers, we need a “single pane of glass” dashboard to monitor and triage the system if something goes wrong.
- Easy-to-deploy: Deploying code safely should not compromise velocity. We are constantly developing innovations that push the boundaries of science and reinvent beauty rituals. We need integrated tools to make our code deployment process seamless and safe.
- Event-driven architecture: Our data is used globally by research, product, business and engineering teams with high expectations on data quality and timeliness. Many of our internal processes and analysis are based on near real-time data.
- Data products delivered “as a service”: We want to empower our employees to drive business value at record speed. To that end, we need solutions that enable us to remove the developers from the critical path of solution delivery as much as possible.
- Extract-load-transform (ELT): Our goal is to implement the pattern to load data as soon as possible into the data warehouse to take advantage of SQL transformations.
After considering multiple vendors on the market, with these principles in mind, we landed on end-to-end Google Cloud serverless and data tooling. We were already using Google Cloud for a few processes, including BigQuery, and loved the experience.
We’ve now expanded our use of Google Cloud to fully support the L’Oréal Beauty Tech Data Platform.
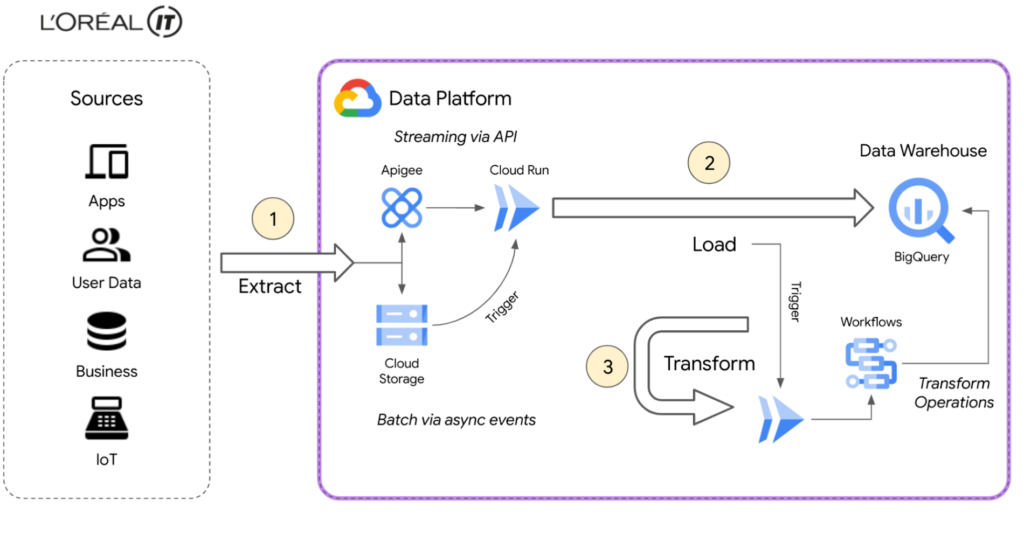
L’Oréal’s Beauty Tech Data Platform incorporates data from two types of sources: directly via API, which is data that adapts easily to our schema and is inserted directly into BigQuery, and bulk data from integrations, which require event-driven transformations using Eventarc mechanisms. These transformations are performed in Cloud Run and Cloud Functions (2nd gen), or directly in SQL. With Google Cloud, we can adapt very quickly.
Today, we currently have 8500 flows for ~5000 users using the native zero-trust capabilities offered by Google Cloud. Indeed, the flows come from Google Cloud and other third-party services.
BigQuery enabled us to adopt standard SQL as our universal language in our data warehouse and meet all expectations for queries and reporting. We were also able to load original data using features like federated queries, and efficiently transitioned from ETL to ELT data ingestion by handling semi-structured data with SQL. This approach of loading original data from sources into BigQuery with non-destructive transformations allows us to reprocess data for new use-cases easily, directly within BigQuery.
Our applications are hosted on multiple environments – on-premises, in Google Cloud, and in other public clouds. This made it difficult for our data engineers and analysts to natively analyze data across clouds until we started using BigQuery Omni. This capability of BigQuery allowed us to globally access and analyze data across clouds through a single pane of glass using the native BigQuery user interface itself. Without BigQuery Omni, it would’ve been impossible for our teams to natively do cross-cloud analytics. Moreover, it eliminated the need for us to move sensitive data, which is not only expensive because of local tax and subsea transport, but also incredibly risky – sometimes even forbidden – because of local regulations.
Today Google Cloud powers our Beauty Tech Data Platform, which stores 100TB of production data in BigQuery and processes 20TB of data each month. We have more than 8000 governed datasets, and 2 millions of BigQuery tables coming from multiple data sources such as Salesforce, SAP, Microsoft, and Google Ads.
For more complex transformations where custom and specific libraries are required, Cloud Workflows help us to manage the complexity very efficiently by orchestrating steps in containers through Cloud Run, Cloud Functions and even BigQuery jobs — the most used way to transform and add value to the L’Oréal data.
Additionally, by using BigQuery and Google Cloud’s serverless compute for API ingestion, bulk data loading, and post-loading transformations, we can keep the entire system in a single boundary of trust at a fraction of the cost. With ingest, queries, and transformations all being fully elastic and on-demand, we no longer have to perform capacity planning for either the compute or analytics components of the system. And of course these services’ pay-as-you-go model perfectly aligns with L’Oréal’s strategy of only paying for something when you use it.
Google Cloud fulfilled the requirements of our Beauty Tech Data Platform. And as if offering us a no-ops, secure, easy-to-deploy, custom-development free, event-based platform with end-to-end supervision wasn’t enough, Google Cloud also helped us with our sustainability efforts.
Being able to measure and understand the environmental footprint of our public cloud usage is also a key part of our sustainable tech roadmap. With Google Cloud Carbon Footprint, we can easily see the impact of our sustainable infrastructure approach and architecture principles. Our Beauty Tech platform is a strategic ambition for L’Oréal: inventing the beauty products of the future while becoming the company of the future.
Sustainable tech is an imperative and a very important step towards this ambition of creating responsible beauty for our consumers, and sustainable-by-design tech services for our employees. We all have a role to play, and by joining forces, we can have a positive impact.
Google Cloud’s data ecosystem and serverless tools are highly complementary, and made it possible to build a next-generation data analytics platform that met all our needs.
Get started using serverless and BigQuery together on Google Cloud today.
New Capabilities in BigQuery to Ease Anomalies Detection in the Absence of Labeled Data

6343
Of your peers have already read this article.
4:00 Minutes
The most insightful time you'll spend today!
When it comes to anomaly detection, one of the key challenges that many organizations face is that it can be difficult to know how to define what an anomaly is. How do you define and anticipate unusual network intrusions, manufacturing defects, or insurance fraud? If you have labeled data with known anomalies, then you can choose from a variety of supervised machine learning model types that are already supported in BigQuery ML. But what can you do if you don’t know what kind of anomaly to expect, and you don’t have labeled data? Unlike typical predictive techniques that leverage supervised learning, organizations may need to be able to detect anomalies in the absence of labeled data.
Today we are announcing the public preview of new anomaly detection capabilities in BigQuery ML that leverage unsupervised machine learning to help you detect anomalies without needing labeled data. Depending on whether or not the training data is time series, users can now detect anomalies in training data or on new input data using a new ML.DETECT_ANOMALIES function (documentation), with the following models:
- Autoencoder model, now in Public Preview (documentation)
- K-means model, already GA (documentation)
- ARIMA_PLUS time series model, already GA (documentation)
How does anomaly detection with ML.DETECT_ANOMALIES work?
To detect anomalies in non-time-series data, you can use:
- K-means clustering models: When you use
ML.DETECT_ANOMALIESwith a k-means model, anomalies are identified based on the value of each input data point’s normalized distance to its nearest cluster. If that distance exceeds a threshold determined by the contamination value provided by the user, the data point is identified as an anomaly. - Autoencoder models: When you use
ML.DETECT_ANOMALIESwith an autoencoder model, anomalies are identified based on the reconstruction error for each data point. If the error exceeds a threshold determined by the contamination value, it is identified as an anomaly.
To detect anomalies in time-series data, you can use:
- ARIMA_PLUS time series models: When you use
ML.DETECT_ANOMALIESwith an ARIMA_PLUS model, anomalies are identified based on the confidence interval for that timestamp. If the probability that the data point at that timestamp occurs outside of the prediction interval exceeds a probability threshold provided by the user, the datapoint is identified as an anomaly.
Below we show code examples of anomaly detection in BigQuery ML for each of the above scenarios.
Anomaly detection with a k-means clustering model
You can now detect anomalies using k-means clustering models, by running ML.DETECT_ANOMALIES to detect anomalies in the training data or in new input data. Begin by creating a k-means clustering model:
Language: SQL
CREATE MODEL `mydataset.my_kmeans_model`OPTIONS(MODEL_TYPE = 'kmeans',NUM_CLUSTERS = 8,KMEANS_INIT_METHOD = 'kmeans++') ASSELECT* EXCEPT(Time, Class)FROM`bigquery-public-data.ml_datasets.ulb_fraud_detection`;
With the k-means clustering model trained, you can now run ML.DETECT_ANOMALIES to detect anomalies in the training data or in new input data.
To detect anomalies in the training data, use ML.DETECT_ANOMALIES with the same data used during training:
Language: SQL
SELECT*FROMML.DETECT_ANOMALIES(MODEL `mydataset.my_kmeans_model`,STRUCT(0.02 AS contamination),TABLE `bigquery-public-data.ml_datasets.ulb_fraud_detection`);

To detect anomalies in new data, use ML.DETECT_ANOMALIES and provide new data as input:
Language: SQL
SELECT*FROMML.DETECT_ANOMALIES(MODEL `mydataset.my_kmeans_model`,STRUCT(0.02 AS contamination),(SELECT * FROM `mydataset.newdata`));

How does anomaly detection work for k-means clustering models?
Anomalies are identified based on the value of each input data point’s normalized distance to its nearest cluster, which, if exceeds a threshold determined by the contamination value, is identified as an anomaly. How does this work exactly? With a k-means model and data as inputs, ML.DETECT_ANOMALIES first computes the absolute distance for each input data point to all cluster centroids in the model, then normalizes each distance by the respective cluster radius (which is defined as the standard deviation of the absolute distances of all points in this cluster to the centroid). For each data point, ML.DETECT_ANOMALIES returns the nearest centroid_id based on normalized_distance, as seen in the screenshot above. The contamination value, specified by the user, determines the threshold of whether a data point is considered an anomaly. For example, a contamination value of 0.1 means that the top 10% of descending normalized distance from the training data will be used as the cut-off threshold. If the normalized distance for a datapoint exceeds the threshold, then it is identified as an anomaly. Setting an appropriate contamination will be highly dependent on the requirements of the user or business.
For more information on anomaly detection with k-means clustering, please see the documentation here.
Anomaly detection with an autoencoder model
You can now detect anomalies using autoencoder models, by running ML.DETECT_ANOMALIES to detect anomalies in the training data or in new input data.
Begin by creating an autoencoder model:
Language: SQL
CREATE MODEL `mydataset.my_autoencoder_model`OPTIONS(model_type='autoencoder',activation_fn='relu',batch_size=8,dropout=0.2,hidden_units=[32, 16, 4, 16, 32],learn_rate=0.001,l1_reg_activation=0.0001,max_iterations=10,optimizer='adam') ASSELECT* EXCEPT(Time, Class)FROM`bigquery-public-data.ml_datasets.ulb_fraud_detection`;
To detect anomalies in the training data, use ML.DETECT_ANOMALIES with the same data used during training:
Language: SQL
SELECT*FROMML.DETECT_ANOMALIES(MODEL `mydataset.my_autoencoder_model`,STRUCT(0.02 AS contamination),TABLE `bigquery-public-data.ml_datasets.ulb_fraud_detection`);

To detect anomalies in new data, use ML.DETECT_ANOMALIES and provide new data as input:
Language: SQL
SELECT*FROMML.DETECT_ANOMALIES(MODEL `mydataset.my_autoencoder_model`,STRUCT(0.02 AS contamination),(SELECT * FROM `mydataset.newdata`));

How does anomaly detection work for autoencoder models?
Anomalies are identified based on the value of each input data point’s reconstructed error, which, if exceeds a threshold determined by the contamination value, is identified as an anomaly. How does this work exactly? With an autoencoder model and data as inputs, ML.DETECT_ANOMALIES first computes the mean_squared_error for each data point between its original values and its reconstructed values. The contamination value, specified by the user, determines the threshold of whether a data point is considered an anomaly. For example, a contamination value of 0.1 means that the top 10% of descending error from the training data will be used as the cut-off threshold. Setting an appropriate contamination will be highly dependent on the requirements of the user or business.
For more information on anomaly detection with autoencoder models, please see the documentation here.
Anomaly detection with an ARIMA_PLUS time-series model

With ML.DETECT_ANOMALIES, you can now detect anomalies using ARIMA_PLUS time series models in the (historical) training data or in new input data. Here are some examples of when might you want to detect anomalies with time-series data:
Detecting anomalies in historical data:
- Cleaning up data for forecasting and modeling purposes, e.g. preprocessing historical time series before using them to train an ML model.
- When you have a large number of retail demand time series (thousands of products across hundreds of stores or zip codes), you may want to quickly identify which stores and product categories had anomalous sales patterns, and then perform a deeper analysis of why that was the case.
Forward looking anomaly detection:
- Detecting consumer behavior and pricing anomalies as early as possible: e.g. if traffic to a specific product page suddenly and unexpectedly spikes, it might be because of an error in the pricing process that leads to an unusually low price.
- When you have a large number of retail demand time series (thousands of products across hundreds of stores or zip codes), you would like to identify which stores and product categories had anomalous sales patterns based on your forecasts, so you can quickly respond to any unexpected spikes or dips.
How do you detect anomalies using ARIMA_PLUS? Begin by creating an ARIMA_PLUS time series model:
Language: SQL
CREATE OR REPLACE MODEL mydataset.my_arima_plus_modelOPTIONS(MODEL_TYPE='ARIMA_PLUS',TIME_SERIES_TIMESTAMP_COL='date',TIME_SERIES_DATA_COL='total_amount_sold',TIME_SERIES_ID_COL='item_name',HOLIDAY_REGION='US') ASSELECTdate,item_description AS item_name,SUM(bottles_sold) AS total_amount_soldFROM`bigquery-public-data.iowa_liquor_sales.sales`GROUP BYdate,item_nameHAVINGdate BETWEEN DATE('2016-01-04') AND DATE('2017-06-01')AND item_name IN ("Black Velvet", "Captain Morgan Spiced Rum","Hawkeye Vodka", "Five O'Clock Vodka", "Fireball Cinnamon Whiskey");
To detect anomalies in the training data, use ML.DETECT_ANOMALIES with the model obtained above:
Language: SQL
SELECT*FROMML.DETECT_ANOMALIES(MODEL `mydataset.my_arima_plus_model`,STRUCT(0.8 AS anomaly_prob_threshold));

To detect anomalies in new data, use ML.DETECT_ANOMALIES and provide new data as input:
Language: SQL
WITHnew_data AS (SELECTdate,item_description AS item_name,SUM(bottles_sold) AS total_amount_soldFROM`bigquery-public-data.iowa_liquor_sales.sales`GROUP BYdate,item_nameHAVINGdate BETWEEN DATE('2017-06-02')AND DATE('2017-10-01')AND item_name IN ('Black Velvet','Captain Morgan Spiced Rum','Hawkeye Vodka',"Five O'Clock Vodka",'Fireball Cinnamon Whiskey') )SELECT*FROMML.DETECT_ANOMALIES(MODEL `mydataset.my_arima_plus_model`,STRUCT(0.8 AS anomaly_prob_threshold),(SELECT*FROMnew_data));

For more information on anomaly detection with ARIMA_PLUS time series models, please see the documentation here.
Thanks to the BigQuery ML team, especially Abhinav Khushraj, Abhishek Kashyap, Amir Hormati, Jerry Ye, Xi Cheng, Skander Hannachi, Steve Walker, and Stephanie Wang.
Tyson Foods’ Story of Unlocking Opportunities by Integrating Real-time Analytics with AI and BI

6501
Of your peers have already read this article.
3:00 Minutes
The most insightful time you'll spend today!
As data environments become more complex, companies are turning to streaming analytics solutions that analyze data as it’s ingested and deliver immediate, high-value insights into what is happening now. These insights enable decision makers to act in real time to take advantage of opportunities or respond to issues as they occur.
While understanding what is happening now has great business value, forward-thinking companies are taking things a step further, using real-time analytics integrated with artificial intelligence (AI) and business intelligence (BI) to answer the question, “what might happen in the future?” Arkansas-based Tyson Foods has embraced AI/BI analytics to enable predictive insights that unlock new opportunities and drive future growth.
Creating a digital twin for connected intelligence company wide
Before using AI/BI, Tyson’s analytics capabilities consisted of traditional BI solutions focused on KPIs and simplifying data so that humans could understand it. Tyson wanted to leverage its data to uncover ways to improve current processes and grow its business. But with BI alone, Tyson struggled to use data to run the simulations and scenarios essential to make educated decisions. To keep growing, it had to embrace the complexity of its data, building ways to analyze it and use it to inform decision making.
Tyson’s on-premises analytics solutions limited its ability to be aggressive and make intelligent, timely, prescriptive decisions. The solution was to create a digital twin to scale optimizations within business processes, moving from local optimizations to system-wide connected optimizations. Doing so meant shifting entirely to cloud computing, with an initial focus on building the ingestion component of the digital twin platform.
Investing in a digital twin enabled Tyson to accelerate new capabilities like supply chain simulation “what-if” scenarios, prescriptive price elasticity recommendations, and improvement of customer intimacy.
Solving the ingestion problem for faster time to insights
Before its migration to Google Cloud, analytics projects that Tyson suffered from uncertainty over how to obtain the data. This problem was prolific and caused project times to be extended for weeks or even months due to the need to write and support one-off data ingestion processes at the front end. This problem also prevented the IT team from delivering analytics solutions fast enough for the business to take full advantage of them.
To solve this analytics problem, the team created Data Ingestion Compute Engine (DICE). DICE is a Google Cloud-hosted, open-source, cloud-native ingestion platform developed to provide configuration-based, no-ops, code-free ingestion from disparate enterprise data systems, both internal and external. It is centered on three high-level goals:
- Accelerate the speed of delivery of IT analytics solutions
- Enable growth of IT capabilities to produce meaningful insight
- Reduce long-term total cost of ownership for ingestion solutions
Creating DICE ingestion platform with Google Cloud services
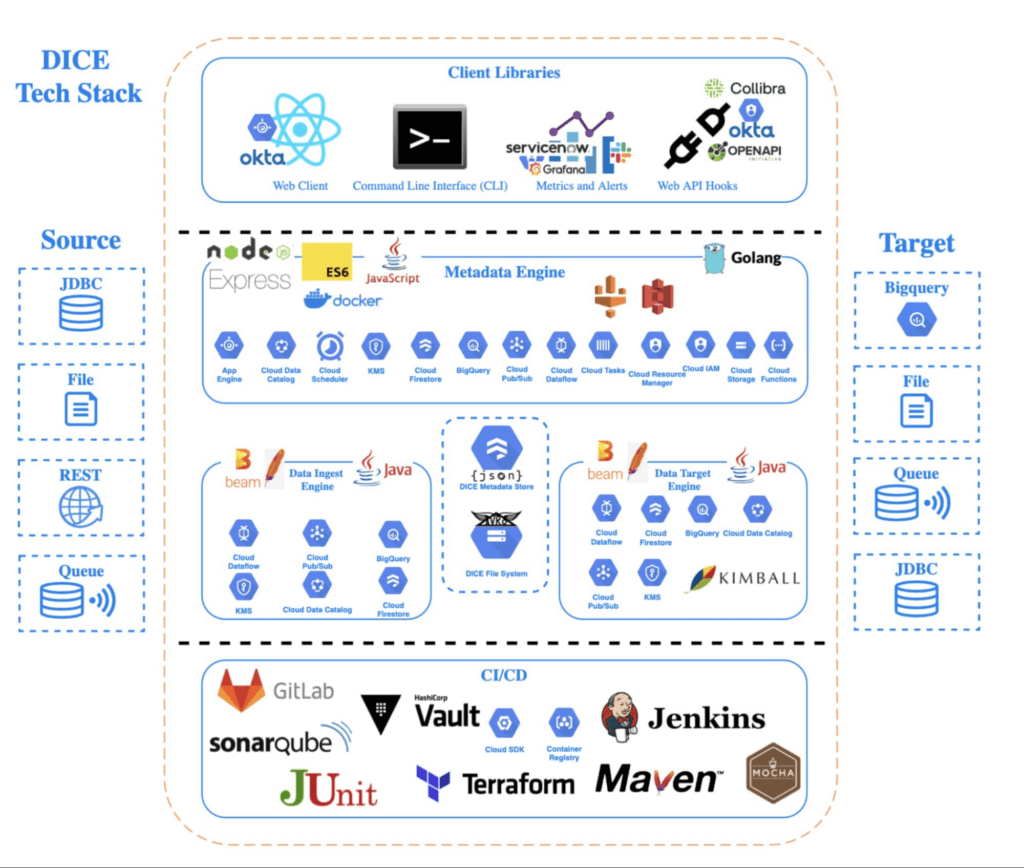
Teams use DICE to set up secure data ingestion jobs in minutes without having to manage complex connections or write, deploy, and support their own code. DICE enables unbound scale, highly parallel processing, DevSecOps, open source, and the implementation of Lambda Data Architecture.
A DICE job is the logical unit of work in the DICE platform, consisting of immutable and mutable configurations persisted as JSON documents stored in Firestore. The job exists as an instruction set for the DICE data engine, which is Apache Beam running Dataflow to instruct which data to pull, how to pull it, how often to pull it, how to process it, when it changes, and where to direct it.
Two of DICE’s primary layers include the metadata engine and the data engine. The metadata engine is responsible for the creation and management of DICE job configuration and orchestration. It is made up of many microservices that interact with multiple Google Cloud services, including the job configuration creation API, job build configuration helper API, and job execution scheduler API.
The data engine is responsible for the physical ingestion of data, the change detection processing of that data, and the delivery of that data to specified targets. The data engine is Java code that uses the Apache Beam unified programming model and runs in Dataflow. It is comprised of streaming, jobs, and Dataflow flex template batch jobs. Logically, the data engine is segmented across three layers: the inbound processing layer, the DICE file system layer, and the target processing layer, which takes the data from the DICE file system and moves it to targets.
Rolling DICE for thousands of ingestion jobs each day
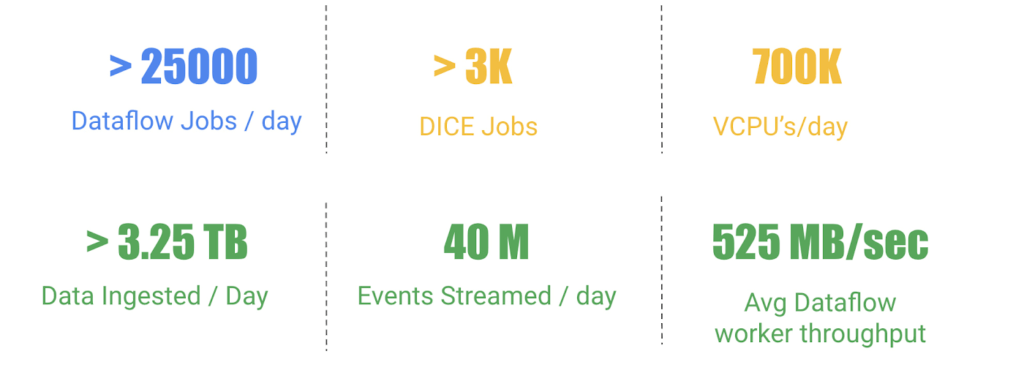
DICE was first deployed to a production environment in November 2019, and just two years later, it has more than 3,000 data ingestion jobs from more than a hundred disparate data systems, both internal and external to Tyson Foods. Most of these jobs run multiple times a day. On a daily basis the DICE environment sees more than 25,000 Dataflow jobs running and an average of 3.25 terabytes of new data being ingested.
DICE supports ingestion from many different types of technologies, including BigQuery, SQL Server, SAP HANA, Postgres, Oracle, MySQL, Db2, various types of file systems, and FTP servers. Additionally, DICE supports target platform technologies for ingestion jobs that include multiple JDBC targets, multiple file system targets, and BigQuery and queue-based store and forward technologies.
The platform continues to see linear growth of DICE jobs, all while keeping platform costs relatively flat. With increasing demand for the platform, Tyson’s IT team is constantly enhancing DICE to support new sources and targets.
This intelligent platform keeps adding new value and makes it simple for Tyson to take advantage of its data. This innovation is a necessity in this fast-changing world of digital business in which companies must transform a high volume of complex data into actionable insight.
IT Team Figures Out Easiest Way to Build Data Pipelines and Create ML Models

14121
Of your peers have already read this article.
5:15 Minutes
The most insightful time you'll spend today!
Building a strong brand in today’s hyper-competitive business environment takes vision. It also requires a flexible, easily managed approach to digital asset management (DAM), so marketing professionals and other stakeholders can easily share, store, track, and manipulate assets to build the brand.
Many of today’s leading companies, including JetBlue, Slack, TripAdvisor, Lyft, and HealthONE, rely on Brandfolder to deliver consistent, organized, and efficient brand experiences. Brandfolder provides an easy-to-use platform that can scale across an entire company with little end-user training, empowering customers to distribute digital assets wherever they are needed. Customers also gain much greater insight into how those assets are used, and how to use them more effectively in marketing campaigns and brand messaging.
“Google Cloud made it easy to build an ML platform to quickly iterate through different brand intelligence use cases and release data-driven product features into the Brandfolder platform.”
—Ajay Rajasekharan, Head of Data Science, Brandfolder
Brandfolder is constantly advancing its development efforts to introduce new data-driven features without complicating the user experience. Big data, artificial intelligence (AI), and machine learning (ML) are key to meeting customers’ unique business needs, and essential for Brandfolder to compete in the fast-moving DAM industry. To enhance these capabilities, Brandfolder sought a public cloud provider that could help it scale its data pipeline cost effectively while providing access to advanced AI technologies.
After graduating from the Techstars startup accelerator program in 2013, Brandfolder tried two other cloud providers before standardizing on Google Cloud Platform (GCP).
“We saw a difference with Google Cloud from the very beginning because the interactions felt like a strategic relationship,” says Jim Hanifen, Head of Product at Brandfolder. “Google gave us startup credits and a lot of face-to-face support, which we hadn’t experienced with other cloud providers. We decided to move our entire infrastructure to Google Cloud Platform.”
Building an ML platform for brand intelligence
After performing an initial lift-and-shift migration of virtual machines (VMs) onto Compute Engine, Brandfolder built an ML platform using GCP managed services to seamlessly deliver its data products. The platform leverages Cloud SQL, Cloud Storage as the data lake, Cloud Dataproc for cloud-native Apache Spark computing clusters, Cloud Composer as the batch job scheduler, Cloud Pub/Sub as the backbone data pipeline, Container Registry to store Docker images, and Google Kubernetes Engine (GKE) as the application orchestrator. Cloud Dataflow brings data into the data lake and into BigQuery for analysis.
“Google Cloud made it easy to build an ML platform to quickly iterate through different brand intelligence use cases and release data-driven product features into the Brandfolder platform,” says Ajay Rajasekharan, Head of Data Science at Brandfolder, who describes the architecture in a detailed blog. “We simply ingest raw application and event data on one end and output an ML service on the other.”
“Moving to Google Cloud Platform allows us to complete more sophisticated data analysis and ML models much faster, and at a much lower cost. We can create brand-specific ML models 12x faster and get them into production quickly to address our customers’ unique business needs.”
—Brett Nekolny, Head of Engineering, Brandfolder
For many general use cases, Brandfolder does not need to build custom ML models, and instead relies on pre-trained API models from GCP. For example, it uses Vision API and Video Intelligence API to auto-tag creative assets on import to enable fast, intuitive searches across images and videos. When more product- and brand-specific modeling is required to address unique customer use cases, Brandfolder builds and trains custom ML models using its GCP pipeline or Cloud AutoML, a suite of products built on Google transfer learning and neural architecture search technology. For example, if a Brandfolder customer makes different types of grills, Brandfolder can use AutoML Vision to train a model to recognize the different grills.
“Moving to Google Cloud Platform allows us to complete more sophisticated data analysis and ML models much faster, and at a much lower cost,” explains Brett Nekolny, Head of Engineering at Brandfolder. “We can create brand-specific ML models 12x faster and get them into production quickly to address our customers’ unique business needs.”
Industry-leading security and performance
Google Cloud’s security model helps Brandfolder give existing and prospective customers peace of mind that their data will be protected. Cloud Identity & Access Management (Cloud IAM) provides enterprise-grade access control, while Cloud Identity-Aware Proxy (Cloud IAP) enables remote users to work more securely without the hassles of a VPN client. GCP also isolates cloud resources into projects, making it easy to assign permissions and keep data and VMs organized and segregated.
“With Google Cloud, everything begins and ends with security, which makes things very easy for us,” says Jim. “If we’re under a security review, we can submit a Google security white paper. If a potential customer has security concerns, we tell them we are hosted on GCP, and those concerns go away.”
To give customers even better application performance for accessing their brand assets, Brandfolder uses Cloud Memorystore, an in-memory data store service for Redis, to cache data and provide sub-millisecond data access for production applications.
“It was much easier for us to use Cloud Memorystore versus running Redis on our compute instances,” says Brett. “The high availability, replication across zones, and automatic failover with no data loss are big for us.”
Global private network interconnects between Google Cloud and the Fastly content delivery network (CDN) dramatically reduce latency, allowing Brandfolder’s customers to deliver and update even very large creative assets quickly around the world.
“What’s beautiful about the relationship between Google and Fastly is that if one of our customers uploads a new version of an asset, we can propagate that out to Fastly, and the new version will automatically show up in all the places where it’s referenced,” says Brett.
“The ability to quickly solve problems with AI has a substantial impact on our revenue, and that’s more apparent every quarter. Few of our competitors are doing product- or brand-specific modeling because it takes a lot of time and resources. We overcame those hurdles with Google Cloud.”
—Jim Hanifen, Head of Product, Brandfolder
Improving employee and customer productivity
Brandfolder also uses Google solutions for real-time collaboration and productivity, using G Suite to connect employees with intuitive, cloud-based apps. Teams use Gmail, Calendar, Docs, Drive, Sheets, Slides, and Hangouts Meet every day to move the business forward. Many of Brandfolder’s customers are also G Suite users, and Brandfolder offers a plug-in that allows them to view their creative assets inside of Docs and pull images in as needed. Customers can also log into Brandfolder with their G Suite credentials, making the solution even easier to use.
“We’ve been using G Suite since the beginning, and it’s helped us collaborate efficiently to build a successful, growing company,” says Jim. “Our teams expect to have that kind of close collaboration, and everyone here enjoys the G Suite experience.”
Driving 99 percent annual business growth
With automated tagging and other innovative AI-based features, Brandfolder is helping customers locate and distribute assets faster. As a result, Brandfolder is building customer loyalty and increasing sales, growing its business by 99 percent year-over-year. Since moving to GCP, Brandfolder has been able to scale its analytics and data pipeline 50x without a corresponding increase in costs and has not had to expand its development team.
“The ability to quickly solve problems with AI has a substantial impact on our revenue, and that’s more apparent every quarter,” says Jim. “Few of our competitors are doing product- or brand-specific modeling because it takes a lot of time and resources. We overcame those hurdles with Google Cloud.”
Wayfair Writes its Success Story with BigQuery for Internal Analytics

4943
Of your peers have already read this article.
4:00 Minutes
The most insightful time you'll spend today!
Editor’s note: Home-goods and furniture giant Wayfair first partnered up with Google Cloud to transform and scale its storefront—work that proved its value many times over during the unprecedented surge in ecommerce traffic during 2020. Today, we hear how BigQuery’s performance and cost optimization have transformed the company’s internal analytics to create an environment of “yes”.
At Wayfair, we have several unique challenges relating to the scale of our product catalog, our global delivery network, and our position in a multi-sided marketplace that supports both our customers and suppliers. To give you a sense of our scale we have a team of more than 3,000 engineers with tens of millions of customers. We supply more than 20 Million items using more than 16,000 supplier partners.
Serving those constituents generates a lot of analytics work. Wayfair runs over a billion ‘analytic’ database queries a year, from both humans and systems, against multi-petabyte datasets. Scaling our previous environment to meet these challenges required us to maintain dozens of copies of data for different use cases and manage complex data synchronization routines to move trillions of records each day, resulting in long development times and high support costs for our analytics projects.
Centralizing our data using Cloud Storage and BigQuery enabled us to break down existing silos and build unified pipelines for our batch and real-time operations. BigQuery shines by letting us decouple our compute and storage resources and flexibly ingest structured data in streaming and batch modes. We also benefit from the same decoupling for more complicated machine learning (ML) workflows in Dataproc and Cloud Storage. In particular, BigQuery is extremely low maintenance. From ML and easy data integrations to the integrated query cache, many out-of-the-box features have proven valuable for multiple use cases.
Beyond storage and compute, Google Cloud offers multiple tools to maximize the value of our data. For example, we can easily connect Data Studio to BigQuery for lightning-fast dashboarding of enterprise KPI reporting. When we need to dive deeper into a metric, Looker provides an interface and semantic model that empowers more business users to answer important questions — without understanding SQL or our vast dataset and table structure.
The combination of all of Google Cloud’s tools enables every Wayfairian the opportunity to self-serve their data visualization and analysis needs. We are able to support all of the requirements of our internal and external users, from descriptive analytics to alerting and ML, in a platform that blends Google’s proprietary technology with open-source standards.we have seen a greater than 90% reduction in the number of analytic queries in production that take more than one minute to run
As a result, we have seen a greater than 90% reduction in the number of analytic queries in production that take more than one minute to run, which delights our users and increases adoption of our analytics tools across the business.
Higher performance means saying “Yes” more often
We went into the BigQuery experience expecting very strong performance on large, aggregate queries and excellent scalability — the kind of performance that could enable consistent 5-15 minute processing queries and 5-10 second response times for large analytics queries.
We weren’t disappointed — we saw slightly better than linear performance profiles as record counts went up from millions to trillions for a flat resource allocation. BigQuery had the expected high performance for aggregate queries. This made our large data processing pipelines predictable and straightforward to maintain and optimize.
Below is a plot of gigabytes processed by a query against query run time in seconds; outliers are filtered and the axes are pruned to ranges where we had a large sample size. This focuses on longer-duration queries. As an example of the linear performance, a 2 terabyte query averages 5 minutes — 2.5min/terabyte — and an 18 terabyte query (9 times as much data) averages 25s — only 1.4min/terabyte. This is despite the fact that complex queries [sorting and analytic functions are particularly problematic] are more common with large data sizes. We do see increasing variability at large sizes as slot limits and other resource constraints come into play, but these factors are controllable and ultimately a business optimization decision.
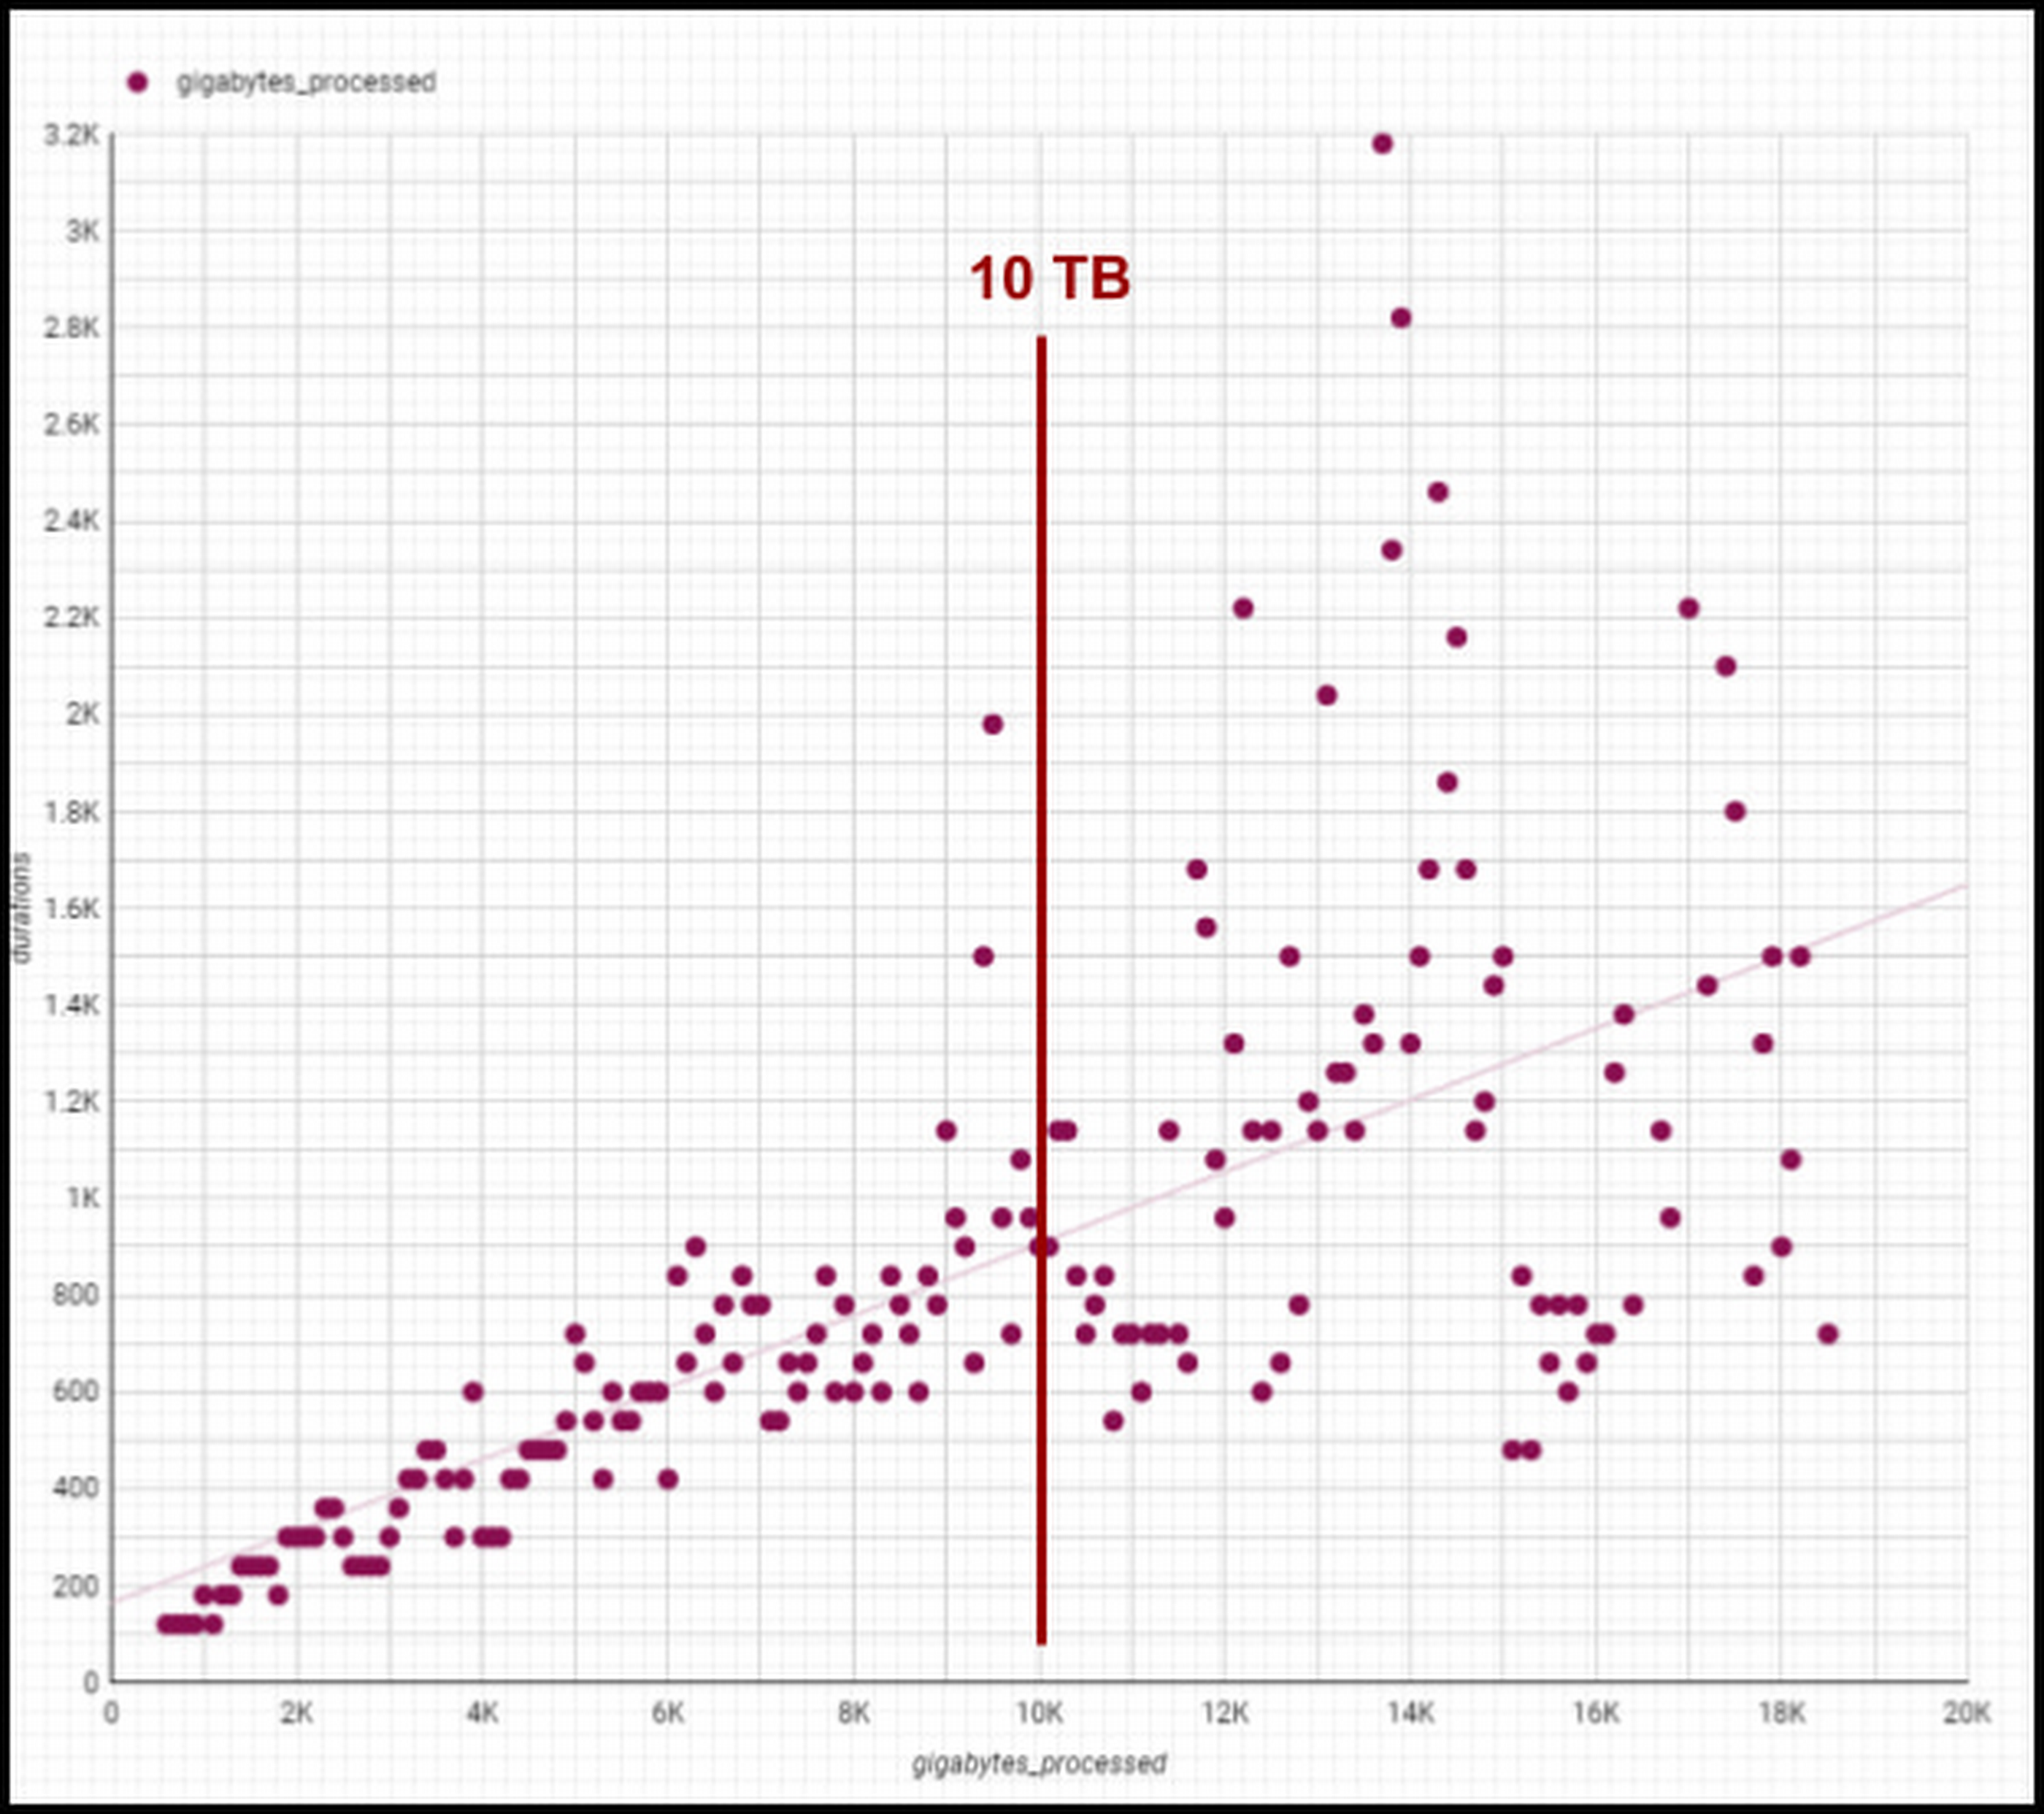
Though individual values vary greatly depending on query complexity [analytic functions/sorting can be computationally expensive], the overall trend line is below 1-1 for bytes versus duration, meaning our BigQuery query runtimes are increasing slower than our data volumes. We are still seeing sub 1:1 threshold runtimes, and we’re already at 100 PB of total data with single queries running on 50PB or more. Going strong!
One unexpected and pleasant surprise has been high performance for smaller queries, such as those required for development, interactive analytics, and internal applications we use for forecasting, segmentation, and other latency-sensitive data workflows. BigQuery’s resource management systems have provided smoother degradation and parallelism profiles than we initially expected for a multi-tenant platform.
We regularly see sub-second p50 query performance for interactive use cases, with p90 performance coming in under 10 seconds for Looker, Data Studio, and AtScale — meeting the threshold we set to avoid analysts losing focus during a business investigation. The chart below shows p50, p90, and p95 timing for core workloads, as well as the number of queries in each bucket and the number of unique users. [Looker and Atscale will use small numbers of service accounts for a large number of users].

This has enabled two important shifts in the way our customers experience analytics services:
- Delivering better user productivity. People no longer have long wait times to get results for a basic query delivering an improved overall user experience.
- Scaling our data transformation. BigQuery has proven, effective data transformation that allows us to embrace the industry shift away towards ELT (extract, load, transform) to transform raw data right within the database.
We no longer have to ask ourselves, “Can we meet the SLA for this data processing task?” The new conversation is, “Of course, we can meet it. What’s the associated cost based on how many resources we assign?” We can make cost and resource trade-offs clear to our users and say “yes” more often to requirements that have measurable business value.
Supporting cost vs. performance decisions
Democratized access to internal analytics is a powerful decision-making tool. With BigQuery’s robust tooling, the decision about how to best allocate computational resources is in the hands of the analytics groups closest to the business decision being made. If they want to spend a sprint optimizing a dashboard, they can show exactly how much money it will save. If they choose not to optimize a report, they can offset the decision with concrete cost savings and other realized value.
Wayfair teams also benefit from visibility into their committed costs by abstracting away the details of the underlying services, including BigQuery slots, the virtual CPUs used to execute SQL queries.
Take a look at this example view consumed by our teams (the metrics for these dashboards are from the BigQuery INFORMATION_SCHEMA (jobs and reservations tables):
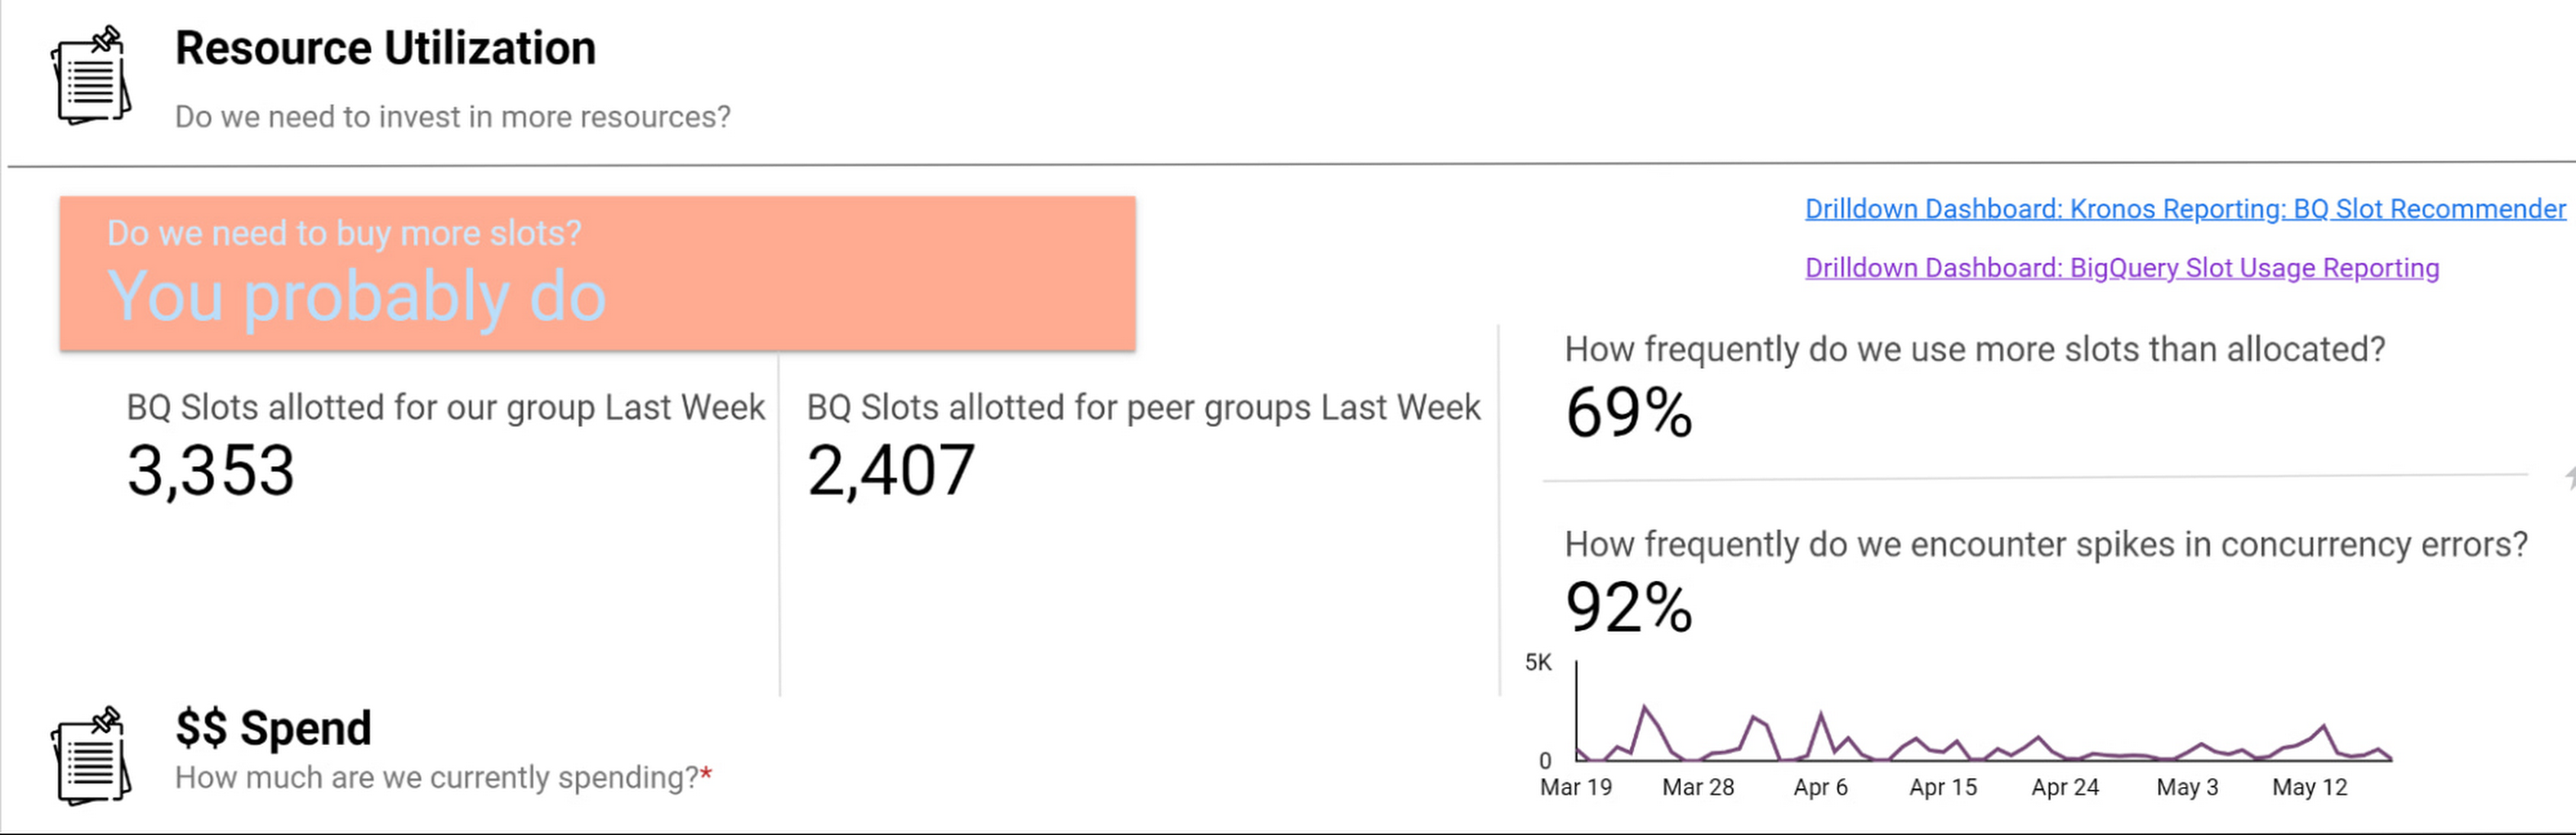
Suppose an organization wants to purchase capacity for a period of time. In that case, we provide an average cost for a slot during that time and charge them based on their slot usage for queries, multiplied by the average price.
Teams can see whether their consumption matches their reservations with a consistent, high-level number. We apply the same approach to tools like Dataproc by aggregating up the costs of component services and providing an organizational cost for those services.
How we use performance signals to improve user efficiency
Instead of overcorrecting for occasional performance fluctuations by allocating excessive resources, we try to align incentives so that people make the right choices for the business. Showback doesn’t work in a vacuum — it requires context and integrated insights. Teams need to show the cost of running a dashboard as well as the ROI is in terms of end user engagement and what peer dashboards with equivalent source datasets might cost.
We want to give users the freedom to do things the way they want and need to while also educating them on achieving their goals and using best practices to reduce their costs and improve their performance. The goal is never for all dashboards to load “less than x seconds” — we believe that any dashboard can load in x seconds when it is properly designed and resourced.
For instance, BigQuery allocates slots for a new workload quickly and efficiently, and queries that are optimized and have dedicated resources consistently complete quickly. When users experience a slowdown, it’s typically because they are sharing resources or inefficiently using their resources. Variable performance is a useful signal to help users discover opportunities to optimize queries and work more productively. We value these signals as we like to focus on the aggregate experience of all users interacting with the tool, not individual interaction.
A natural way to improve user efficiency is to reward ideal behaviors and discourage those that do not align with our analytics strategy. Some examples include splitting out high-demand reporting from ad-hoc exploration to reduce concurrency errors or encouraging people to use materialized tables instead of writing complex custom SQL. For instance, a dedicated reporting project might only include an organization’s Data Studio dashboard if it directly references a table or meets other optimization requirements. Using this approach, we give our users a high degree of freedom and experimentation at the entry-level while providing a well-documented path to scale.
Visibility into query performance improves business performance
The detailed tracking information we get from Google Cloud products is critical — Google’s robust analytics performance has enabled us to scale Data Studio to over 15,000 Wayfarians. Of course, a larger user base always comes with concerns that less sophisticated users may not appropriately optimize their queries or make the best use of the infrastructure.
Evaluating the different Data Studio dashboards helps us identify opportunities to use better query optimization practices, such as reducing custom queries, connecting directly to permanent tables, or using the BI Engine to improve dashboard performance. Recently, our team built new billing projects specific for Data Studio reporting. We can scale up a reservation dedicated to reporting about a major sales event in minutes.
Beyond everyday reporting, holidays and sales events may require higher, guaranteed performance. BigQuery’s flexible capacity commitments allow us to decide at a business level whether an urgent need requires us to reprioritize resources immediately or whether we have the time to optimize queries and rebuild dashboards to be performant. These new billing projects let us evaluate if teams need to scale up resourcing, what areas they can optimize in BigQuery, or if a new reservation is needed to resource that team separately.
Recommendations for achieving high performance at low cost
Are you wondering how to allocate BigQuery slots? Teams must see direct, immediate return on their investment in performance and optimization.
Our first rule of thumb is to align resource utilization with ownership as closely as possible. This makes it easier for teams to secure dedicated resources, even if they start out small. We’re comfortable doing this because BigQuery dynamically reassigns capacity between the targeted reservation and other consumers in milliseconds. We always get the total usage of our slots — there is no wasted capacity even when we break assignments down granularly.
Once a team has a reservation, we provide reporting that consumes various BigQuery information schema views, such as query logs and reservation information, and processes it into aggregated reporting. We look for metrics like the average slots available to a query at a point in time, overall query performance, and how long queries took to execute to pinpoint the overall health of a reservation against our business objectives. Flex slots also let us experiment easily with additional capacity, and BigQuery’s performance is so consistent that we can use straightforward models to estimate return on additional slot investment.
Other key cost optimization tips we have found helpful at Wayfair include:
- Optimize for worst-case performance. Given BigQuery’s ability to share slots, we expect teams will often see much better performance, but we find that thinking it’s more effective when teams think about the most pessimistic case when resourcing their jobs.
- Take advantage of BI Engine reservations. We like to think critically about the data and workload. BI Engine reservations are excellent for workloads that query lots of small dimension tables or a few larger tables loaded into memory. In cases like that, such as with OLAP tools using pre-computed aggregates, we’ve seen BI engine investments drive a 25% reduction in average query time—excellent ROI.
- Leverage Looker for large, longitudinal datasets. Since Looker supports a wide range of use cases, we see a broader range of performance — p50 is still under a second, but p95 can get as high as a minute. For these cases, we recommend modeling user patterns [first of month, first day of week] and dynamically allocating more slots for these periods while deprioritizing batch workloads in the key windows.
- Lean in heavily on the BQ cache for broad-based reporting. To avoid a Monday morning reporting lag, We use the BigQuery cache to avoid Monday morning report loading lags. Up to 30% of our Data Studio queries hit the BQ cache, ensuring our Data Studio p95 consistently stays under 10 seconds.
- Use slots-per-job to improve experience. In our reporting, we find that the most valuable view is slots-per-job. We look for dips in slots available for jobs as this situation often correlates strongly with poor user experiences. For example, our reporting showed us that Looker has the highest volumes of queries and users on Mondays and during each month’s first two business days. We used this information to scale up slots to support these periods of highest demand, delivering on performance SLAs to support business users.

- Get a global picture of usage. We manage slots in a central tool. Teams input their requirements into a calendar to indicate when they want higher or lower capacity to inform our flex slot purchases and annual commitments. It might seem like dozens of relatively inconsistent workloads at the team level, but the picture changes when you look at demand across a week (or our entire business). Understanding global usage makes it easy for us to model baseline capacity recommendations for serving year slots versus flexible demands.
Reaping the rewards of BigQuery
From our first initial undertaking with Google Cloud to transform our storefront, we had a lot of confidence in the underlying technology offerings and the teams that ran them and their ability to meet our unique requirements. But our experience using BigQuery for internal analytics at Wayfair has exceeded our already high expectations.
BigQuery’s fast, dynamic allocation of resources and ability to transform data in place are important to our mission of maintaining consistently high performance for our users while closely managing costs. Moreover, our visibility into query and dashboard performance through BigQuery’s DSP views and other performance metrics have helped us make clearer connections between performance goals and the costs required to meet them — and guide our analysts across the company towards attaining high performance on every project.
Apache and Dataflow Help with Real-time Indices Processing for Financial Institutions
4920
Of your peers have already read this article.
4:00 Minutes
The most insightful time you'll spend today!
Financial institutions across the globe rely on real-time indices to inform real-time portfolio valuations, to provide benchmarks for other investments, and as a basis for passive investment instruments including exchange-traded products (ETPs). This reliance is growing—the index industry dramatically expanded in 2020, reaching revenues of $4.08 billion.
Today, indices are calculated and distributed by index providers with proximity and access to underlying asset data, and with differentiating real-time data processing capabilities. These providers offer subscriptions to real-time feeds of index prices and publish the constituents, calculation methodology, and update frequency for each index.
But as new assets, markets, and data sources have proliferated, financial institutions have developed new requirements. Financial institutions will need to quickly create bespoke and frequently updating indices that represent a specific actual or theoretical portfolio, with its unique constituents and weightings.
In other words, existing index providers and other financial institutions alike will need mechanisms for rapid creation of real-time indices. This blog post’s focus—an index publication pipeline collaboratively developed by CME Group and Google Cloud—is an example of such a mechanism.
The pipeline closely approximates a particular CME Group index benchmark, but with far greater frequency (in near real time vs. daily) than its official counterpart. It does so by leveraging open-source models such as Apache Beam and cloud-based technologies such as Dataflow, which automatically scales pipelines based on inbound data volume.
Machine learning’s production problem
In the past decade, advances in AI toolchains have enabled faster ML model training—and yet a majority of ML models are still not making it into production. As organizations endeavor to develop their ML capabilities, they soon realize that a real-world ML system is comprised of a small amount of ML code embedded in a network of complex and large ancillary components. Each component brings its own development and operational challenges, which are met by bringing a DevOps methodology to the ML system, commonly referred to as MLOps (Machine Learning Operations). To apply ML to business problems, a firm must develop continuous delivery and automation pipelines for ML.
This index publication collaboration is instructive because it demonstrates MLOps best practices for just such a pipeline. One Apache Beam pipeline, suited for operating on both batch and streaming data, extracts insights and packages them for downstream consumers. These consumers may include ML pipelines that, thanks to Apache Beam, require only one code path for inference across batch and real-time data sources. The pipeline is run inside Google Cloud’s Dataflow execution engine, greatly simplifying management of underlying compute resources.
But the collaboration’s value is not constrained to the ML and data science realm. The project shows that consumers of the Apache Beam pipeline’s insights may also include traditional business intelligence dashboards and reporting tools. It also demonstrates the simplicity and economy of cloud-based time series data such as CME Smart Stream, which is metered by the hour, quickly and automatically provisioned, and consumable at a per-product-code (not per-feed) level.
A focus on real-time processing for financial services
To illustrate the above points, the collaboration applies data engineering and MLOps best practices to a financial services problem. We chose the financial services domain because many financial institutions do not yet have real-time market data processing or MLOps capabilities today, owing to a significant gap on either side of their ML/AI objectives.
Upstream from ML/AI models, financial institutions often experience a data engineering gap. For many financial institutions, batch processes have sufficiently addressed business requirements. As a result, the temporal nature of the time series data underlying these processes is deemphasized. For example, the original purpose of most trade booking systems was to capture a trade and ensure that it found its way to the middle and back office for settlement. It was not built with ML/AI in mind, and its underlying data therefore has not been packaged for consumption by ML/AI processes.
And downstream from ML/AI models, financial institutions often encounter the aforementioned “ML production problem.”
As ML/AI becomes ever more strategic, these two gaps have left many financial institutions in a conundrum—unable to train ML models for lack of properly packaged time series data, and unmotivated to package time series data for lack of ML models. By recreating a key energy market index using open-source libraries and cloud-based tools, this collaboration demonstrates that for the financial services domain a solution to this conundrum is more accessible today than ever.
Creating a new index
We modeled our new index after one of CME Group’s many index benchmarks. The particular index expresses the value of a basket of three New York Mercantile Exchange—listed energy futures as a single price. Today, CME Group publishes the index at the end of the day by calculating the settlement price of each underlying futures contract, and then weighing and summing these values.
While CME Group does not currently publish this index in real time, this collaboration aims to create a near real-time solution leveraging Google Cloud capabilities and CME Group market data delivered via CME Smart Stream. However, in order to publish the value so frequently—every five seconds, with 40-second publish latency—this collaboration’s pipeline has to solve a number of challenges in near-real time.
First, the pipeline must process sparse data from three separate trades feeds in memory to create open-high-low-close (OHLC) bars. More specifically, for five-second windows for each of the three front-month (and sometimes second-month) energy contracts, a bar must be produced. This is solved by using the Apache Beam library to implement functions which, when executed on Dataflow, automatically scale out as input load increases. The bars must be time-aligned across the underlying feeds, which is greatly simplified by Beam’s watermark feature. And for intervals in which no tick data is observed, the Beam library is used to pull forward the last value received, yielding perfect gap-free bars for downstream processors.
Second, the pipeline must calculate volume-weighted average price (VWAP) in near real-time for each front-month contract. The VWAP calculations are also written using the Beam API and executed on Dataflow. Each of these functions requires visibility of each element in the time window, so the functions cannot be arbitrarily scaled out. Nonetheless, this is tractable because their input—OHLC bars—is manageably small.
Third, the pipeline must replicate CME Group’s specific settlement price methodology for each contract. The rules specify whether to use VWAP or another source as price, depending on certain conditions. They also specify how to weigh combinations of monthly contracts during a roll period. The pipeline again encapsulates these requirements as an Apache Beam class, and joins the separate price streams at the correct time boundary.
The end result is a new stream publishing bespoke index data to a Google Cloud Pub/Sub topic thousands of times daily, enabling AI models as well as traditional industry index usage, dashboards, and other tools to assist real-time decision making. The stream’s pipeline uses open source libraries that solve common time series problems out-of-the box, and cloud-based services to reduce the user’s operational and scaling burden.

The importance of cloud-based data
The promise of cloud-based pipeline execution services cannot be realized using legacy data access patterns, which often require market data users to colocate and configure servers and network gear. Such patterns inject expense and scaling complexity into the pipeline’s overall operation, diverting resources from the adoption of MLOps best practices. Instead, a newer, cloud-based access pattern—in which resources subscribe to data streams inexpensively, rapidly and programatically—is necessary.
In 2018, CME Group identified the customer need for accessible futures and options market data. CME Group collaborated with Google Cloud to launch CME Smart Stream, which distributes CME Group’s real-time market data across Google Cloud’s global infrastructure with sub-second latency. Any customer with a CME Group data usage license and a Google Cloud project can consume this data for an hourly usage fee, without purchasing and configuring servers and network gear.
CME Smart Stream met this index pipeline’s requirements for cost-effective, cloud-based streaming data, but this is just one use case. Since the launch of a CME Smart Stream offering on Google Cloud, globally dispersed firms have adopted the solution. For example, Coin Metrics has been using the offering to better inform its customers in the crypto markets. According to CME Group, Smart Stream has become popular with new customers as the fastest, simplest way to access CME Group’s market data from anywhere in the world.
Adapt the design pattern to your needs
By combining cloud-based data, open-source libraries, and cloud-based pipeline execution services, we created a real-time index using the same constituents as its end-of-day counterpart. Additionally, financial institutions will find this approach addresses many other challenges—real-time valuation of a large set of portfolios; benchmark creation for new ETPs; or external publication of new indices.
Give it a try
This approach is available to help you meet your organization’s needs. Please review our user guide, whose Tutorials section provides a step-by-step guide to constructing a simple Apache Beam pipeline to generate metrics on streaming data in real-time, and connecting a new data source to the pipeline. We’ll be discussing this topic in CME Group’s webinar End-to-End Market Data Solutions in the Cloud at 10:30 am ET on June 16th.
More Relevant Stories for Your Company


How Modern is Your Data Warehouse? Find Out With This Test
As more and more businesses turn to advanced data analytics to help them make smarter decisions, run real-time analytics, and improve business operations, an increasing number are modernizing their data warehouses to make it all possible. For many businesses, knowing how to modernize means understanding where their data warehouse sits
How Google Cloud’s Scalable Data Storage and High Compute Resources Fuel Investment Research
Investment management is a heavily data-driven industry—portfolio managers and investment researchers require a large number of data sources to guide them in shaping their investment strategies. New cloud capabilities and technologies enable investment managers to process data faster than ever before and iterate on ideas quickly to fuel innovation in

How the City of Memphis Uses Technology to Identify 75 Percent More Potholes
At 340 square miles, the City of Memphis is among the largest in the United States in terms of land area. Memphis has over 6,800 lane-miles of city streets, enough to drive back and forth to Los Angeles four times. Keeping these streets well maintained and safe for citizens and visitors is
