





3258
Of your peers have already watched this video.
2:00 Minutes
The most insightful time you'll spend today!
A Path to Predictable Cloud Costs
Google Cloud’s cost management tools provide the visibility, accountability, control, and intelligence you need so that you can scale your business in the cloud with confidence. Tailored to meet the needs of organizations of all sizes, these tools help reduce complexity and increase the predictability of your cloud costs.
These tools help you gain visibility into your current and forecasted costs, identify cost drivers, and leverage key insights to confidently plan, manage, and optimize your costs with built-in reporting and customizable dashboards.
You can promote a culture of accountability for costs across your organization and better understand your return on cloud investments with flexible options for organizing resources and allocating costs to departments and teams.
3989
Of your peers have already watched this video.
1:20 Minutes
The most insightful time you'll spend today!
Philips Looks to Google Cloud for its Connected Lighting Solution
Philips Lighting wanted to transform the way people use lighting in their homes. The company aimed to connect light bulbs to the Internet, tie them to usage data, and make them interactive in order to offer benefits beyond basic lighting—for creating amazing experiences, home security, or to support well-being, like providing the right light for daily activities.
To do that, Philips Lighting launched Philips Hue connected lighting, designed so people could control their lighting from smartphone apps. But Philips Lighting needed a cloud platform that would let the apps securely access, monitor, and interact with the new lighting system. The company decided to build the backend using Google Cloud Platform.
Google Cloud Platform has dramatically cut the costs and resources required to handle the Philips Hue backend and scales on demand. Philips Lighting runs the platform with 10 times the scale of other similar projects, but with only one-tenth of the workforce.
Watch the video to find out how.
Vodafone Leverages Google Cloud to Aid COVID-19 Frontline with Anonymized Insights on Population Mobility

11185
Of your peers have already read this article.
1:30 Minutes
The most insightful time you'll spend today!
Editor’s note: When Europe’s largest mobile communications company, Vodafone, was asked by the European Commission to help understand population movement across the European Union and the UK to help fight COVID-19, it was able to provide anonymized mobile network-based insights to answer the call. Here’s how Vodafone, with the support of Google Cloud, rapidly mobilized the COVID-19 frontline, while respecting its customers’ privacy.
With the emergence of COVID-19 in early 2020, the European Commission—the executive branch of the European Union (EU)—knew that technology would be instrumental in its fight to control the pandemic. With various lockdowns imposed across its member states, the Commission was keen to predict and prevent the spread of COVID-19 and to manage the related social, political and financial impacts.
Mobile network data helps track COVID-19 across the EU
Mobile networks produce location data, which can be turned into useful anonymous insights to understand population movement within a geographic area. The European Commission, working with mobile industry association GSMA (Groupe Speciale Mobile Association), asked Europe’s major mobile phone operators for help in producing insights to support the fight against COVID-19. As the largest mobile network operator within the EU, Vodafone saw this as a critical opportunity to participate.
Vodafone had previous experience of using mobile network data to support pandemic research. For example, in 2019, Vodafone provided mobility pattern analysis to help track the spread of Malaria in Mozambique. And, during the early stages of the COVID-19 pandemic (prior to working with the European Commission), Vodafone assisted the Italian and Spanish governments in understanding their citizens’ mobility patterns. Vodafone had also previously offered anonymized and aggregated population mobility insights to support public transport and tourism authorities and retail organizations in a number of countries. Consequently, Vodafone was perfectly placed to play a greater role in supporting the European Commission’s response to the pandemic.
When asked to assist the European Commission, Vodafone first considered how it could safely share its data with the governing body without providing details on the individual movements of its customers. It realized it could achieve this through an elaborate set of anonymization and aggregation techniques. Insights are aggregated from a minimum of 50 users and Vodafone only shared these anonymous insights and never the actual raw data with the Commission. As specified by the EU, these insights are then presented onto a large geographical region, typically a city or a county with thousands of people living in that area.
These insights illustrate how people move, helping to determine how lockdowns and self-isolation measures were impacting behaviors.
Using Google Cloud to collate and store population mobility data
In April 2020, Vodafone began migrating its operations, including its mobile data, to Google Cloud on servers in Europe and the UK with elaborate security safeguards, including encryption, building on a previous partnership.
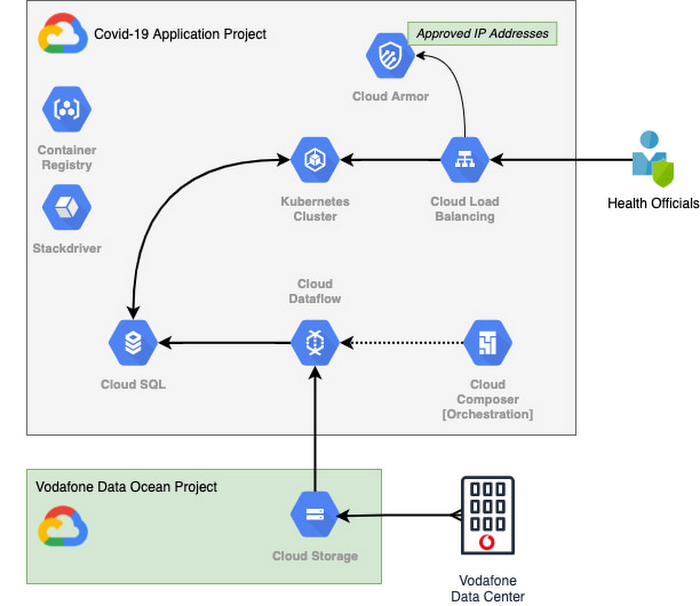
With the data residing in EU and UK data centers and not the United States, Vodafone could then retrieve anonymous insights from Google Cloud Storage instantaneously. Before supplying any information to the European Commission, however, Vodafone used Dataflow to validate the data and run a series of tests to ensure the database had accurate data, before ingesting and archiving the relevant metrics. For instant access, the data was then made available to the European Commission using a Redis database on Google Kubernetes Engine.
To ensure aggregate Vodafone customer data was always safe, secure, and anonymous, all entry points to the front-end were protected behind Google Cloud Armor, where only specific IP addresses were allowed. Using these tools, seamless data pipelines fed in predefined key performance indicators from each specified European market. While data quality measures ensured the definitions for metrics across markets were consistent and could be accurately compared.
The architecture (pictured below) shows how Vodafone integrated and anonymized its data on Google Cloud.
Live interactive dashboard shows population mobility in real-time
With its data integrated on Google Cloud, Vodafone created a live, interactive dashboard to track mobility patterns and share relevant information with the European Commission in real-time.
The European Commission Joint Research Center (JRC) was able to gather valuable information from these insights, which enabled them to see where population mobility was aiding the spread of the disease, when cross-referenced with health data. It could also assess the implications of lockdowns on different populations and forecast cross-country spreading.
Mobile data aids disease modeling for multiple stakeholders
The Vodafone data became instrumental in modeling the likely course of the disease too. For example, the University of Southampton in the UK used it to predict the outcome of different coordinated COVID-19 exit strategies across Europe. This research was published in Science Magazine in September 2020.
The Vodafone data dashboard continues to be used by individual governments, NGOs and organizations to further investigate the impacts of the pandemic and to measure the effectiveness of response strategies alongside the rollout of vaccination programs. The project also helped Vodafone win a DataIQ award for most effective stakeholder engagement.
Using the learnings from this project, Vodafone has been able to adapt its own B2B solution, called Vodafone Analytics, by adaptIng and migrating the code to work in Google Cloud Platform. This solution has been rolled out across Germany, Greece, Portugal and South Africa, and new countries are being onboarded every day. Vodafone Analytics already has more than 100 customers leveraging it for a variety of use cases—Italian fashion retailer OVS, uses it for its smart retail operation, while global real estate company, JLL, uses it to understand the footfall passing through its properties.
Working together, Vodafone and Google Cloud continue to help a range of organizations, governments, and NGOs navigate through the ongoing pandemic, optimize their operations, and help the greater good, without infringing individuals’ fundamental rights to privacy.
To learn more about Google Cloud and Vodafone, watch our full interview here.

5262
Of your peers have already downloaded this article
10:30 Minutes
The most insightful time you'll spend today!
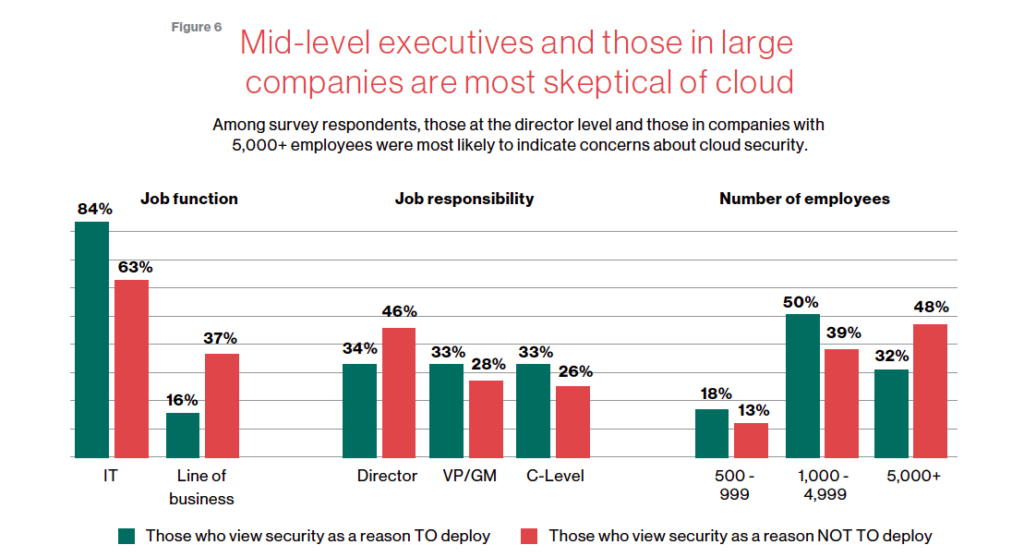
The age of unthinking fears about cloud security is over. Not only is cloud adoption rising steadily across geographies, industries and job functions, but confidence in cloud security is rising as well — to the point where increased security is a major reason enterprises opt for cloud solutions.
Gone are the days when organizations accessed applications and infrastructure over the internet only because it was the least expensive way to scale compute, storage and networking resources as business needs changed. The cloud today is a strategic necessity, with increased agility, integration and speed (as well as security) being the prime drivers of its increased adoption.
This MIT SMR survey of security professionals studies trends in security, which workloads are seeing the highest cloud utilization, the steady growth of comfort with cloud security–and interestingly paints a picture of the executives who are holding out with regards to cloud security.
Download the report now!
Making Weather Predictions Easy with Weather Research and Forecasting (WRF) Models on Google Cloud!

3579
Of your peers have already read this article.
6:00 Minutes
The most insightful time you'll spend today!
Weather forecasting and climate modeling are two of the world’s most computationally complex and demanding tasks. Further, they’re extremely time-sensitive and in high demand — everyone from weekend travelers to large-scale industrial farming operators wants up-to-date weather predictions. To provide timely and meaningful predictions, weather forecasters usually rely on high performance computing (HPC) clusters hosted in an on-premises data center. These on-prem HPC systems require significant capital investment and have high long-term operational costs. They consume a lot of electricity, have largely fixed configurations, and the underlying computer hardware is replaced infrequently.
Using the cloud instead offers increased flexibility, constantly refreshed hardware, high reliability, geo-distributed compute and networking, and a “pay for what you use” pricing model. Ultimately, cloud computing allows forecasters and climate modelers to provide timely and accurate results on a flexible platform using the latest hardware and software systems, in a cost effective manner. This is a big shift compared with traditional approaches to weather forecasting, and can appear challenging. To help, weather forecasters can now run the Weather Research and Forecasting (WRF) modeling system easily on Google Cloud using the new WRF VM image from Fluid Numerics, and achieve the performance of an on-premises supercomputer for a fraction of the price. With this solution, weather forecasters can get a WRF simulation up and running on Google Cloud in less than an hour!
A closer look at WRF
Weather Research and Forecasting (WRF) is a popular open-source numerical weather prediction modeling system used by both researchers and operational organizations. While WRF is primarily used for weather and climate simulation, teams have extended it to support interactions with chemistry, forest fire modeling, and other use cases. WRF development began in the late 1990s through a collaboration between the National Center for Atmospheric Research (NCAR), National Oceanic and Atmospheric Administration (NOAA), U.S. Air Force, Naval Research Laboratory, University of Oklahoma, and the Federal Aviation Administration. The WRF community comprises more than 48,000 users spanning over 160 countries, with the shared goal of supporting atmospheric research and operational forecasting.
The Google Cloud WRF image is built using Google’s MPI best practices for HPC, with the exception that hyperthreading is not disabled by default, and is easily integrated with other HPC solutions on Google Cloud, including SchedMD’s Slurm-GCP. Normally, installing WRF and its dependencies is a time consuming process. With these new WRF VM images, deploying a scalable HPC cluster with WRF v4.2 pre-installed is quick and easy with our Codelab. OpenMPI 4.0.2 was used throughout this work. Google has had good success with Intel MPI, and we intend to study whether further performance gains can be achieved in this context.
Optimizing WRF
Determining the optimal architecture and build settings for performance and cost was a key part of the process in developing the WRF images. We evaluated how to select the ideal compiler, right CPU platform, and the best file system for handling file IO, so you don’t have to. As a test case for assessing performance, we used the CONUS 2.5km benchmark.
Below, the CONUS 2.5km runtime and cost figure shows the run time required for simulating WRF over a two-hour forecast using 480 MPI ranks (a way of numbering processes) for different machine types available on Google Cloud. For each machine type, we’re showing the lowest measured run time from a suite of tests that varied compiler, compiler optimizations, and task affinity.
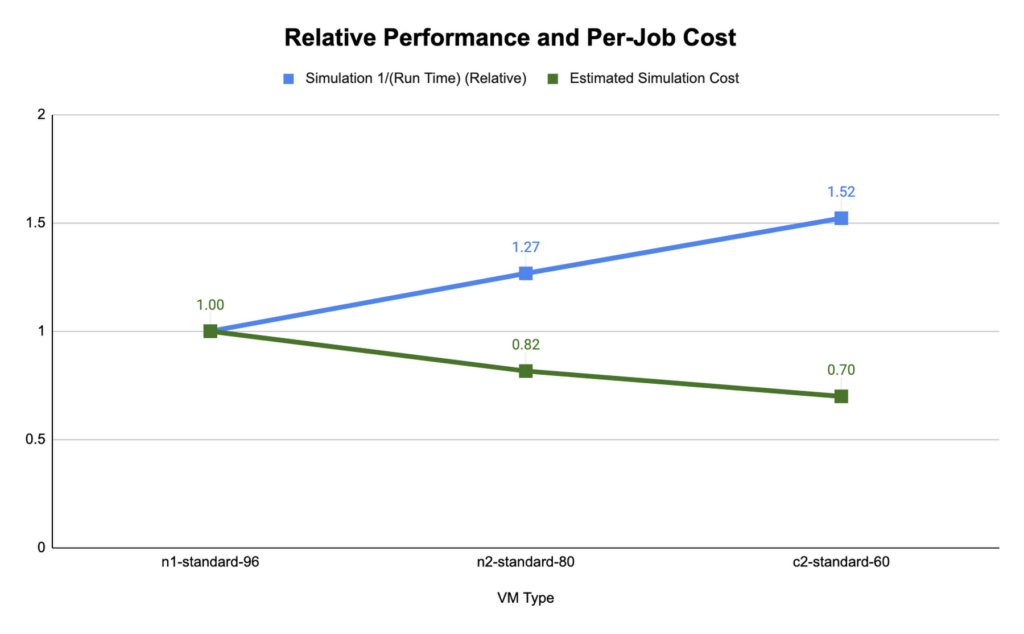
We found that compute-optimized c2 instances provided the shortest run time. The Slurm job scheduler allows you to map the MPI tasks to compute hardware using task affinity flags. When optimizing the runtime and cost for each machine type, we compared using srun –map-by core –bind-to core to launch WRF, which maps each MPI process to a physical core (two vCPU per MPI rank), and srun –map-by thread –bind-to thread, which maps each MPI process to a single vCPU. Mapping by core and binding MPI ranks to cores is akin to disabling hyperthreading.
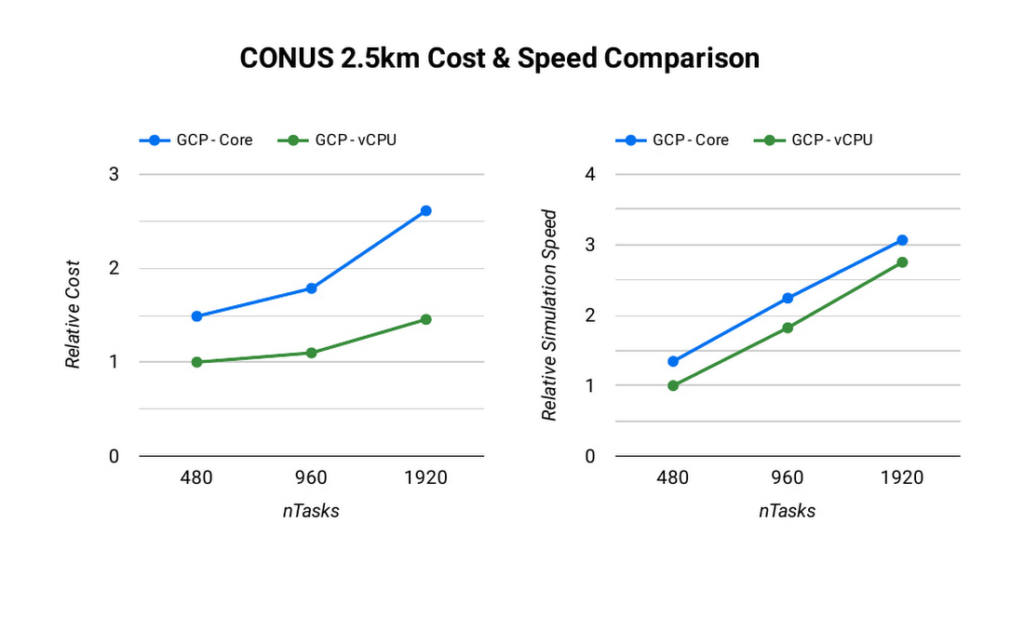
The ideal simulation cost and runtime for CONUS 2.5km for each platform is found when each MPI rank is subscribed to each vCPU. When binding to vCPUs, half as many compute resources are needed when compared to binding to physical cores lowering the per-second cost for the simulation. For CONUS 2.5km, we also found that although mapping MPI ranks to cores results in reduced runtime for the same number of MPI ranks, the performance gains are not significant enough to outweigh the cost savings. For this reason, the WRF-GCP solution does not disable hyperthreading by default.
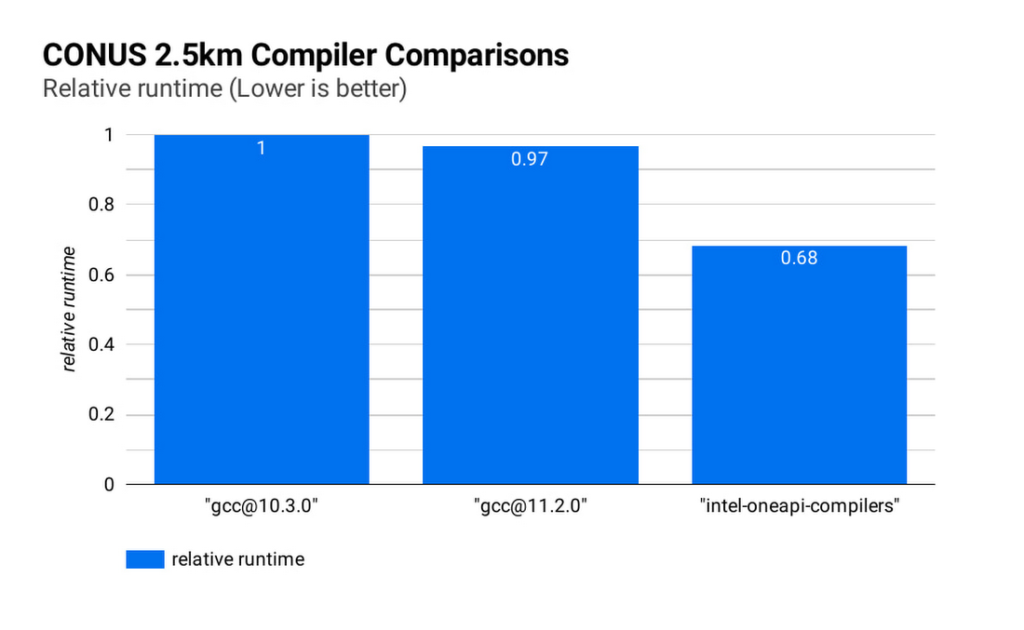
Runtime and simulation cost can be further reduced by selecting an ideal compiler: the figure below (CONUS 2.5km Compiler Comparisons) shows the simulation runtime for the WRF CONUS 2.5km benchmark on eight c2-standard-60 instances, using GCC 10.30, GCC 11.2.0 and the Intel® OneAPI® compilers (v2021.2.0). In all cases, WRF is built using level 3 compiler optimizations and Cascade Lake target architecture flags. By compiling WRF with the Intel® OneAPI® compilers, the WRF simulation runs about 47% faster than the GCC builds, and at about 68% of the cost, on the same hardware. We’ve used OpenMPI 4.0.2 with each of the compilers as the MPI implementation in this work. With other applications, Google has seen good performance with Intel MPI 2018, and we intend to investigate performance comparisons with this and other MPI implementations.
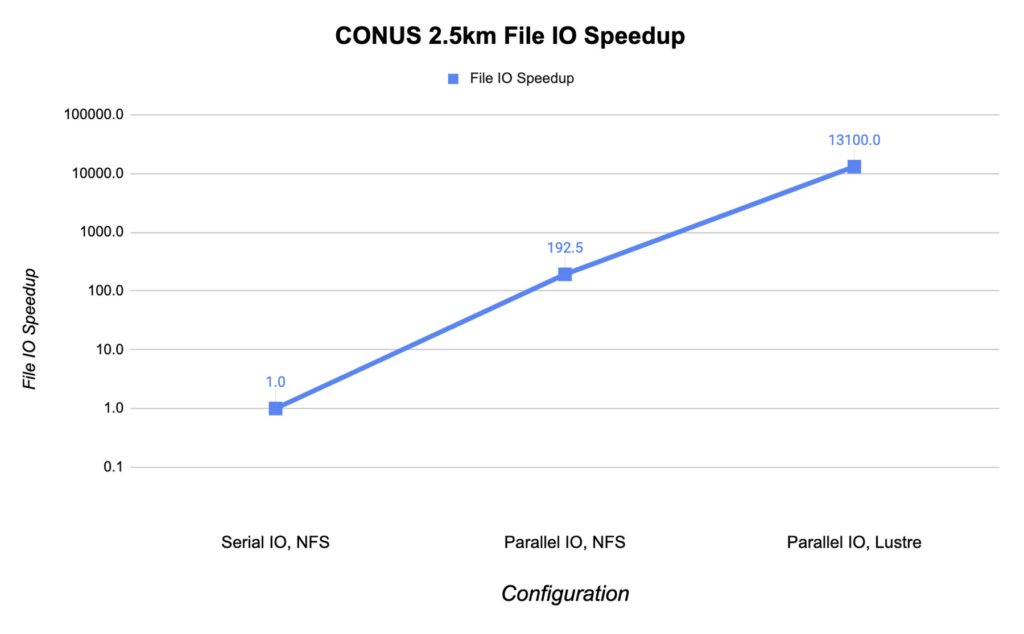
File IO in WRF can become a significant bottleneck as the number of MPI ranks increases. Obtaining the optimal file IO performance requires using parallel file IO in WRF and leveraging a parallel file system such as Lustre.
Below, we show the speedup in file IO activities relative to serial IO on an NFS file system. For this example, we are running the CONUS 2.5km benchmark on c2-standard-60 instances with 960 MPI ranks. By changing WRF’s file IO strategy to parallel IO, we accelerate file IO time by a factor of 60.
We further speed up IO and reduce simulation costs by using a Lustre parallel file system deployed from open-source Lustre Terraform infrastructure-as-code from Fluid Numerics. Lustre is also available with support from DDN’s EXAScaler solution in the Google Cloud Marketplace. In this case, we use four n2-standard-16 instances for the Lustre Object Storage Server (OSS) instances, each with 3TB of Local SSD. The Lustre Metadata Server (MDS) is an n2-standard-16 instance with a 1TB PD-SSD disk. After mounting the Lustre file system to the cluster, we set the Lustre stripe count to 4 so that file IO can be distributed across the four OSS instances. By switching to the Lustre file system for IO, we speed up file IO by an additional factor of 193, which is orders of magnitude faster than a single NFS server with serial IO.
Adding compute resources and increasing the number of MPI ranks reduces the simulation run time. Ideally, with perfect linear scaling, doubling the number of MPI ranks would cut the simulation time in half. However, adding MPI ranks also increases communication overhead, which can increase the cost per simulation. The communication overhead is due to the increased amount of communication necessitated by splitting the problem more finely across more machines.
To assess the scalability of WRF for the CONUS 2.5km benchmark, we can execute a series of model forecasts where we successively double the number of MPI ranks. Below, we show two- hour forecasts on the c2-standard-60 instances with the Lustre file system, varying the number of MPI ranks from 480 to 1920. In all of these runs, MPI ranks are bound to vCPUs so that the number of vCPUs dedicated to each simulation increases with the increase in MPI ranks. While many HPC workloads run best with simultaneous multithreading (SMT) disabled, we find the best performance for CONUS 2.5km with SMT enabled. Thus, the number of MPI ranks in our runs equals the total number of vCPUs.
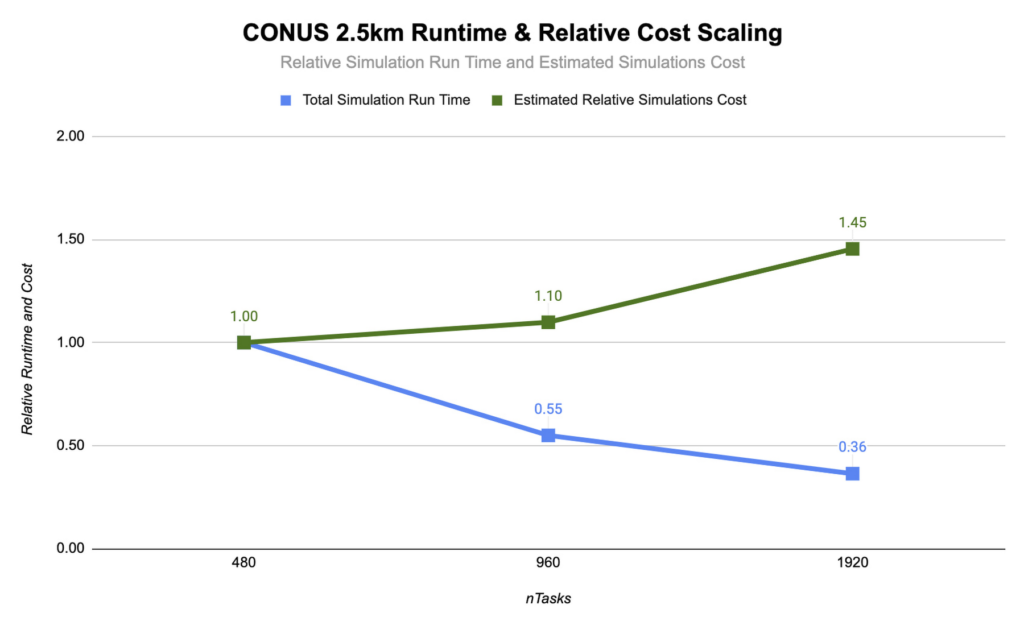
As you can see, the CONUS 2.5km Runtime & Cost Scaling figure shows that the run time (blue bars) decreases as the number of MPI ranks and the amount of compute resources increases, at least up to 1920 ranks. When transitioning from 480 to 960 MPI ranks, the run time drops, yielding a speedup of about 1.8x. Doubling again to 1920 MPI ranks, though, we obtained an additional speedup of just 1.5x. This declining trend in the speedup with increasing MPI ranks is a signature of MPI overhead, which increases with more MPI ranks.
Determining your best fit
Most tightly-coupled MPI applications such as WRF exhibit this kind of scaling behavior, where scaling efficiency decreases with increasing MPI ranks. This makes assessing cost-scaling alongside performance-scaling critical when considering Total Cost of Ownership (TCO). Thankfully, per-second billing on Google Cloud makes this kind of analysis a little bit easier. As shown above, a second doubling of the count from 960 cores to 1920 cores can provide an additional 1.5x speedup, but at a 32% higher cost. In some circumstances, this faster turnaround may be needed and worth the extra cost.
If you want to get started with WRF quickly and experiment with the CONUS 2.5km benchmark, we’ve encapsulated this deployment in Terraform scripts and prepared an accompanying codelab.
You can learn more about Google Cloud’s high performance computing offerings at https://cloud.google.com/hpc, and you can find out more about Google’s partner Fluid Numerics at https://www.fluidnumerics.com.
Delivering 10X Improvement to Risk and Regulatory Reporting Through Cloud and AI
4993
Of your peers have already read this article.
2:30 Minutes
The most insightful time you'll spend today!
Enterprise agility and the ability to innovate, adapt and respond quickly to the ever-changing risk and regulatory landscape is no longer a choice, but the cornerstone of successful digital transformation and commercial growth. Traditional access to and ways of managing data invariably create challenges in dealing with multiple data repositories, reconciliations, fire-drills, etc.
In response, the move to cloud is increasing significantly. It enables risk analytics and regulatory reporting at scale in a secure environment with data storage, management and encryption capabilities as a standard. In addition, as regulatory reporting requirements become more granular, machine learning can help facilitate new insights and allow for risk management to become more embedded into operational processes.
This webinar will address the day-to-day challenges in risk management and regulatory compliance, while also exploring how technological innovations can provide massive improvements and potential.
Key themes
- Real-life data challenges in the eyes of risk managers: can compliance, fraud detection and identifying liquidity positions be improved through the use of AI?
- Innovative approaches to streamline regulatory reporting to derive deeper customer insights from data at the moment of truth.
- Reimagining operations: how to modernise the data infrastructure to accommodate data explosion, drive flexibility and deliver a more cost effective outcome.
More Relevant Stories for Your Company

City of San Jose Ensures Critical Services Reach Community Using AI Translation
San José is one of the most diverse U.S. cities, with residents speaking more than 100 languages. Several years ago, we set out to improve city community interactions through more equitable service management and delivery. This demanded a new approach to automating the intake of requests from a majority population

Forrester and IDC’s Research Confirms Quantifiable Benefits of Running SAP on Google Cloud
Cloud migration is top of mind for most companies with SAP applications. While the advantages of the cloud for SAP customers is generally understood, the move itself can be complicated and disruptive. So what actually are the business benefits and cost savings? How long will it take to recoup such

Beany’s Cloud-Based Accounting Solutions Transform Small Business Finance
Many people start a small business that aligns with their passions, but soon discover the day-to-day running of a business is very different than anticipated. Dealing with accounting, finance, and other daily activities can quickly overwhelm even the most promising of new businesses. Recognizing the unique challenges facing small businesses,

State Of Public Cloud Migration 2020
Although most companies have migrated some infrastructure to public cloud, most enterprise workloads still run in on-premises data centers. Technology leaders want to migrate more workloads and infrastructure to public cloud, but they are frustrated by the process of assessing their existing workloads, identifying a migration strategy that aligns IT
