





6717
Of your peers have already downloaded this article
4:30 Minutes
The most insightful time you'll spend today!
Google Cloud and Univision Partnership to Up the Ante in UX for Spanish-speaking Audience

6879
Of your peers have already read this article.
1:00 Minutes
The most insightful time you'll spend today!
The past year has given everyone lots to think about—about our priorities as people and as businesses. As the world retreated behind closed doors, we saw how shared interests and experiences can bring us together. As the world grappled with a common enemy, we witnessed just how differently individuals, communities and indeed entire countries can experience a situation. And as we faced seemingly unending obstacles to making it through the pandemic, we saw how making smart decisions based on data can drive meaningful solutions—fast.
That’s why we here at Google Cloud are so proud to partner Univision, the country’s leading Spanish-language content and media company. By partnering with Google Cloud, Univision will be able to accelerate growth across its portfolio of properties, deliver an enhanced user experience for Spanish-speaking audiences and provide the enterprise solutions needed to create the Spanish-language media company of the future.
According to Instituto Cervantes, there are over 580 million Spanish language speakers worldwide. Those viewers, like people everywhere, are avid consumers of streaming content. In Q4 of 2020 alone, viewing time for that content increased by 44%1, and in 2020, from 50%2 more sources. With that surge in demand, Univision needed a cloud provider whose infrastructure could reach Hispanic viewers around the world. With two-plus decades spent building out its network and data centers, as well as global content-delivery capabilities, Google Cloud has the infrastructure Univision needs to reach viewers across the Spanish-speaking world.
At the same time, with such a diverse audience for their content, Univision needs to target that content to viewers’ specific preferences. By applying Google Cloud’s artificial intelligence (AI) and machine learning (ML) technology across its content, Univision intends to personalize content based on shows users have previously watched, enhancing their engagement and viewing experience.
And as Univision transforms the user experience, it can use Google Cloud’s data and analytics suite to garner deeper insights into its audience and forge stronger relationships with them on an individual basis. With Looker and BigQuery, Univision employees will have access to real-time data to help them make business decisions about programming.
Univision will also migrate video distribution and production operations to Google Cloud, where we’ll help them streamline media workflows and develop innovative new capabilities. Meanwhile, Google Cloud’s tight business and technical integration with other Google services will help ensure Univision reaches viewers on the device of their choice, wherever they are in the world. For example, in the coming years, Univision will expand its global YouTube partnership and will integrate with entertainment features on Google Search that help people better discover TV shows and movies. The company will also use Google Ad Manager for global ad decisioning and Google’s Dynamic Ad Insertion for PrendeTV and future video-on-demand offerings. Finally, Univision will distribute its content and services on Google Play across Android phones and tablets, as well as Google TV and other Android TV OS devices.
We’re thrilled to partner with Univision to help them reach the Spanish-speaking world with their content. With our cloud portfolio, we can help them reach individual viewers around the world, with personalized content that they can consume however they see fit. Best of all, together, we can help them achieve this vision fast, leveraging established cloud, content delivery, and data analytics technologies. You can learn more about the partnership here.
3278
Of your peers have already watched this video.
5:00 Minutes
The most insightful time you'll spend today!
What is Dataflow?
What is Dataflow, and how can you use it for your data processing needs?
In this episode of Google Cloud Drawing Board, Priyanka Vergadia walks you through Dataflow, a serverless system for processing and enriching data, supporting both streaming and batch models.
Here’s what’s inside:
0:00 – 0:14 Video snapshot
0:15 – 0:57 What is Dataflow
0:58 – 2:23 How does Dataflow work
2:24 – 3:34 How to use Dataflow
3:35 – 3:58 Dataflow security
3:58 – 4:24 What does it cost to use Dataflow
4:25 – 4:55 Dataflow use cases

3471
Of your peers have already downloaded this article
10:30 Minutes
The most insightful time you'll spend today!
As organizations look to revolutionize how they analyze and utilize data, modernizing the data-centric technology stack is critical to success.
Today, the traditional stack poses several challenges—too many steps, too many tools, and too many integrations—all leading to operational complexity, time delays, and high cost. Simplifying the data pipeline, data lifecycle, and data stack offers organizations improved efficiency as well as cost savings, and provides them more value by freeing up resources to focus on deriving insight through the analysis of data.
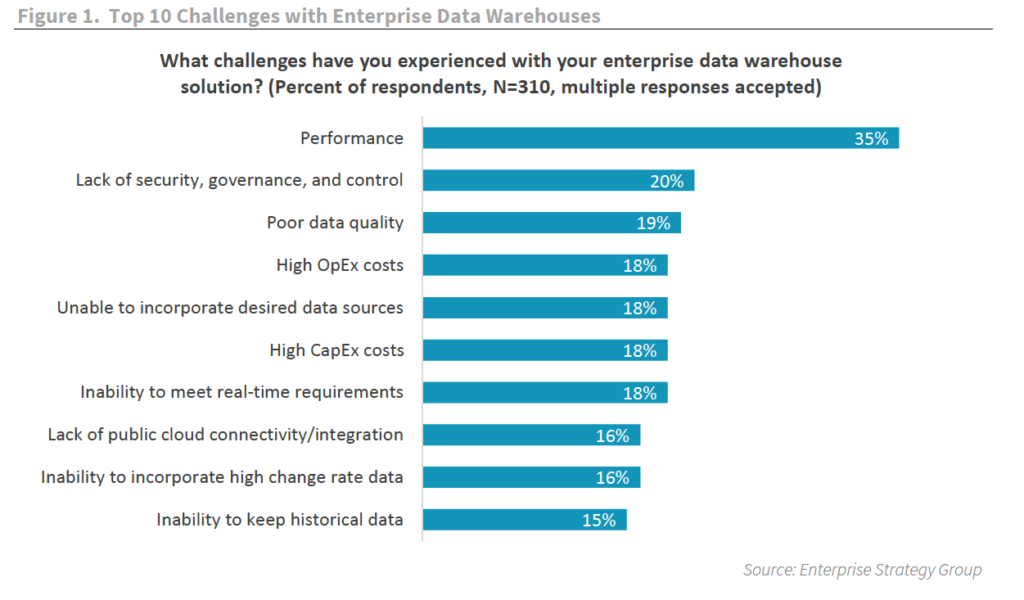
As organizations begin to transform their approach to analytics, modernizing the analytics stack is a top priority.
To address both the data supply and data demand, data teams must look for ways to simplify and optimize the data pipeline. That means transitioning traditional solutions, like data warehouses and business intelligence tools, to modern architectures built with scalability, agility, and availability in mind.
And what follows with a modernized stack is an ideal data experience rich in actionable insight, API-driven application integration, and the ability to address the real-time needs of a dynamic business.
To find out the advantages to modernizing data warehouses and how this can be accomplished, download, ESG’s report: Modernize the Data Stack to Transform the Data Experience.
Predictive Model Built on Google Cloud Helps You Get a 7-day Mosquito Forecast Report!
4770
Of your peers have already read this article.
3:00 Minutes
The most insightful time you'll spend today!
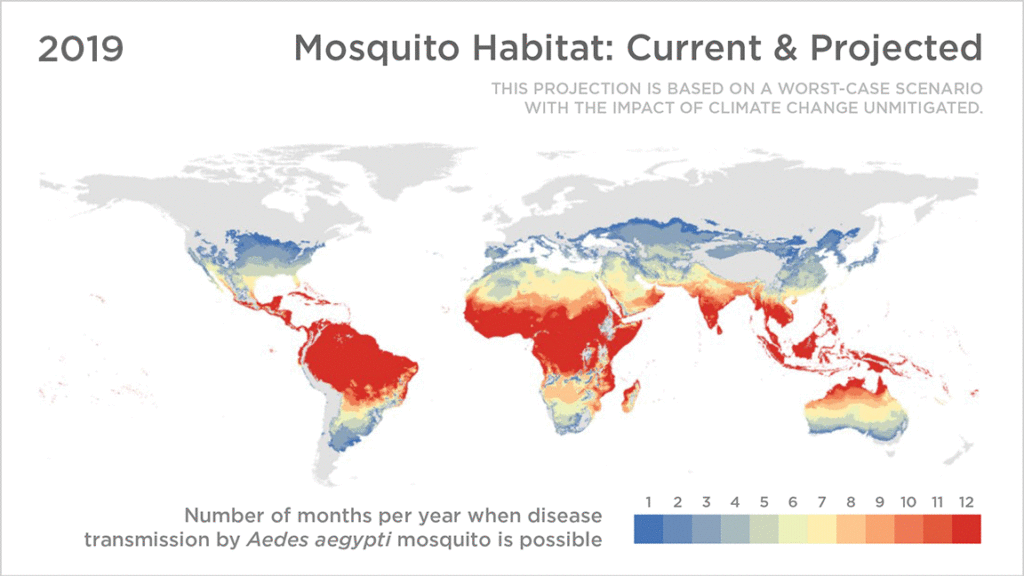
Mosquitoes aren’t just the peskiest creatures on Earth; they infect more than 700 million people a year with dangerous diseases like Zika, Malaria, Dengue Fever, and Yellow Fever. Prevention is the best protection, and stopping mosquito bites before they happen is a critical step.
SC Johnson—a leading developer and manufacturer of pest control products, consumer packaged goods, and other professional products—has an outsized impact in reducing the transmission of mosquito-borne diseases. That’s why Google Cloud was honored to team up with one of the company’s leading pest control brands, OFF!®, to develop a new publicly available, predictive model of when and where mosquito populations are emerging nationwide.
As the planet warms and weather changes, OFF! noticed month-to-month and year-to-year fluctuations in consumer habits at a regional level, due to changes in mosquito populations. Because of these rapid changes, it’s difficult for people to know when to protect themselves. The OFF!Cast Mosquito Forecast™, built on Google Cloud and available today, will predict mosquito outbreaks across the United States, helping communities protect themselves from both the nuisance of mosquitoes and the dangers of mosquito-borne diseases—with the goal of expanding to other markets, like Brazil and Mexico, in the near future.
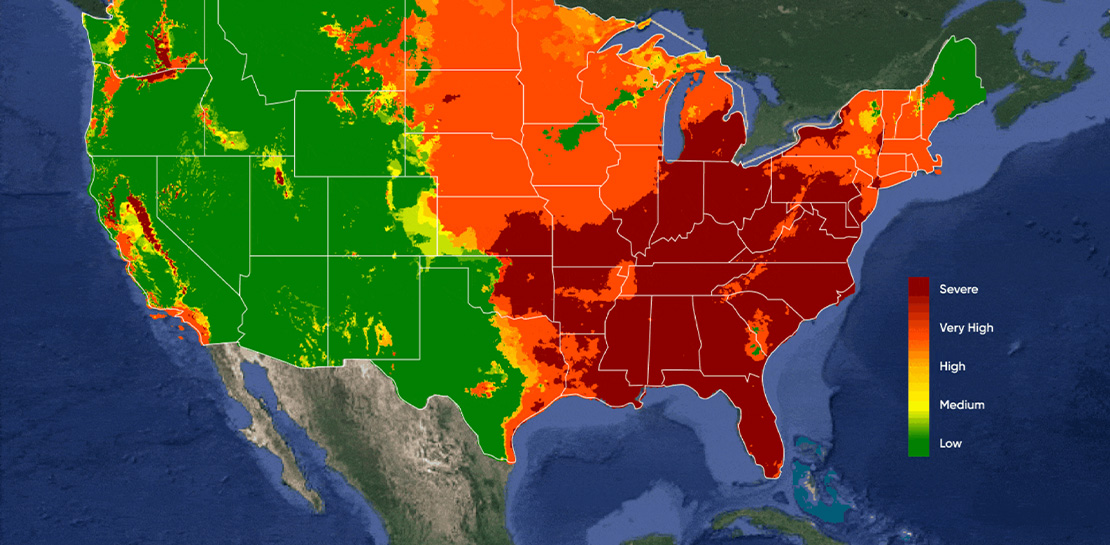
With the OFF!Cast Mosquito Forecast™, anyone can get their local mosquito prediction as easily as a daily weather update. Powered by Google Cloud’s geospatial and data analytics technologies, OFF!Cast Mosquito Forecast is the world’s first public technology platform that predicts and shares mosquito abundance information. By applying data that is informed by the science of mosquito biology, OFF!Cast accurately predicts mosquito behavior and mosquito populations in specific geographical locations.
Starting today, anyone can easily explore OFF!Cast on a desktop or mobile device and get their local seven-day mosquito forecast for any zip code in the continental United States. People can also sign up to receive a weekly forecast. To make this forecasting tool as helpful as possible, OFF! modeled its user interface after popular weather apps, a familiar frame of reference for consumers.
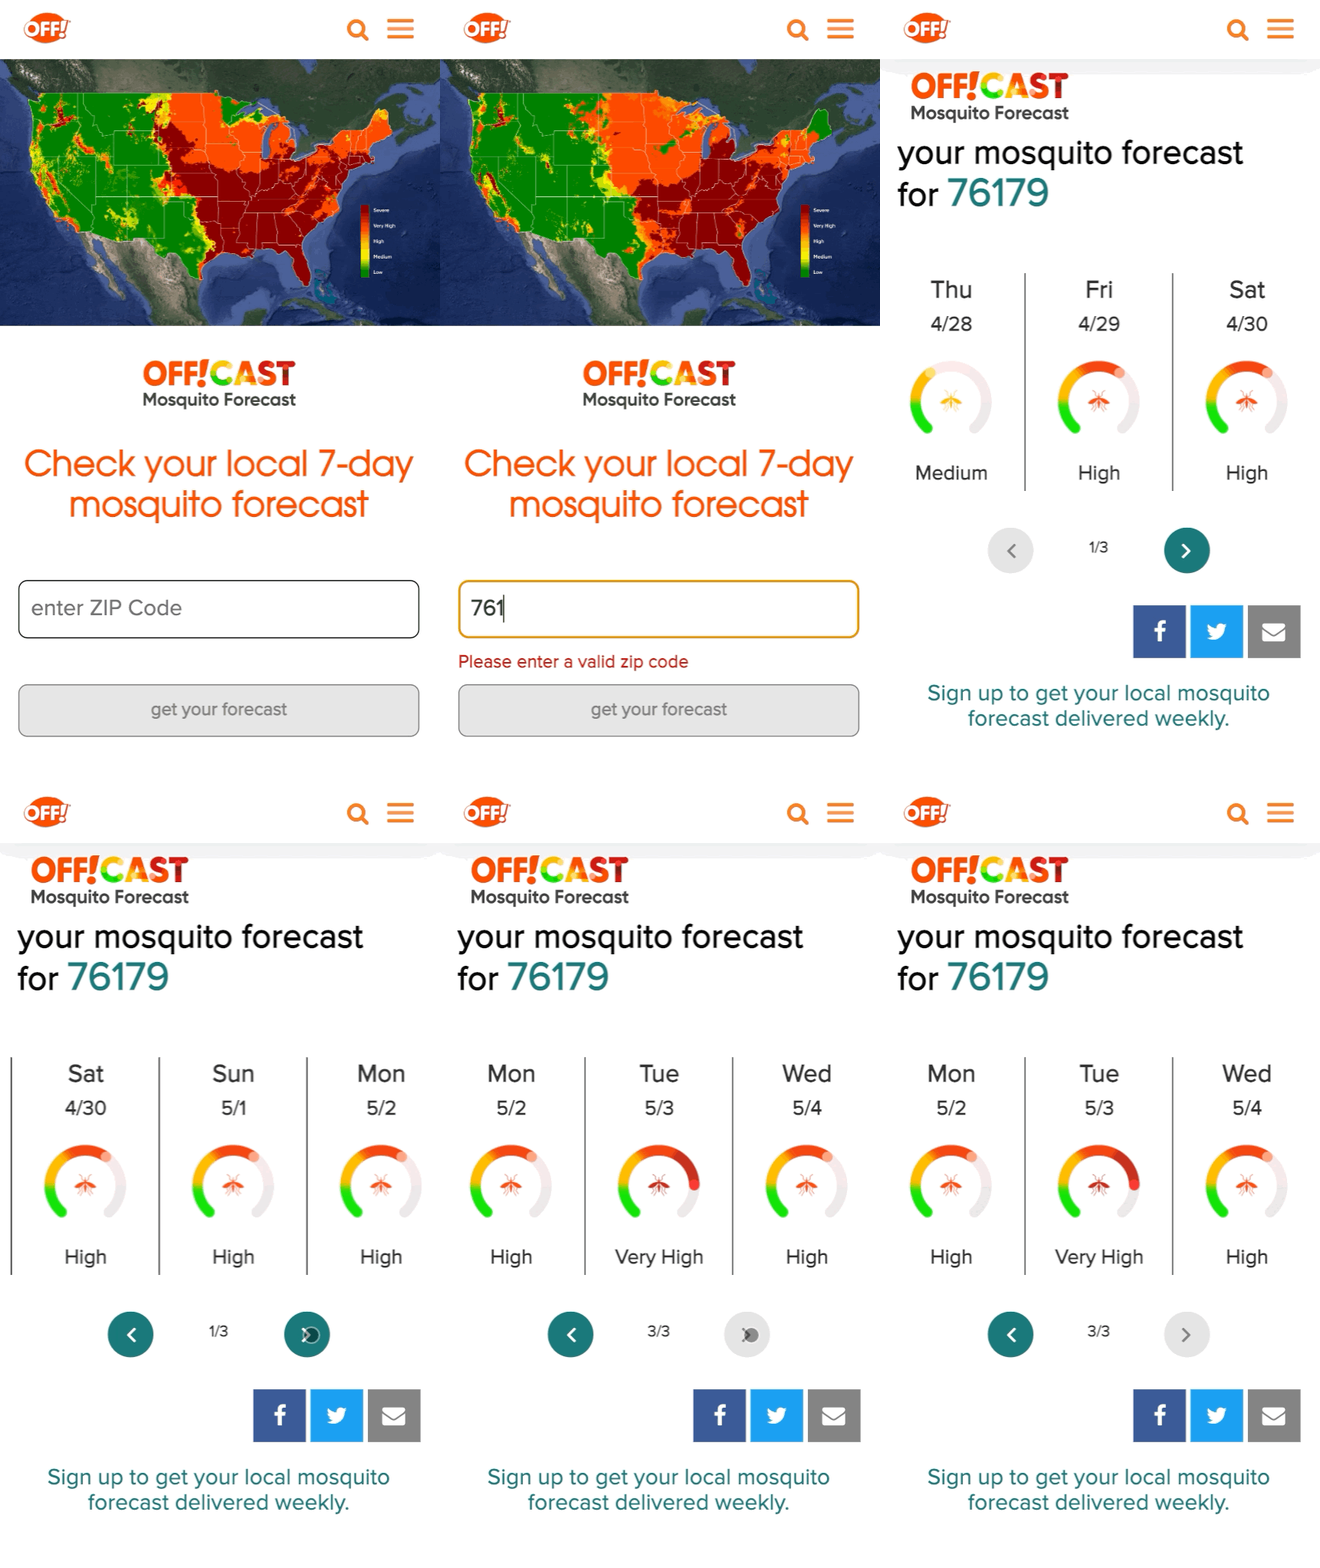
The technology behind the OFF!Cast Mosquito Forecast
To create this first-of-its-kind forecast, OFF! stood up a secure and production-scale Google Cloud Platform environment and tapped into Google Earth Engine, our cloud-based geospatial analysis platform that combines satellite imagery and geospatial data with powerful computing to help people and organizations understand how the planet is changing.
The OFF!Cast Mosquito Forecast is the result of multiple data sources coming together to provide consumers with an accurate view of mosquito activity. First, Google Earth Engine extracts billions of individual weather data points. Then, a scientific algorithm co-developed by the SC Johnson Center for Insect Science and Family Health and Climate Engine experts translates that weather data into relevant mosquito information. Finally, the collected information is put into the model and distilled into a color-coded, seven-day forecast of mosquito populations. The model is applied to the lifecycle of a mosquito, starting from when it lays eggs to when it could bite a human.
The SC Johnson Center for Insect Science and Family Health is one the world’s leading entomology research centers, studying advanced science of insect biology, insect-borne disease prevention and effective product solutions for consumer use. The science behind brands like OFF! is grounded in knowledge from world-class entomologists who have devoted their careers to SC Johnson’s mission of eradicating diseases like Malaria and Zika.
“We are putting the power in consumers’ hands in providing them with a tool to help predict their exposure and prevent mosquito bites,” said Maude Meier, SC Johnson entomologist. “It’s an exciting time to be working in the field of insect science as we find new opportunities to combine science and technology, like Google Earth Engine, to be a force for good in our mission to prevent the spread of insect-borne diseases.”
It takes an ecosystem to battle mosquitos
Over the past decade, academics, scientists and NGOs have used Google Earth Engine and its earth observation data to make meaningful progress on climate research, natural resource protection, carbon emissions reduction and other sustainability goals. It has made it possible for organizations to monitor global forest loss in near real-time and has helped more than 160 countries map and protect freshwater ecosystems. Google Earth Engine is now available in preview with Google Cloud for commercial use.
Our partner, Climate Engine, was a key player in helping make the OFF!Cast Mosquito Forecast a reality. Climate Engine is a scientist-led company that works with Google Cloud and our customers to accelerate and scale the use of Google Earth Engine, in addition to those of Google Cloud Storage and BigQuery, among other tools. With Climate Engine, OFF! integrated insect data from VectorBase, an organization that collects and counts mosquitoes and is funded by the U.S. National Institute of Allergy and Infectious Diseases.
The model powering the OFF!Cast Mosquito Forecast combines three inputs—knowledge of a mosquito’s lifecycle, detailed climate data inputs, and mosquito population counts from more than 5,000 locations provided by VectorBase. The model’s accuracy was validated against precise mosquito population data collected over six years from more than 33 million mosquitoes across 141 different species at more than 5,000 unique trapping locations.
A better understanding of entomology, especially things like degree days and how they affect mosquito populations, and helping communities take action is critically important to improving public health. Learn more about OFF!Cast Mosquito Forecast and see here to learn more about Google Earth Engine on Google Cloud.
A Comprehensive Guide for Understanding and Optimizing Your Dataflow Costs

1186
Of your peers have already read this article.
3:30 Minutes
The most insightful time you'll spend today!
Dataflow is the industry-leading platform that provides unified batch and streaming data processing capabilities, and supports a wide variety of analytics and machine learning use cases. It’s a fully managed service that comes with flexible development options (from Flex Templates and Notebooks to Apache Beam SDKs for Java, Python and Go), and a rich set of built-in management tools. It seamlessly integrates with not just Google Cloud products like Pub/Sub, BigQuery, Vertex AI, GCS, Spanner, and BigTable, but also third-party services like Kafka and AWS S3, to best meet your analytics and machine learning needs.
Dataflow’s adoption has ramped up in the past couple of years, and numerous customers now rely on Dataflow for everything from designing small proof of concepts, to large-scale production deployments. As customers are always trying to optimize their spend and do more with less, we naturally get questions related to cost optimization for Dataflow.
In this post, we’ve put together a comprehensive list of actions you can take to help you understand and optimize your Dataflow costs and business outcomes, based on our real-world experiences and product knowledge. We’ll start by helping you understand your current and near-term costs. We’ll then share how you can continuously evaluate and optimize your Dataflow pipelines over time. Let’s dive in!
Understand your current and near-term costs
The first step in most cost optimization projects is to understand your current state. For Dataflow, this involves the ability to effectively:
- Understand Dataflow’s cost components
- Predict the cost of potential jobs
- Monitor the cost of submitted jobs
Understanding Dataflow’s cost components
Your Dataflow job will have direct and indirect costs. Direct costs reflect resources consumed by your job, while indirect costs are incurred by the broader analytics/machine learning solution that your Dataflow pipeline enables. Examples of indirect costs include usage of different APIs invoked from your pipeline, such as:
- BigQuery Storage Read and Write APIs
- Cloud Storage APIs
- BigQuery queries
- Pub/Sub subscriptions and publishing, and
- Network egress, if any
Direct and indirect costs influence the total cost of your Dataflow pipeline. Therefore, it’s important to develop an intuitive understanding of both components, and use that knowledge to adopt strategies and techniques that help you arrive at a truly optimized architecture and cost for your entire analytics or machine learning solution. For more information about Dataflow pricing, see the Dataflow pricing page.
Predict the cost of potential jobs
You can predict the cost of a potential Dataflow job by initially running the job on a small scale. Once the small job is successfully completed, you can use its results to extrapolate the resource consumption of your production pipeline. Plugging those estimates into the Google Cloud Pricing Calculator should give you the predicted cost of your production pipeline. For more details about predicting the cost of potential jobs, see this (old, but very applicable) blog post on predicting the cost of a Dataflow job.
Monitor the cost of submitted jobs
You can monitor the overall cost of your Dataflow jobs using a few simple tools that Dataflow provides out of the box. Also, as you optimize your existing pipelines, possibly using recommendations from this blog post, you can monitor the impact of your changes on performance, cost, or other aspects of your pipeline that you care about. Handy techniques for monitoring your Dataflow pipelines include:
- Use metrics within the Dataflow UI to monitor key aspects of your pipeline.
- For CPU intensive pipelines, profile the pipeline to gain insight into how CPU resources are being used throughout your pipeline.
- Experience real-time cost control by creating monitoring alerts on Dataflow job metrics which ship out of the box, and that can be good proxies for the cost of your job. These alerts send real-time notifications once the metrics associated with a running pipeline exceeds a predetermined threshold. We recommend that you only do this for your critical pipelines, so you can avoid notification fatigue.
- Enable Billing Export into BiqQuery, and perform deep, ad-hoc analyses of your Dataflow costs that help you understand not just the key drivers of your costs, but also how these drivers are trending over time.
- Create a labeling taxonomy, and add labels to your Dataflow jobs that help facilitate cost attribution during the ad-hoc analyses of your Dataflow cost data using BigQuery. Check out this blog post for some great examples of how to do this.
- Run your Dataflow jobs using a custom Service Account. While this is great from a security perspective, it also has the added benefit of enabling the easy identification of APIs used by your Dataflow job.
Optimize your Dataflow costs
Once you have a good understanding of your Dataflow costs, the next step is to explore opportunities for optimization. Topics to be considered during this phase of your cost optimization journey include:
- Your optimization goals
- Key factors driving the cost of your pipeline
- Considerations for developing optimized batch and streaming pipelines
Let’s look at each of these topics in detail.
Goals
The goal of a cost optimization effort may seem obvious: “reduce my pipeline’s cost.” However, your business may have other priorities that have to be carefully considered and balanced with the cost reduction goal. From our conversations with customers, we have found that most Dataflow cost optimization programs have two main goals:
1. Reduce the pipeline’s cost
2. Continue meeting the service level agreements (SLAs) required by the business
Cost factors
Opportunities for optimizing the cost of your Dataflow pipeline will be based on the key factors driving your costs. While most of these factors will be identified through the process of understanding your current and near term costs, we have identified a set of frequently recurring cost factors, which we have grouped into three buckets: Dataflow configuration, performance, and business requirements.
Dataflow configuration includes factors like:
- Should your pipeline be streaming or batch?
- Are you using Dataflow services like Streaming Engine, or FlexRS?
- Are you using a suitable machine type and disk size?
- Should your pipeline be using GPUs?
- Do you have the right number of initial and maximum workers?
Performance includes factors like:
- Are your SDK versions (Java, Python, Go) up to date?
- Are you using IO connectors efficiently? One of the strengths of Apache Beam is a large library of IO connectors to different storage and queueing systems. Apache Beam IO connectors are already optimized for maximum performance. However, there may be cases where there are trade-offs between cost and performance. For example, BigQueryIO supports several write methods, each of them with somewhat different performance and cost characteristics. For more details, see slides 19 – 22 of the Beam Summit session on cost optimization.
- Are you using efficient coders? Coders affect the size of the data that needs to be saved to disk or transferred to a dedicated shuffle service in the intermediate pipeline stages, and some coders are more efficient than others. Metrics like total shuffle data processed and total streaming data processed can help you identify opportunities for using more efficient coders. As a general rule, you should consider whether the data that appears in your pipeline contains redundant data that can be eliminated by both filtering out unused columns as early as possible, and using efficient coders such as AvroCoder or RowCoder. Also, remember that if stages of your pipeline are fused, the coders in the intermediate steps become irrelevant.
- Do you have sufficient parallelism in your pipeline? The execution details tab, and metrics like processing parallelism keys can help you determine whether your pipeline code is taking full advantage of Apache Beam’s ability to do massively parallel processing (for more details, see parallelism). For example, if you have a transform which outputs a number of records for each input record (“high fan-out transform”) and the pipeline is automatically optimized using Dataflow fusion optimization, the parallelism of the pipeline can be suboptimal, and may benefit from preventing fusion. Another area to watch for is “hot keys.” This blog discusses this topic in great detail.
- Are your custom transforms efficient? Job monitoring techniques like profiling your pipeline and viewing relevant metrics can help you catch and correct your inefficient use of custom transforms. For example, if your Java transform needs to check if the data matches a certain regular expression pattern, then compiling that pattern in the setup method and doing the matching using the precompiled pattern in the “process element” method is much more efficient. The simpler, but inefficient alternative is to use the String.matches() call in the “process element” method, which will have to compile the pattern every time. Another consideration regarding custom transforms is that grouping elements for external service calls can help you prepare optimal request batches for external API calls. Finally, transforms that perform multi-step operations (for example, calls to external APIs that require extensive processes for creating and closing the client for the API) can often benefit from splitting these operations, and invoking them in different methods of the ParDo (for more details, see ParDo life cycle).
- Are you doing excessive logging? Logs are great. They help with debugging, and can significantly improve developer productivity. On the other hand, excessive logging can negatively impact your pipeline’s performance.
Business requirements can also influence your pipeline’s design, and increase costs. Examples of such requirements include:
- Low end-to-end ingest latency
- Extremely high throughput
- Processing late arriving data
- Processing streaming data spikes
Considerations for developing optimized data pipelines
From our work with customers, we have compiled a set of guidelines that you can easily explore and implement to effectively optimize your Dataflow costs. Examples of these guidelines include:
Batch and streaming pipelines:
- Consider keeping your Dataflow job in the same region as your IO source and destination services.
- Consider using GPUs for specialized use cases like deep-learning inference.
- Consider specialized machine types for memory- or compute-intensive workloads.
- Consider setting the maximum number of workers for your Dataflow job.
- Consider using custom containers to pre-install pipeline dependencies, and speed up worker startup time.
- Where necessary, tune the memory of your worker VMs.
- Reduce your number of test and staging pipelines, and remember to stop pipelines that you no longer need.
Batch pipelines:
- Consider FlexRS for use cases that have start time and run time flexibility.
- Run fewer pipelines on larger datasets. Starting and stopping a pipeline incurs some cost, and processing a very small dataset in a batch pipeline can be inefficient.
- Consider defining the maximum duration for your jobs, so you can eliminate runaway jobs, which keep running without delivering value to your business.
Summary
In this post, we introduced you to a set of knowledge and techniques that can help you understand the current and near-term costs associated with your Dataflow pipelines. We also shared a series of considerations that can help you optimize your Dataflow pipelines, not just for today, but also as your business evolves over time. We shared lots of resources with you, and hope that you find them useful. We look forward to hearing about the savings and innovative solutions that you are able to deliver for your customers and your business.
More Relevant Stories for Your Company

ESG Report: Economic Advantages of Google BigQuery OnDemand Serverless Analytics
Traditional big data solutions require a significant upfront investment, ongoing maintenance of hardware and software, and manual provisioning to match compute and storage resources with demand. Google’s serverless analytics warehouse does away with all that extra work, helping businesses focus on what matters most: getting value from their data. Enterprise

Why and How to Migrate to Google BigQuery
Over the past few decades, organizations have mastered the science of data warehousing. They have increasingly applied descriptive analytics to large quantities of stored data, gaining insight into their core business operations. Conventional Business Intelligence (BI), which focuses on querying, reporting, and Online Analytical Processing, might have been a differentiating factor


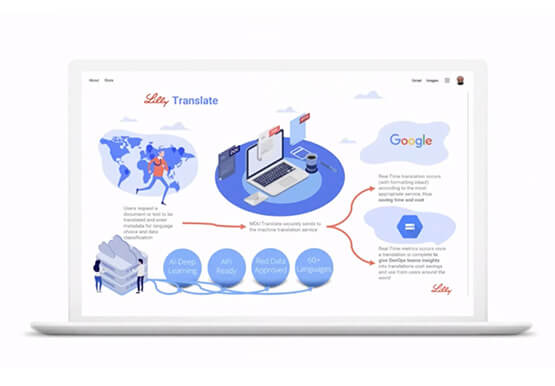

Eli Lilly’s Custom-built Translation Service Leverages Google’s Translation Engine
Eli Lilly leverages Google Cloud's machine translation to globalize content to serve their multilingual employees. Watch the video to learn how the healthcare company built an in-house solution powered by Google Cloud APIs to address the challenge of translating multilingual content at scale. Also explore Google's innovations and investments into

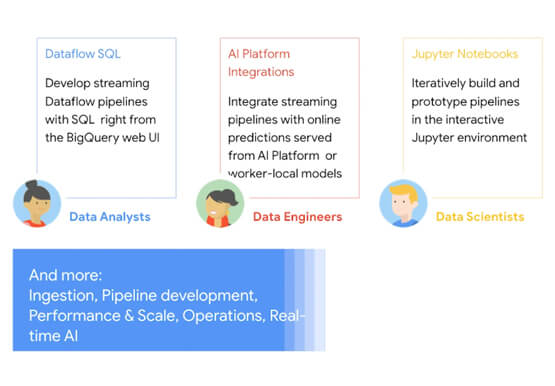
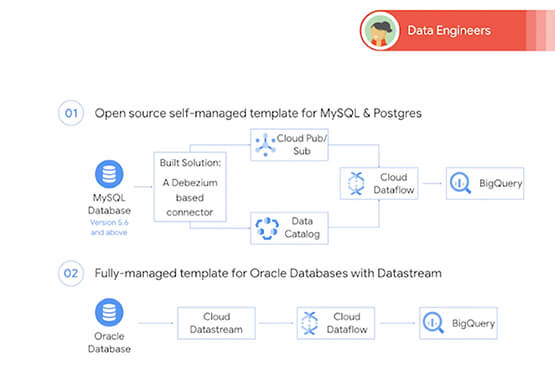
Easy Access to Stream Analytics with Google Cloud
By 2025, more than a quarter of the data created in the global datasphere will be real-time in nature. “This is important because in the real-time world, “the window of opportunity diminishes and goes away really fast. You want to be able to respond to your customer needs, their asks,
