





Why and How to Migrate to Google BigQuery

5366
Of your peers have already read this article.
6:30 Minutes
The most insightful time you'll spend today!
Over the past few decades, organizations have mastered the science of data warehousing. They have increasingly applied descriptive analytics to large quantities of stored data, gaining insight into their core business operations. Conventional Business Intelligence (BI), which focuses on querying, reporting, and Online Analytical Processing, might have been a differentiating factor in the past, either making or breaking a company, but it’s no longer sufficient.
Today, not only do organizations need to understand past events using descriptive analytics, they need predictive analytics, which often uses machine learning (ML) to extract data patterns and make probabilistic claims about the future. The ultimate goal is to develop prescriptive analytics that combine lessons from the past with predictions about the future to automatically guide real-time actions.
Traditional data warehouse practices capture raw data from various sources, which are often Online Transactional Processing (OLTP) systems. Then, a subset of data is extracted in batches, transformed based on a defined schema, and loaded into the data warehouse. Because traditional data warehouses capture a subset of data in batches and store data based on rigid schemas, they are unsuitable for handling real-time analysis or responding to spontaneous queries. Google designed BigQuery in part in response to these inherent limitations.
Innovative ideas are often slowed by the size and complexity of the IT organization that implements and maintains these traditional data warehouses. It can take years and substantial investment to build a scalable, highly available, and secure data warehouse architecture. BigQuery offers sophisticated software as a service (SaaS) technology that can be used for serverless data warehouse operations. This lets you focus on advancing your core business while delegating infrastructure maintenance and platform development to Google Cloud.
BigQuery offers access to structured data storage, processing, and analytics that’s scalable, flexible, and cost effective. These characteristics are essential when your data volumes are growing exponentially—to make storage and processing resources available as needed, as well as to get value from that data. Furthermore, for organizations that are just starting with big data analytics and machine learning, and that want to avoid the potential complexities of on-premises big data systems, BigQuery offers a pay-as-you-go way to experiment with managed services.
With BigQuery, you can find answers to previously intractable problems, apply machine learning to discover emerging data patterns, and test new hypotheses. As a result, you have timely insight into how your business is performing, which enables you to modify processes for better results. In addition, the end user’s experience is often enriched with relevant insights gleaned from big data analysis, as we explain later in this series.
The migration framework
Undertaking a migration can be a complex and lengthy endeavor. Therefore, we recommend adhering to a framework to organize and structure the migration work in phases:
- Prepare and discover: Prepare for your migration with workload and use case discovery.
- Assess and plan: Assess and prioritize use cases, define measures of success, and plan your migration.
- Execute: Iterate the following steps for each use case:
- Migrate (offload): Migrate only your data, schema, and downstream business applications.
- Migrate (full): Alternatively, migrate the use case fully end-to-end. The same as Migrate (offload), with the addition of the upstream data pipelines.
- Verify and validate: Test and validate the migration to assess return on investment.
The following diagram illustrates the recommended framework and shows how the different phases are connected:

For a deeper understanding, read Migrating data warehouses to BigQuery: Introduction and overview

5308
Of your peers have already downloaded this article
7:30 Minutes
The most insightful time you'll spend today!
Sure, machine learning is becoming a business imperative, but how does it work in practice—and what are the benefits for IT managers?
That’s the subject of a new step-by-step guide to solving business and IT problems with artificial intelligence and ML, based on insights gathered by IDG Research Services.
Its publication comes at a time when technology departments face growing pressure to embrace these emerging technologies, yet many have questions about how to get started.
It has real-life examples such as the health services company that used ML to reduce support ticket-resolution time from 48 minutes to six.
In another section, a financial services VP explains that cloud-based ML services enable his company to avoid spending money on computing resources that sit idle.
The guide also includes concrete tips for new ML adopters. For example, a real-estate CIO recommends the use of third-party tools that rely on AI and ML technologies, while a financial services VP highlights the challenge and potential of incorporating unstructured data into ML initiatives.
Download the guide now!
How the City of Memphis Uses Technology to Identify 75 Percent More Potholes

7121
Of your peers have already read this article.
4:30 Minutes
The most insightful time you'll spend today!
At 340 square miles, the City of Memphis is among the largest in the United States in terms of land area. Memphis has over 6,800 lane-miles of city streets, enough to drive back and forth to Los Angeles four times. Keeping these streets well maintained and safe for citizens and visitors is a major priority for the city.
Lots of traffic, lots of roads, and a four-season climate prone to wintertime freeze-thaw-refreeze cycles means the opportunity for potholes. Although the city aims to fill potholes within five business days of notification, it can take longer, especially during winter and early spring. Last year, the city’s Public Works crews repaired some 63,000 potholes, only 20% of which were reported by residents. Approximately 32,000-man-hours each year are spent repairing potholes, with seasonal fluctuations requiring ten to twelve Street Maintenance crews working steadily during the winter months. Still, many went unreported, leading the city to flag pothole request resolution under “needs improvement” on its open data portal website.
Like many large cities, Memphis also struggles with vacant and blighted properties. Nearly 15,000 properties in Memphis are likely vacant, and city officials contend that many are owned by out-of-town investors who live elsewhere and do not take necessary restoration or maintenance steps. These properties can decrease the value of surrounding real estate and discourage new businesses and other residents from moving to an area. Citizen frustration and concerns over the number of blighted properties has made blight eradication a major focus of the City of Memphis.
Historically, residents reported potholes and blighted properties by calling 311, or more recently by using the Memphis 311 app. However, these reports only covered about 20 percent of the problems — often the worst cases. And by the time residents took the initiative to submit a 311 report, they usually weren’t feeling good about the situation.
Recognizing that potholes and vacant properties are often the most visible indicators of whether a city government is doing its job efficiently, Memphis Mayor Jim Strickland and CIO Mike Rodriguez began looking for ways they could apply technology to fix the problems. Mike approached Google for ideas, and Google recommended conducting a machine learning proof-of-concept (POC) with SpringML, a Google Cloud Partner.
“Memphis is focused on easy living, and we want to do everything we can to keep our citizens happy,” says Mike Rodriguez. “Working with Google and SpringML to reduce potholes and urban blight using machine learning and artificial intelligence was an easy decision.”
Bringing machine learning to city operations and budgets
The city’s goal is to detect potholes and abandoned properties by analyzing video footage of roads and residential properties. It wanted to classify potholes by width and depth, and share the information with workers who can repair them. For abandoned properties, it wanted to enable more strategic deployment of resources for homeowners citywide and take action to hold neglectful property owners accountable.
The POC began by training TensorFlow models for ML object detection using preconfigured AI Platform Deep Learning VM Images on Compute Engine. SpringML helped set up cameras and developed a user interface to collect pothole data and automate the 311 ticketing process.
Together, the teams analyzed 30 days of video from a moving city bus and high-resolution video from 360-degree cameras mounted to a code enforcement vehicle, overlaid with data from 311 reports. As the models were refined, accuracy quickly climbed from 50 percent to over 90 percent as models were taught to differentiate a pothole from a manhole cover or other object.
The city also imported routes, potholes, and paving data along with geolocation data from ArcGIS and Google Maps into BigQuery to better understand street conditions and the proximity of potholes to one another. BigQuery also analyzes city property records, tax records, 311 reports, and third-party survey data on-demand to predict where homes are starting to become run down and where neighborhood decay is most likely to occur. The SpringML team created a pilot analysis to begin vacant property protections and developed a user interface tool to interact with the model’s results.
“Google Cloud Platform made it possible for us to experiment with machine learning and artificial intelligence to help solve our city’s problems while working within the budget constraints of a municipal IT organization,” says Mike. “Google turned a ‘nice to have’ into a ‘let’s do this!'”
Identifying 75 percent more potholes
Memphis expects to substantially reduce the number of potholes on its streets, creating a better driving experience for residents and visitors alike. Because drivers won’t be as likely to swerve to miss a pothole, streets will be safer and friendlier to bicycles and scooters. Fewer potholes will also save the city between $10,000 and $20,000 annually in city claims that it pays out in cases where vehicle damage results from a pothole that was not addressed in a timely manner.
“Historically, Public Works has relied primarily upon Street Maintenance crews to proactively locate and fill potholes. As Memphis has over 6,800 lane-miles of public streets, it is a daunting task to reliably survey the entire system in an efficient and systematic way,” says Robert Knecht, Public Works Director for the City of Memphis. “The outcome of the data collected will be invaluable to Public Works so that it can ensure it is managing the city’s street system in a more proactive manner.”
Memphis will be able to better prioritize road maintenance based on condition and impact, increasing the efficiency of its Public Works road crews. Analyzing video of streets also gave the city visibility into issues it wasn’t previously aware of, such as curbs, gutters, and manhole covers that had been mistakenly paved over and need to be excavated. The ML process is easily transferrable to other concerns as well, helping the city identify illegal signs or spools of cable hanging on light posts that could be potentially unsafe.
Helping communities recover and thrive
Memphis is also having success in analyzing predictive trends to combat high rates of abandoned and blighted properties, surpassing 97.5 percent accuracy. “In the past, Public Works experimented with comprehensive, city-wide blight identification by using approximately 200 volunteers to survey and photograph over 237,000 city parcels. This effort was costly, took a long time to complete, and resulted in inconsistent data collection,” says Robert. “Blighted property conditions can change quickly in a city the size of Memphis. Now, with this new technology, Memphis will be able to make a significant difference in the efforts to proactively and comprehensively identify and manage blighted and substandard properties.”
Code Enforcement with better data-driven detection mechanisms enables the city to also identify cases where homeowners are not physically or financially able to keep up with the challenges of homeownership and make them aware of resources that are available to assist them. Memphis Code Enforcement can do a better job of finding people living in derelict properties that pose hazards to inhabitants’ health and safety, and help them fix those problems or find a new place to live.
“Using SpringML and Google Cloud Platform to detect indicators of vacant or blighted properties will help Memphis create safer neighborhoods that will be more attractive to businesses and home buyers,” says Mike. “Property values and employment will go up, crime will go down, and social services can be more focused and effective.”
Revolutionizing service delivery for citizens
Memphis is proving the viability of a cost-effective, cloud-based machine learning model that other cities can follow. The city is already looking into new applications of AI and ML that will further improve city services and help it build a better future for its 652,000 residents.
As part of his commitment to a transparent government, Memphis Mayor Jim Strickland created an open data policy that commits to releasing raw data and sharing it with citizens in a variety of downloadable formats. Going forward, this transparency will help citizens understand how their needs are being served and uncover new, innovative use cases for AI and ML.
“Our goal is to become a smart city, and technologies such as Google Cloud Platform and SpringML put us ahead of the game,” says Mayor Strickland. “Google understands data, and there isn’t a better company to help us analyze our data resources for actionable insights.”
6168
Of your peers have already watched this video.
18:00 Minutes
The most insightful time you'll spend today!
An Overview of Google’s Data Cloud
Data access, management and privacy has been at the center of priorities for enterprises that are aiming to be more agile, reliable and data-driven. Google Cloud’s technology innovations spanning products like BigQuery, Spanner, Looker and VertexAI help organizations navigate the complexities related to siloed data in large volumes sprawled across databases, data lakes, data warehouses, and data marts in multiple clouds and on-premises. Watch the video to learn how companies are building data on Google Cloud for better analysis, security and management to achieve bottomline!
7458
Of your peers have already watched this video.
1:15 Minutes
The most insightful time you'll spend today!
An Indian Example of How to Really Up Your Customer Experience Game and Increase Conversion Rates With AI
How about selfie analysis of users to recommend them the right lipstick color?
That’s just one of the many ideas folks at Purplle.com came up with to improve the buying experience of Indian consumers.
And without the power of Google Cloud, it would probably have remained just that…an idea.
But today, thanks to Google Cloud, “Nothing seems impossible,” says Suyash Katyayani, CTO, Purplle.
Purplle.com is an online e-commerce company in India and one of the pioneers in creating a digitally-native beauty brands in India.
“The beauty industry is so data intensive that we needed to have a strong data strategy and we were looking out for solutions which would enable us to have a strong data pipeline and a strong data warehousing solution,” says Katyayani.
That’s when it turned to Google Cloud.
Additionally, Purplle.com, says Katyayani, does not have to worry about at what scale the company operates at because they have access to state-of-the-art infrastructure from Google Cloud available to them so that their developers can run experiments.
“The biggest plus point for us has been the agility that Google Cloud has added,” says Katyayani.
BigQuery Helps Insurance Firms Leverage Previous Storm Data for Better Pricing Insights

8551
Of your peers have already read this article.
2:00 Minutes
The most insightful time you'll spend today!
It may be surprising to know that U.S. natural catastrophe economic losses totaled $119 billion in 2020, and 75% (or $89.4B) of those economic losses were caused by severe storms and cyclones. In the insurance industry, data is everything. Insurers use data to influence underwriting, rating, pricing, forms, marketing, and even claims handling. When fueled by good data, risk assessments become more accurate and produce better business results. To make this possible, the industry is increasingly turning to predictive analytics, which uses data, statistical algorithms, and machine learning (ML) techniques to predict future outcomes based on historical data. Insurance firms also integrate external data sources with their own existing data to generate more insight into claimants and damages. Google Cloud Public Datasets offers more than 100 high-demand public datasets through BigQuery that helps insurers in these sorts of data “mashups.”
One particular dataset that insurers find very useful is Severe Storm Event Details from the U.S. National Oceanic and Atmospheric Administration (NOAA). As part of the Google Cloud Public Datasets program and NOAA’s Public Data Program, this severe storm data contains various types of storm reports by state, county, and event type—from 1950 to the present—with regular updates. Similar NOAA datasets within the Google Cloud Public Datasets program include the Significant Earthquake Database, Global Hurricane Tracks, and the Global Historical Tsunami Database.
In this post, we’ll explore how to apply storm event data for insurance pricing purposes using a few common data science tools—Python Notebook and BigQuery—to drive better insights for insurers.
Predicting outcomes with severe storm datasets
For property insurers, common determinants of insurance pricing include home condition, assessor and neighborhood data, and cost-to-replace. But macro forces such as natural disasters—like regional hurricanes, flash floods, and thunderstorms—can also significantly contribute to the risk profile of the insured. Insurance companies can leverage severe weather data for dynamic pricing of premiums by analyzing the severity of those events in terms of past damage done to property and crops, for example.
It’s important to set the premium correctly, however, considering the risks involved. Insurance companies now run sophisticated statistical models, taking into account various factors—many of which can change over time. After all, without accurate data, poor predictions can lead to business losses, particularly at scale.
The Severe Storm Event Details database includes information about a storm event’s location, azimuth (an angle measurement used in celestial coordination), distance, impact, and severity, including the cost of damages to property and crops. It documents:
- The occurrence of storms and other significant weather events of sufficient intensity to cause loss of life, injuries, significant property damage, and/or disruption to commerce.
- Rare, unusual weather events that generate media attention, such as snow flurries in South Florida or the San Diego coastal area.
- Other significant weather events, such as record maximum or minimum temperatures or precipitation that occur in connection with another event.
Data about a specific event is added to the dataset within 120 days to allow time for damage assessments and other analysis.
Driving business insights with BigQuery and notebooks
Google Cloud’s BigQuery provides easy access to this data in multiple ways. For example, you can query directly within BigQuery and perform analysis using SQL.
Another popular option in the data science and analyst community is to access BigQuery from within the Notebook environment to intersperse Python code and SQL text, and then perform ad hoc experimentation. This uses the powerful BigQuery compute to query and process huge amounts of data without having to perform the complex transformations within the memory in Pandas, for example.
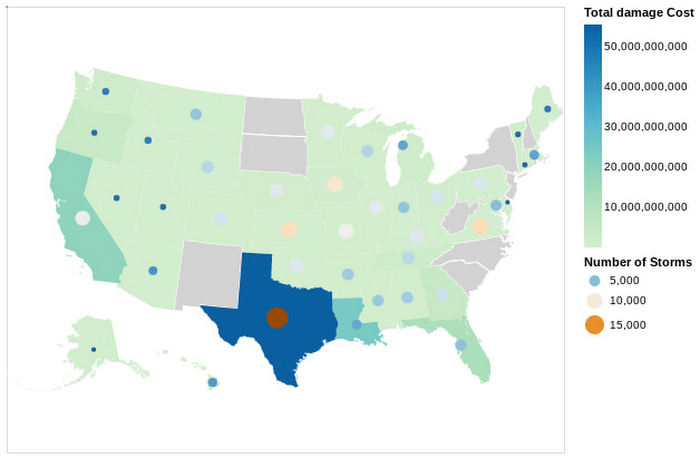
In this Python notebook, we have shown how the severe storm data can be used to generate risk profiles of various zip codes based on the severity of those events as measured by the damage incurred. The severe storm dataset is queried to retrieve a smaller dataset into the notebook, which is then explored and visualized using Python. Here’s a look at the risk profiles of the zip codes:
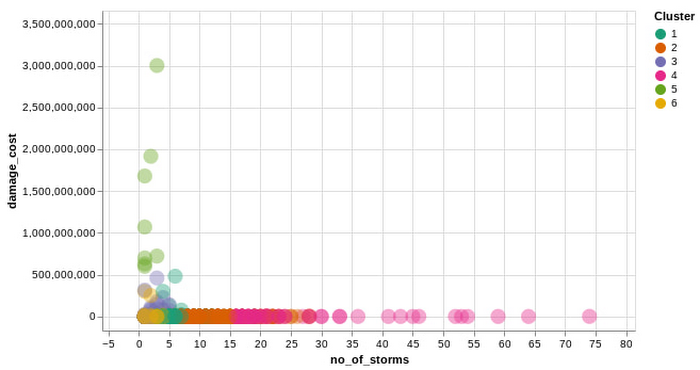
Another Google Cloud resource for insurers is BigQuery ML, which allows them to create and execute machine learning models on their data using standard SQL queries. In this notebook, with a K-Means Clustering algorithm, we have used BigQuery ML to generate different clusters of zip codes in the top five states impacted by severe storms. These clusters show different levels of impact by the storms, indicating different risk groups.
The example notebook is a reference guide to enable analysts to easily incorporate and leverage public datasets to augment their analysis and streamline the journey to business insights. Instead of having to figure out how to access and use this data yourself, the public datasets, coupled with BigQuery and other solutions, provide a well-lit path to insights, leaving you more time to focus on your own business solutions.
Making an impact with big data
Google Cloud’s Public Datasets is just one resource within the broader Google Cloud ecosystem that provides data science teams within the financial services with flexible tools to gather deeper insights for growth. The severe storm dataset is a part of our environmental, social, and governance (ESG) efforts to organize information about our planet and make it actionable through technology, helping people make a positive impact together.
To learn more about this public dataset collaboration between Google Cloud and NOAA, attend the Dynamic Pricing in Insurance: Leveraging Datasets To Predict Risk and Price session at the Google Cloud Financial Services Summit on May 27. You can also check out our recent blog and explore more about BigQuery and BigQuery ML.
More Relevant Stories for Your Company

Architecting and building a data lake on GCP with open source tools
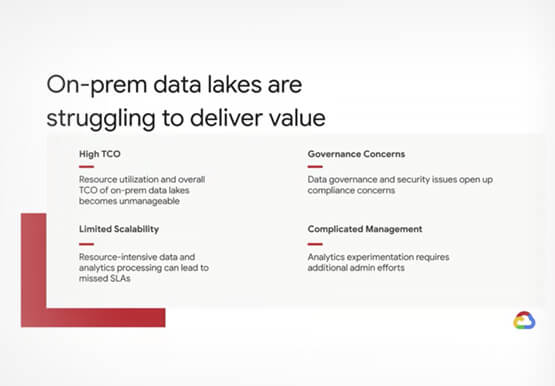
Creating data lakes is often the first step towards maximizing value from data by generating insights for the business. Hadoop data leaks, are today, the most common ones that are found on-premise and many of Google’s customers are moving these to the Google Cloud Platform. And the trend is accelerating.



The Strange Phenomenon AI Revealed at Ride-Hailing Company Go-Jek
Go-Jek, Indonesia’s first billion-dollar startup, has seen an incredible amount of growth in both users and data over the past two years. Many of the ride-hailing company's services are backed by machine learning models hosted on Google Cloud Platform. Models range from driver allocation, to dynamic surge pricing, to food


Setting up Data Pipelines Easily for Streaming and Non-Streaming Data
We live in a world of incessant data. Our phones, factory equipment, smart watches, health devices, and other IoT devices are constantly streaming data. Some of the most popular uses of machine learning and AI are also based on streaming data. Think real-time credit card fraud detection, or software that

How to Build a BI Dashboard With Google Data Studio and BigQuery
For as long as business intelligence (BI) has been around, visualization tools have played an important role in helping analysts and decision-makers quickly get insights from data. In our current era of big data analytics, that premise still holds. To provide an integrated platform for building BI dashboards on top
