





6539
Of your peers have already watched this video.
17:00 Minutes
The most insightful time you'll spend today!
Eli Lilly’s Custom-built Translation Service Leverages Google’s Translation Engine
Eli Lilly leverages Google Cloud’s machine translation to globalize content to serve their multilingual employees. Watch the video to learn how the healthcare company built an in-house solution powered by Google Cloud APIs to address the challenge of translating multilingual content at scale. Also explore Google’s innovations and investments into services for language translations produced for machine learning (also called as machine translation or neural machine translation) for safe and secure documents and text translation via an easy-to-use interface and API.
Home Depot’s Interconnected Retail Experience by Virtue of Google Cloud Migration for SAP Applications

8252
Of your peers have already read this article.
1:30 Minutes
The most insightful time you'll spend today!
With nearly 2,300 stores, The Home Depot is the world’s largest home-improvement chain — a brand that professional contractors and DIYers alike have come to depend on. The home improvement industry continues to experience unprecedented demand and dramatic increases in online ordering accompanied by expanding consumer expectations for things like curbside pickup and same day delivery. The Home Depot’s decision to migrate to cloud-based infrastructure, including the migration of the company’s SAP applications on Google Cloud which began in 2017, has set it up for success in an increasingly digital world, and helped the company adapt to changing market conditions quickly.
Interconnected retail at scale
Building on a strong customer-first philosophy, The Home Depot aims to create what it calls interconnected retail—allowing customers to shop however, whenever, and wherever they want. “So many companies are focused on omni-channel retail,” explains Sam Moses, Vice President of Corporate Systems. “At The Home Depot, we wanted to take it to the next level. Interconnected retail puts the customer at the center of everything and enables them to shop in store, online, or both. Customers can begin a transaction online and continue in-store, or vice-versa.”
To support this strategy, the company’s SAP environment needed to be more agile. Running everything on-premises, from central finance to POS systems, meant that The Home Depot’s IT teams experienced redundancy and repetitive, manual processes. Their data warehouse needed an upgrade to process and analyze growing and increasingly diverse data sets. The Home Depot chose to migrate its SAP environment to Google Cloud to support both the velocity and scale needed for the business as well as critical analytics capabilities needed for its bold digital initiatives. “We chose Google Cloud to support our SAP implementation. Our decision had a lot to do with the relationship between Google Cloud and SAP and also for the applications and services that are offered by Google Cloud, like BigQuery, which are helping to enable data and analytics within our organization,” Moses explains.
After migrating its SAP applications—including S/4HANA, its customer activity repository (CAR), general ledger, e-commerce system, enterprise data warehouse and more to Google Cloud, the company now has the speed, scale and flexibility to tackle enormous spikes in the business, all while staying fully available for their customers. Additionally, The Home Depot was able to transform its financial systems and make them more agile to deliver critical information across multiple business functions in real time.
Maximizing data insights to support customer experiences
By migrating to Google Cloud, The Home Depot is leveraging Google Cloud analytics to build the industry’s most efficient supply chain including more robust demand forecasting, supplier lead times, estimated delivery times and more, all while maintaining better security than before. “We experienced unprecedented change in our customers’ behavior and their buying patterns, which puts a lot of pressure on our supply chain,” explains Moses. “So having the ability to leverage data and analytics gives us insights to know exactly what it is that our customers need.”
The company’s analysts now use BigQuery ML for machine learning directly against the company’s BigQuery data and use AutoML to determine the best model for predictions. The Home Depot’s engineers have also adapted BigQuery to monitor, analyze, and act on application performance data across all its stores and warehouses in real time—capabilities that were not as seamless in the on-premises environment.
With hundreds of projects on Google Cloud, The Home Depot’s cloud journey is well on track, but the company is always looking to the future. “As our customers’ needs have continued to evolve, and as technology has continued to evolve, our relationship with Google will continue to advance — to be able to innovate together, to be able to find new solutions together, to better serve our customers.”
Learn more about how The Home Depot is renovating its retail operation with SAP on Google Cloud.
Discover Latest Resources on Google Cloud’s Datasets Solution

6322
Of your peers have already read this article.
3:00 Minutes
The most insightful time you'll spend today!
Editor’s note: With Google Cloud’s datasets solution, you can access an ever-expanding resource of the newest datasets to support and empower your analyses and ML models, as well as frequently updated best practices on how to get the most out of any of our datasets. We will be regularly updating this blog with new datasets and announcements, so be sure to bookmark this link and check back often.
August 2021
New dataset: Google Cloud Release Notes
- Looking for a new way to access Google Cloud Release Notes besides the docs, the XML feed, and Cloud Console? Check out the Google Cloud Release Notes dataset. With up-to-date release notes for all generally available Google Cloud products, this dataset allows you to use BigQuery to programmatically analyze release notes across all products, exploring security bulletin updates, fixes, changes, and the latest feature releases.
- Access the dataset

July 2021
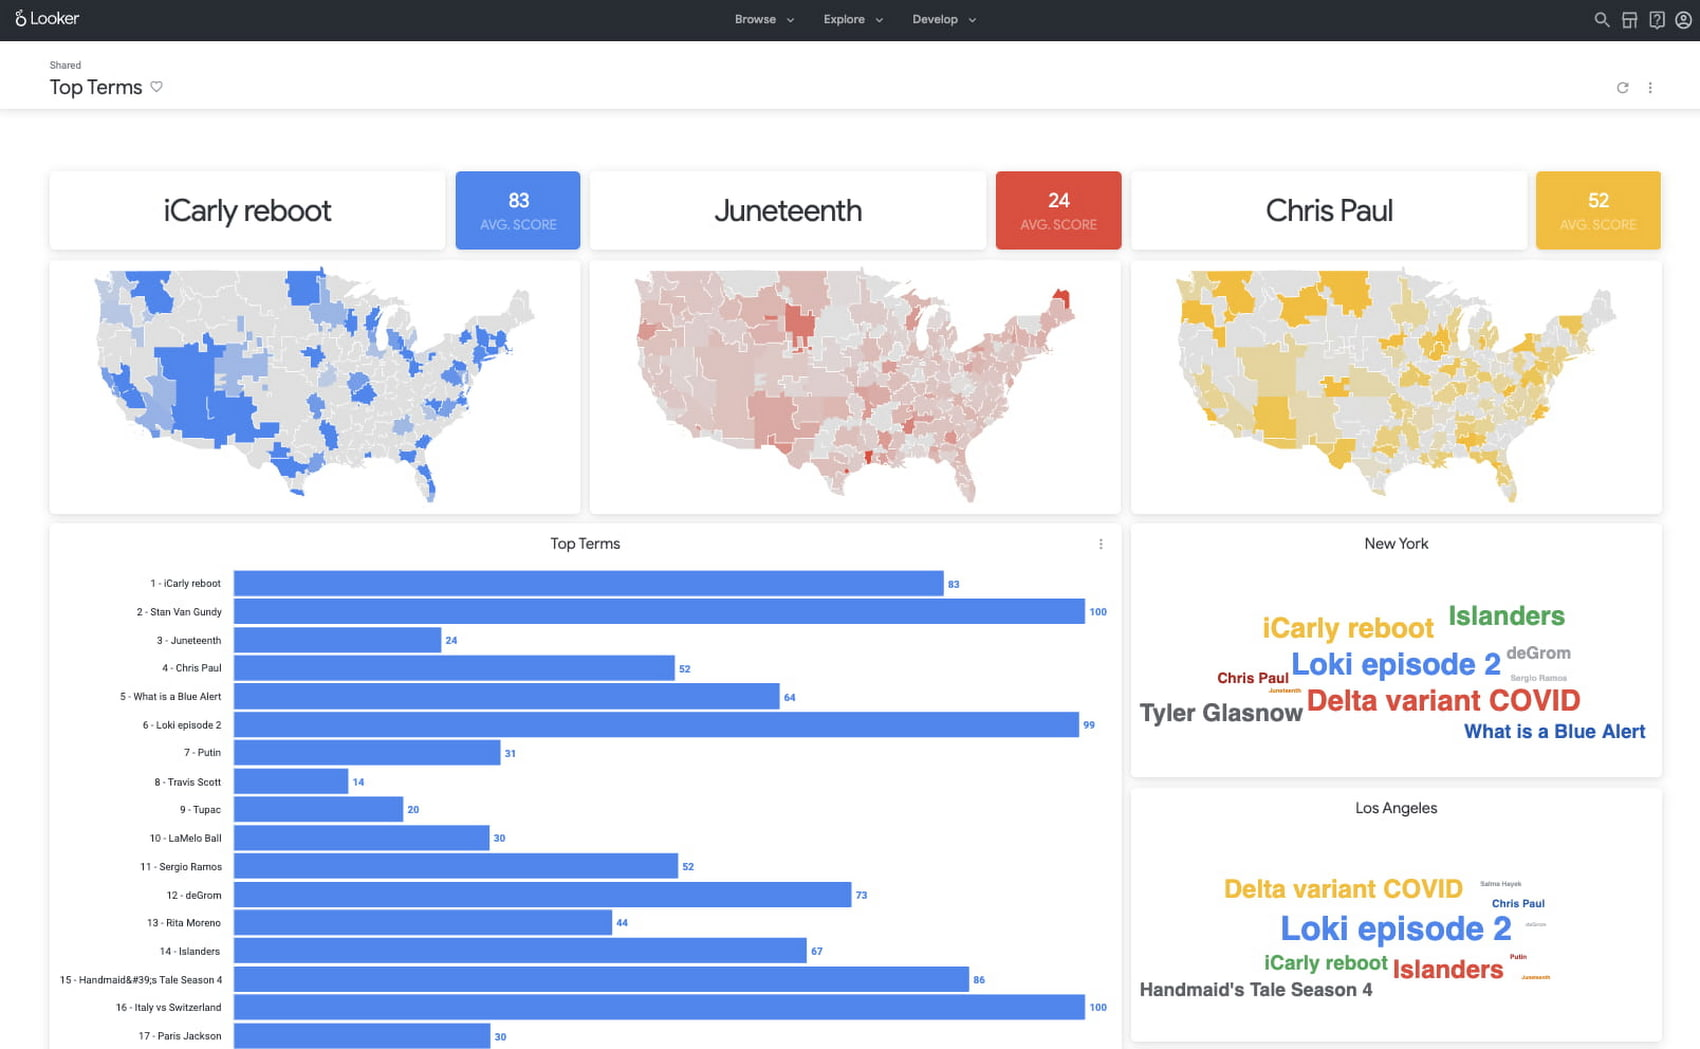
Best practice: Use Google Trends data for common business needs
- The Google Trends dataset represents the first time we’re adding Google-owned Search data into Datasets for Google Cloud. The Trends data allows users to measure interest in a particular topic or search term across Google Search, from around the United States, down to the city-level. You can learn more about the dataset here, and check out the Looker dashboard here! These tables are super valuable in their own right, but when you blend them with other actionable data you can unlock whole new areas of opportunity for your team. To learn how to make informed decisions with Google Trends data, keep reading.
- Access the dataset
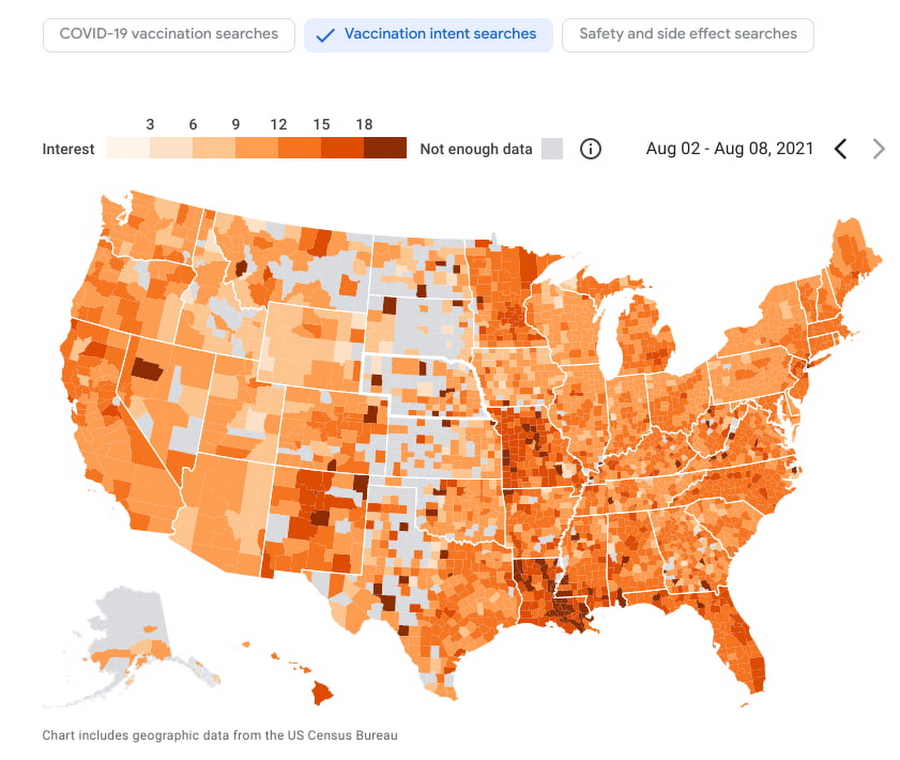
New dataset: COVID-19 Vaccination Search Insights
- With COVID-19 vaccinations being a topic of interest around the United States, this dataset shows aggregated, anonymized trends in searches related to COVID-19 vaccination and is intended to help public health officials design, target, and evaluate public education campaigns. Check out this interactive dashboard to explore searches for COVID-19 vaccination topics by region.
- Access the dataset
June 2021
New dataset: Google Diversity Annual Report 2021
- Since 2014, Google has disclosed data on the diversity of its workforce in an effort to bring candid transparency to the challenges technology companies like Google face in recruitment and retention of underrepresented communities. In an effort to make this data more accessible and useful, we’ve loaded it into BigQuery for the first time ever. To view Google’s Diversity Annual Report and learn more, check it out.
- Access the dataset
New dataset: Google Trends Top 25 Search terms
- The most popular and surging Google Search terms are now available in BigQuery as a public dataset. View the Top 25 and Top 25 rising queries from Google Trends from the past 30-days, including 5 years of historical data across the 210 Designated Market Areas (DMAs) in the US. Keep reading.
- Access the dataset
New dataset: COVID-19 Vaccination Access
- With metrics quantifying travel times to COVID-19 vaccination sites, this dataset is intended to help Public Health officials, researchers, and Healthcare Providers to identify areas with insufficient access, deploy interventions, and research these issues. Check out how this data is being used in a number of new tools.
- Access the dataset
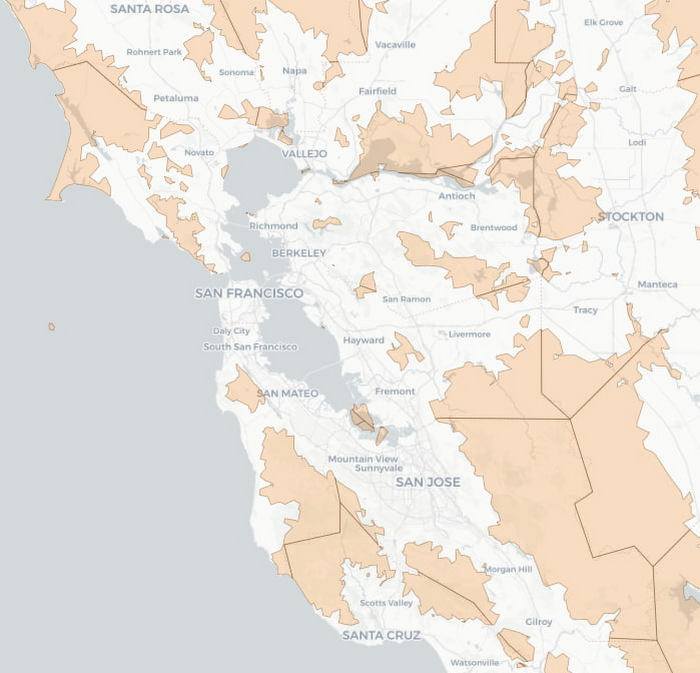

Best practice: Leveraging BigQuery Public Boundaries datasets for geospatial analytics
- Geospatial data is a critical component for a comprehensive analytics strategy. Whether you are trying to visualize data using geospatial parameters or do deeper analysis or modeling on customer distribution or proximity, most organizations have some type of geospatial data they would like to use – whether it be customer zipcodes, store locations, or shipping addresses. However, converting geographic data into the correct format for analysis and aggregation at different levels can be difficult. In this post, we’ll walk through some examples of how you can leverage the Google Cloud platform alongside Google Cloud Public Datasets to perform robust analytics on geographic data. Keep reading.
- Access the dataset

Get the metadata and try BigQuery sandbox
When you’ve learned about many of our datasets and pre-built solutions from across Google, you may be ready to start querying them. Check out the full dataset directory and read all the metadata at g.co/cloud/marketplace-datasets, then dig into the data with our free-to-use BigQuery sandbox account, or $300 in credits with our Google Cloud free trial.
Google Cloud Tools Help U.S. Forest Department Generate Years of Insights into Earth’s Natural Resources
5010
Of your peers have already read this article.
3:00 Minutes
The most insightful time you'll spend today!
For 117 years, the U.S. Department of Agriculture’s Forest Service has been a steward of America’s forests, grasslands, and waterways. It directly manages 193 million acres and supports sustainable management on a total of 500 million acres of private, state, and tribal lands. Its impact reaches far beyond even that, offering its research and learning freely to the world.
At Google, we’re big admirers of the Forest Service’s mission. So we were thrilled to learn in 2011 that its scientists were using Google Earth Engine, our planetary-scale platform for Earth Science data and analysis, to aid its research, understanding, and effectiveness. In the years since, Google has worked with the Forest Service to meet its unique requirements for visual information about the planet. Using both historical and current data, the Forest Service built new products, workflows, and tools that help more effectively and sustainably manage our natural resources. The Forest Service also uses Earth Engine and Google Cloud to study the effects of climate change, forest fires, insects and disease, helping them create new insights and strategies.
Besides gaining newfound depths of insight, the Forest Service has also sped up its research dramatically, enabling everyone to do more. Using Google Cloud and Earth Engine, the Forest Service reduced the time it took to analyze 10 years worth of land-cover changes from three months to just one hour, using just 100 lines of code. The agency built new models for coping with change, then mapped these changes over time, in its Landscape Change Monitoring System (LCMS) project.
Emergency responders can now work better on new threats that arise after wildfires, hurricanes, and other natural disasters. Forest health specialists can detect and monitor the impacts of invasive insects, diseases, and drought. More Forest Service personnel can use new tools and products within Earth Engine, thanks to numerous training and outreach sessions within the Forest Service.
Researchers elsewhere also benefited when the Forest Service created new toolkits, and posted them to GitHub for public use. For example, there’s geeViz, a repository of Google Earth Engine Python code modules useful for general data processing, analysis, and visualization.
This is only the start. Recently, the Forest Service started using Google Cloud’s processing and analysis tools for projects like California’s Wildfire and Forest Resilience Action Plan. Forest Service researchers also use Google Cloud to better understand ecological conditions across landscapes in projects like Fuelcast, which provides actionable intelligence for rangeland managers, fire specialists, and growers, and the Scenario Investment Planning Platform for modeling local and national land management scenarios.
The Forest Service is a pioneer in building technology to help us better understand and care for our planet. With more frequent imaging, rich satellite data sets, and sophisticated database and computation systems, we can view and model the Earth as a large-scale dynamic system.
We are honored and excited to respond to the unique set of requirements of the scientists, engineers, rangers, and firefighters of the USFS, and look forward to years of learning about — and better caring for — our most precious resources.
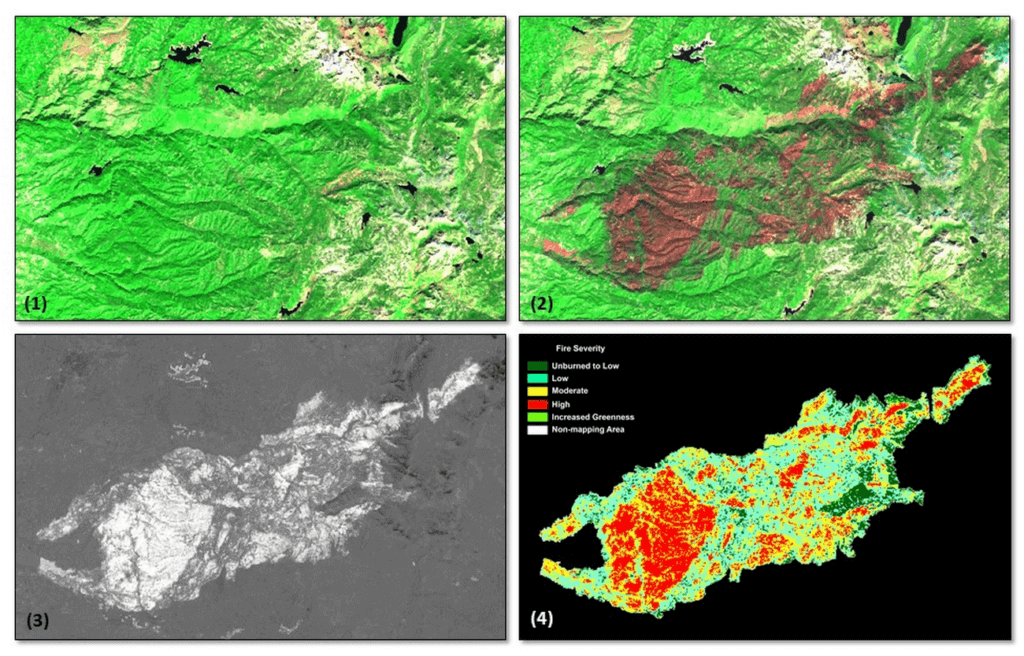
*Image 1: The USDA Forest Service (USFS) Geospatial Technology and Applications Center (GTAC) uses science-based remote sensing methods to characterize vegetation and soil condition after wildland fire events. The results are used to facilitate emergency assessments to support hazard mitigation, to inform post-fire restoration planning, and to support the monitoring of national fire policy effectiveness. GTAC currently conducts these mapping efforts using long-established geospatial workflows. However, GTAC has adapted its post-fire mapping and assessment workflows to work within Google Earth Engine (GEE) to accommodate the needs of other users in the USFS. The spatially and temporally comprehensive coverage of moderate resolution multispectral data sources (e.g., Landsat, Sentinel 2) and analytical power provided by GEE allows users to create geospatial burn severity products quickly and easily. Box 1 shows a pre-fire Sentinel-2 false color composite image. Box 2 shows a post-fire Sentinel-2 false color composite image with the fire scar apparent in reddish brown. Box 3 shows a differenced Normalized Burn Ratio (dNBR) image showing the change between the pre- and post-fire images in Boxes 1 and 2. Box 4 shows a thresholded dNBR image of the burned area with four classes of burn severity (unburned to high severity), which is the final output delivered to forest managers.
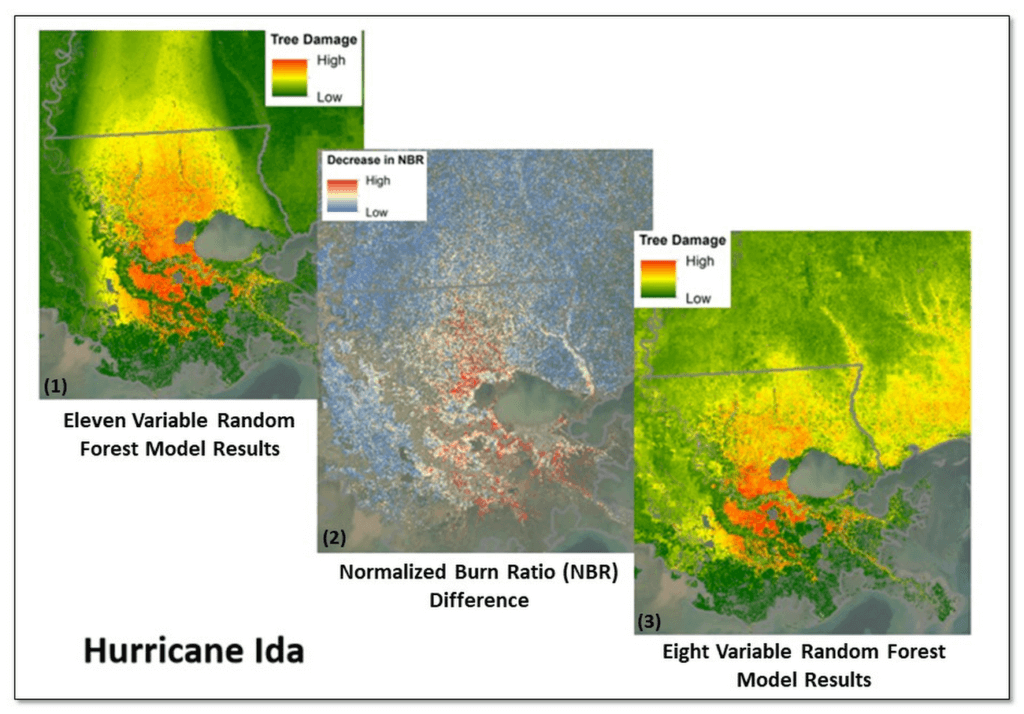
*Image 2: Leveraging Google Earth Engine (GEE), the USDA Forest Service (USFS) Geospatial Technology and Applications Center (GTAC) and USFS Region 8, developed the Tree Structure Damage Impact Predictive (TreeS-DIP) modeling approach to predict wind damage to trees resulting from large hurricane events and produce spatial products across the landscape. TreeS-DIP results become available within 48 hours following landfall of a large storm event to allow allocation of ground resources to the field for strategic planning and management. Boxes 1 and 3 above show TreeS-DIP modeled outputs with varying data inputs and parameters. Box 2 shows changes in greenness (Normalized Burn Ratio; NBR) that was measured with GEE during the recovery from Hurricane Ida and is shown as a visual comparison to the rapidly available products from TreeS-DIP.
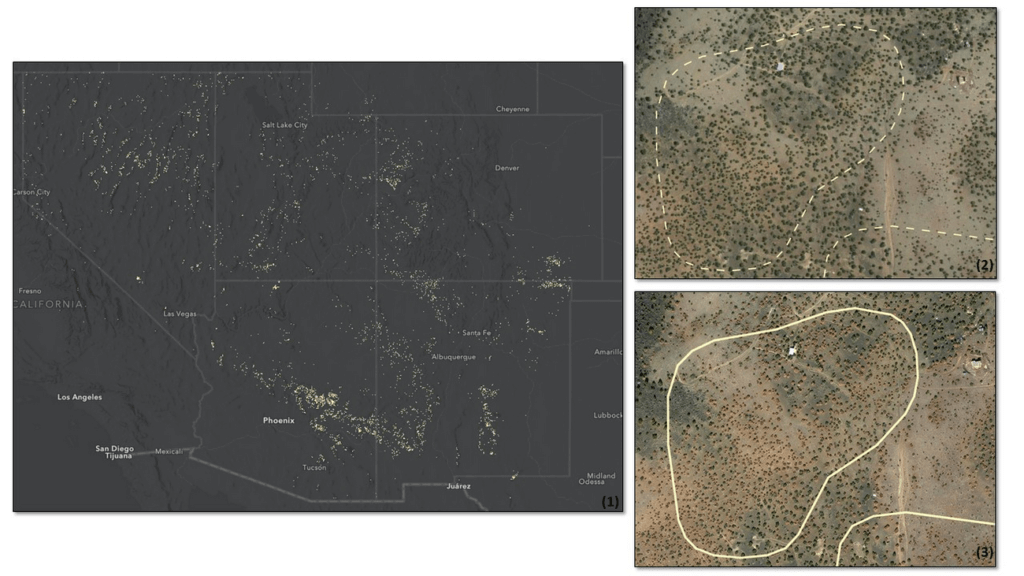
*Image 3: Severe drought conditions across the American West prompted concern about the health and status of pinyon-juniper woodlands, a vast and unique ecosystem. In a cooperative project between the USDA Forest Service (USFS) Geospatial Technology and Applications Center (GTAC) and Forest Health Protection (FHP), Google Earth Engine (GEE) was used to map pinyon pine and juniper mortality across 10 Western US States. The outputs are now being used to plan for future work including on-the-ground efforts, high-resolution imagery acquisitions, aerial surveys, in-depth mortality modeling, and planning for 2022 field season work.
Box 1 contains remote sensing change detection outputs (in white) generated with GEE, showing pinyon-juniper decline across the Southwestern US. Box 2 shows NAIP imagery from 2017 with, with box 3 showing NAIP imagery from 2021. NAIP imagery from these years shows trees changing from healthy and green in 2017 to brown and dying in 2021. In addition, box 2 and box 3 show change detection outputs from Box 1 for a location outside of Flagstaff, AZ converted to polygons (in white). The polygon in box 2 is displayed as a dashed line to serve as a reference, while the solid line in box 3 shows the measured change in 2021. Converting rasters to polygons allows the data to be easily used on tablet computers, as well as the ability to add information and photographs from field visits.

5359
Of your peers have already downloaded this article
8:15 Minutes
The most insightful time you'll spend today!
To design and implement a successful machine learning (ML) project, you often need to collaborate with multiple teams, including those in business, sales, research, and engineering. Understanding the essentials of gathering and preparing your data is crucial to align teams, and getting a project off the ground.
Building an ML model that achieves your business’ goal, requires the kind of data that a model can learn from. If the goal is to predict a target output based on some input, you’ll need some data consisting of past input-output examples. For example, to detect (that is, to predict) a fraudulent credit card transaction (the target of the prediction), each example must contain information on a past credit card transaction and whether that transaction was fraudulent or not.
So what are the best practices in preparing and curating data for a machine learning initiative? The answer to this question lies within the guide. You’ll learn:
- To evaluate whether your data is suitable for ML
- What types of data you need–and which ones to eliminate
- How to prevent data leakage
- Tricks to speed up an ML project such as Google’s human labeling service, and Cloud Dataprep
- The importance of the granularity of data
How Google Cloud & NGIS’ Partnership Powers Sustainability & Responsible Sourcing for Consumer Brands

6195
Of your peers have already read this article.
2:00 Minutes
The most insightful time you'll spend today!
In the competitive world of consumer goods, sustainability matters more than ever. In recent Google survey, 82% of consumers said sustainability is more top of mind now than it was before COVID-191 and 78% said that big businesses have a role to play in helping to fight climate change.2 As well as delivering on customers’ heightened expectations, sustainable business practices can help organizations reduce waste and lower operational costs and even help attract top talent.
Not only is sustainability good for business performance and the bottom line, it’s great for the planet, too. And it’s something we care deeply about at Google. Since our earliest days, we have focused on developing services that significantly improve the lives of billions of people while operating our business in an environmentally sustainable way. In 2007, we were the first major company to become carbon neutral, and in 2017 we were the first to achieve 100% renewable energy. Today, we proudly operate the cleanest cloud in the industry. We’ve also been powering humanitarian, scientific, and environmental initiatives studying geospatial information and making it available for analysis via Google Earth Engine.
Powering the future of responsible sourcing
How does all this relate to CPG supply chains? The world relies on raw materials like palm oil, soy, and cocoa to produce the items we consume every day—such as coffee, chocolate, frozen foods, shampoo, toothpaste, cosmetics, and even household cleaning products. Yet as demand for these materials continues to grow, forests are under threat. Change is needed.
As sustainability moves further into the spotlight, in-demand crops face increased supplier scrutiny. Environmentally conscious companies want to know what percentage of their raw materials is sourced from deforestation-free suppliers—and how they can improve that number. Until recently, many CPG brands have found it hard to get real-time, reliable visibility into operations at a local supplier level, globally.
Google Cloud, in partnership with NGIS, is helping brands gain a deeper understanding of raw material sourcing practices across supplier networks, so they can improve supplier performance and compliance in the fight against deforestation. The TraceMark solution, developed by NGIS, uses Google Earth Engine and BigQuery to analyze and visualize how suppliers behave over time.
Google Earth Engine is the world’s largest archive of open Earth data. It combines a multi-petabyte catalog of satellite imagery and geospatial datasets with planetary-scale analysis capabilities to help people detect changes, map trends, and quantify differences on the Earth’s surface.With Earth Engine, organizations can analyze the potential social, and environmental impacts of the decision they make.
Together, TraceMark, Google Earth Engine and BigQuery help companies visualize, monitor, and measure the impact of suppliers’ farming practices. The process starts with Earth Engine, which aggregates and harmonizes planetary data into images that it has been collecting for decades. Then, boundary maps for different suppliers are created and NGIS applies climate data science and machine learning to turn pixels into insights. Finally, BigQuery and Vertex AI -Google Cloud’s unified artificial intelligence platform are used to produce supplier scoring, which is integrated into downstream ERP and procurement systems to support more informed decision-making.
These efforts support the responsible sourcing of raw materials by making supply chains more agile, transparent and traceable.
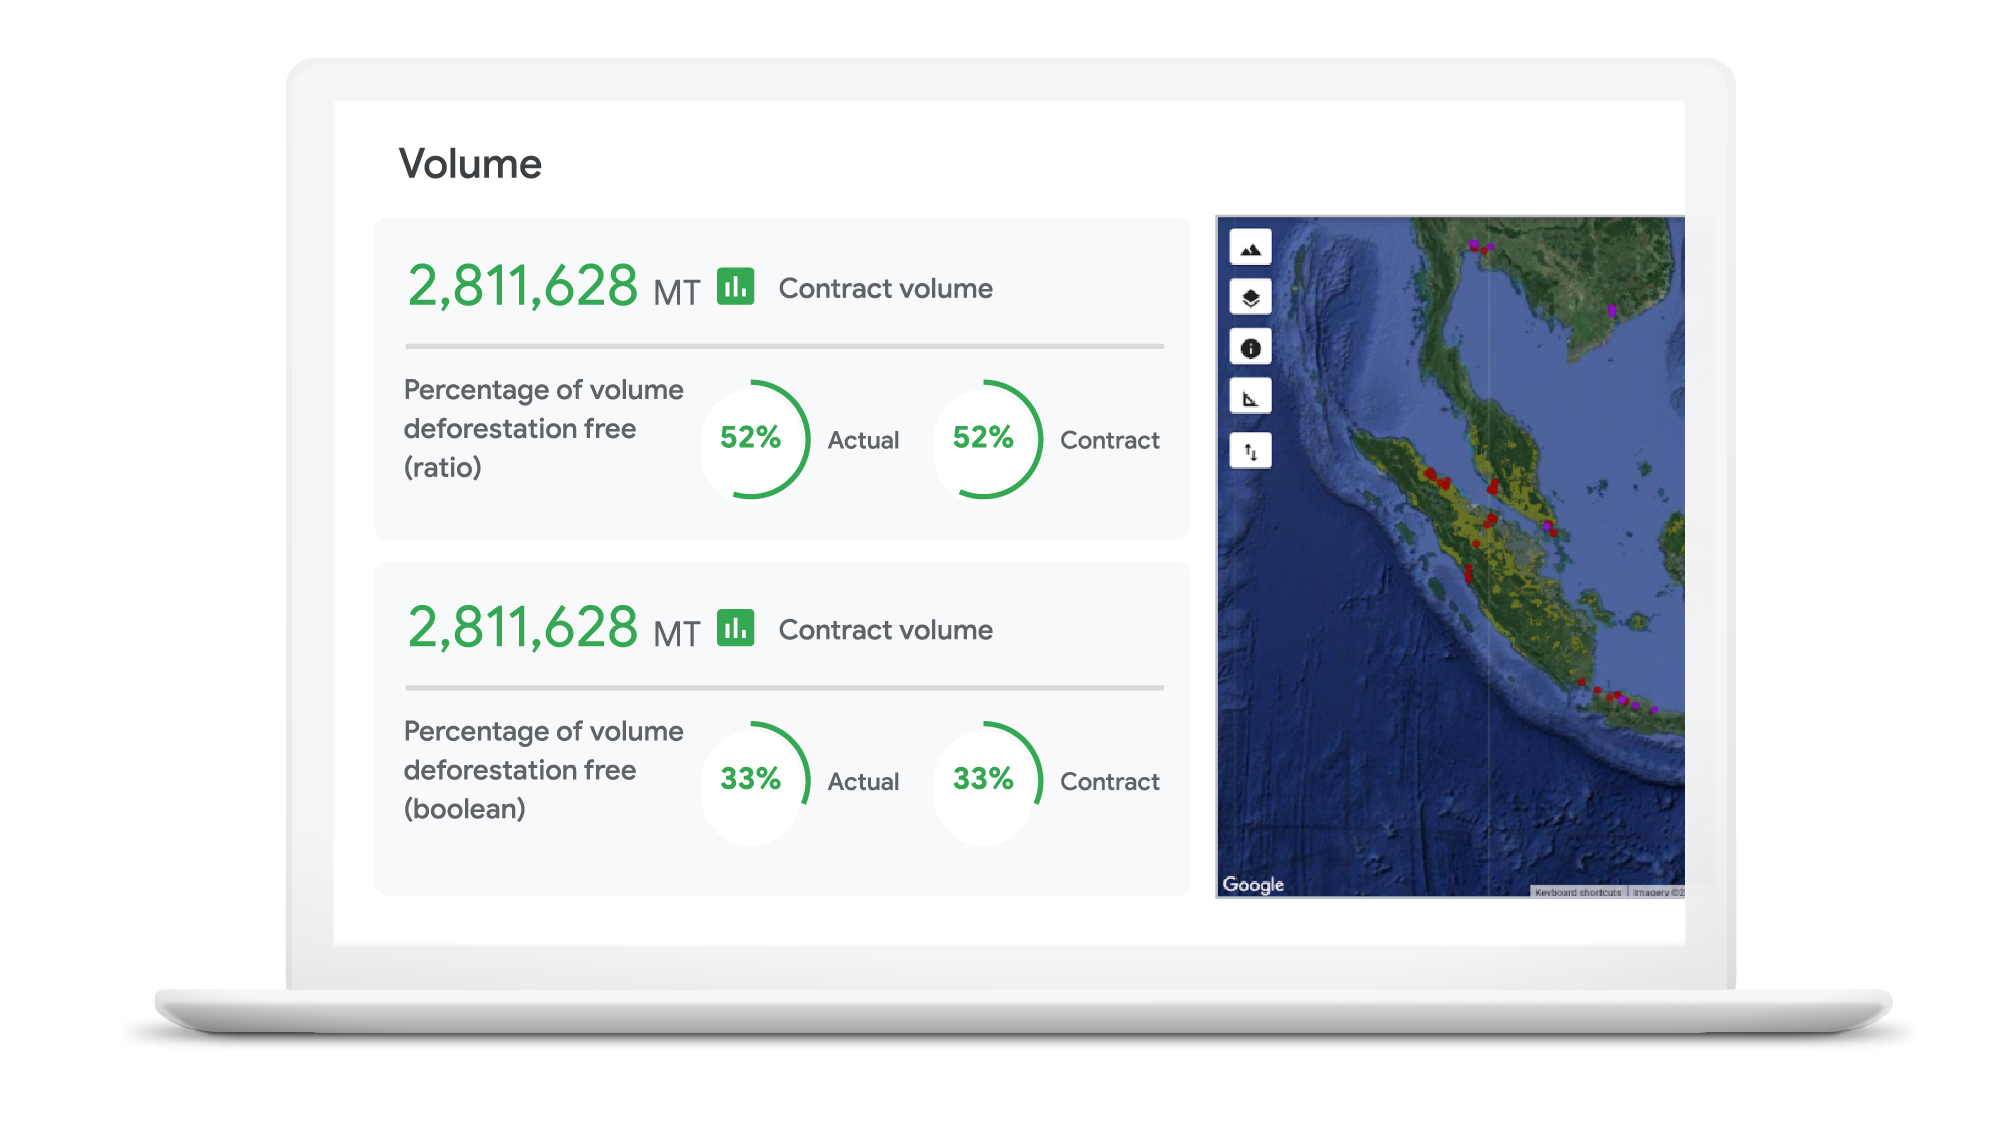
“NGIS is thrilled to work with Google Cloud and its partners to enable business accountability for sustainable practices at all levels of their supply chain,” said Nathan Eaton, Executive Director, NGIS. “Google Earth Engine provides unique geospatial capability that [gives] leaders visibility and control over their environmental footprint and that of their suppliers in a way that was not previously possible.”
Unilever commits to working towards a deforestation-free supply chain
Unilever is a great example of a company committed to using technology in the quest to become more sustainable. Since 2020, Unilever has partnered with Google Cloud to use data for eco-friendly decision-making, particularly when it comes to sustainable commodity sourcing.
By combining the power of cloud computing with satellite imagery and AI, we’re helping Unilever build a more holistic view of the forests, water cycles, and biodiversity that intersect its supply chain. By gaining a complete picture of these ecosystems, Unilever can detect deforestation while simultaneously prioritizing critical areas of forest and habitats in need of protection.
The cleanest cloud for your sustainable transformation
We are excited to bring Google Earth Engine and NGIS to our CPG customers to help them meet their sustainability goals. Looking ahead, we’re committed to furthering our own ambitious sustainability goals and empowering CPG brands with the technology to do more for our environment and our shared future.
Contact your cloud seller to learn more about Tracemark sustainable sourcing solutions and how Google Cloud can help you advance your sustainability initiatives.
Explore TraceMark on the Google Cloud Marketplace
To know more about how we are helping CPGs transform digitally read this ebook
1. Google/C Space, BR, FR, DE, IN, MX, U.K., U.S., qualitative survey activity, n = 528, Nov. 24–Nov. 26, 2020.
2. Google/Ipsos, Google Sustainability, BR, FR, DE, IN, JP, U.K., U.S., n=16,959 online population 18–70, July 2021.
More Relevant Stories for Your Company

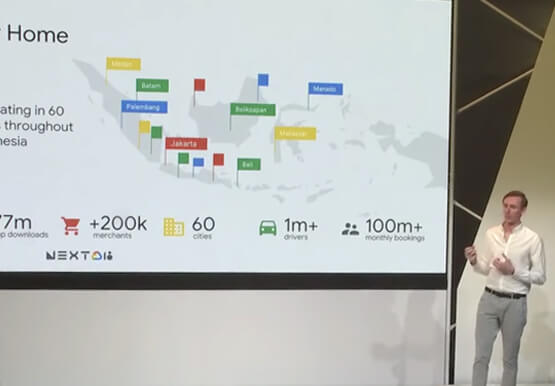

How Go-Jek, Indonesia’s First Billion-dollar Startup, Improved the Productivity of Data Scientists
Go-Jek, Indonesia’s first billion-dollar startup, has seen an incredible amount of growth in both users and data over the past two years. Many of the ride-hailing company's services are backed by machine learning models hosted on Google Cloud Platform. Models range from driver allocation, to dynamic surge pricing, to food
Your DW Need Scaling Up? Try What This Company Did: It Can Run 25,000 Events a Second
With access to more data than ever before, companies have never been better positioned to adopt precision marketing methods and target the right customers at the right time. Emarsys, a digital marketing platform, enables its clients to collect, analyze, and act on a wide variety of data. From websites to mobile



L’Oréal: Managing Big-data Complexity with Google Cloud
L’Oreal is a global company with a presence in 150 countries worldwide. Between managing all of its brands and requirements for different countries, L’Oreal looks to data to make insightful business decisions. How does L’Oreal unify its data across all its systems and databases? How does L’Oreal make the data

Google Cloud Helps Northwell Health to Boost Caregiver Productivity and Access to Right Care Using AI
Lung cancer is the leading cause of cancer death in the United States and like any cancer, early detection is crucial to survival. Screening at-risk populations is an important part of reducing mortality, and if concerning nodules are found on imaging, further testing may be required. Today, we’ll share how
