





Google Cloud Helped Digitec Galaxus Personalize Over 2 Million Newsletters in a Week

8278
Of your peers have already read this article.
3:00 Minutes
The most insightful time you'll spend today!
Digitec Galaxus AG is the biggest online retailer in Switzerland, operating two online stores: Digitec, Switzerland’s online market leader for consumer electronics and media products, and Galaxus, the largest Swiss online shop with a steadily growing range of consistently low-priced products for almost all daily needs.
Known for its efficient, personalized shopping experiences, it’s clear that Digitec Galaxus understands what it takes to deliver a platform that is interesting and relevant to customers every time they shop.
The problem: Personalizing decisions for every situation
Digitec Galaxus already had established an engine to help them personalize experiences for shoppers when they reached out to Google Cloud. They had multiple recommendation systems in place and were also extensive early adopters of Recommendations AI, which already enabled them to offer personalized content in places like their homepages, product detail pages, and their newsletter.
But those same systems sometimes made it difficult to understand how best to combine and optimize to create the most personalized experiences for their shoppers. Their requirements were threefold:
- Personalization: They have over 12 recommenders they can display on the app, however they would like to contextualize this and choose different recommenders (which in turn select the items) for different users. Furthermore they would like to exploit existing trends as well as experiment with new ones.
- Latency: They would like to ensure that the solution is architected so that the ranked list of recommenders can be retrieved with sub 50 ms latency.
- End-to-end easy to maintain & generalizable/modular architecture: Digitec wanted the solution to be architected using an easy to maintain, open source stack, complete with all MLops capabilities required to train and use contextual bandits models. It was also important to them that it is built in a modular fashion such that it can be adapted easily to other use cases which have in mind such as recommendations on the homepage, Smartags and more .
To improve, they asked us to help them implement a machine learning (ML) contextual bandit based recommender system on Google Cloud taking all the above factors into consideration to take their personalization to the next level.
Contextual bandits algorithms are a simplified form of reinforcement learning and help aid real-world decision making by factoring in additional information about the visitor (context) to help learn what is most engaging for each individual. They also excel at exploiting trends which work well, as well as exploring new untested trends which can yield potentially even better results. For instance, imagine that you are personalizing a homepage image where you could show a comfy living room couch or pet supplies.
Without a contextual bandit algorithm, one of these images would be shown to someone at random without considering information you may have observed about them during previous visits. Contextual bandits enable businesses to consider outside context, such as previously visited pages or other purchases, and then observe the final outcome (a click on the image) to help determine what works best.
Creating a personalization system with contextual bandits
While Digitec Galaxus heavily personalizes their website homepages, they are very very sensitive and also require more cross-team collaboration to update and make changes.
Together with the Digitec Galaxus team, we decided to narrow the scope and focus on building a contextual bandit personalization system for the newsletter first. The digitec Galaxus team has complete control over newsletter decisions and testing various ML experiments on a newsletter would have less chance of adverse revenue impact than a website homepage.
The main goal was to architect a system that could be easily ported over to the homepage and other services offered by Digitec with minimal adaptations. It would also need to satisfy the functional and non-functional requirements of the homepage as well as other internal use cases.
Below is a diagram of how the newsletter’s personalization recommendation system works:

- The system is given some context features about the newsletter subscriber such as their purchase history and demographics. Features are sometimes referred to as variables or attributes, and can vary widely depending on what data is being analyzed.
- The contextual bandit model trains recommendations using those context features and 12 available recommenders (potential actions).
- The model then calculates which action is most likely to enhance the chance of reward (a user clicking in the newsletter) and also minimize the problem (an unsubscribe).
Calculating whether a click was a newsletter or an unsubscribe enabled the system to optimize for increasing clicks and avoid showing non-relevant content to the user (click-bait). This enabled Digitec Galaxus to exploit popular trends while also exploring potentially better-performing trends.
How Google Cloud helps
The newsletter context-driven personalization system was built on Google Cloud architecture using the ML recommendation training and prediction solutions available within our ecosystem.
Below is a diagram of the high-level architecture used:
The architecture covers three phases of generating context-driven ML predictions, including:
ML Development: Designing and building the ML models and pipeline
Vertex Notebooks are used as data science environments for experimentation and prototyping. Notebooks are also used to implement model training, scoring components, and pipelines. The source code is version controlled in Github. A continuous integration (CI) pipeline is set up to automatically run unit tests, build pipeline components, and store the container images to Cloud Container Registry.
ML Training: Large-scale training and storing of ML models
The training pipeline is executed on Vertex Pipelines. In essence, the pipeline trains the model using new training data extracted from BigQuery and produces a trained, validated contextual bandit model stored in the model registry. In our system, the model registry is a curated Cloud Storage.
The training pipeline uses Dataflow for large scale data extraction, validation, processing, and model evaluation, and Vertex Training for large-scale distributed training of the model. AI Platform Pipelines also stores artifacts, the output of training models, produced by the various pipeline steps to Cloud Storage. Information about these artifacts are then stored in an ML metadata database in Cloud SQL. To learn more about how to build a Continuous Training Pipeline, read the documentation guide.
ML Serving: Deploying new algorithms and experiments in production
The training pipeline uses batch prediction to generate many predictions at once using AI Platform Pipelines, allowing Digitec Galaxus to score large data sets. Once the predictions are produced, they are stored in Cloud Datastore for consumption. The pipeline uses the most recent contextual bandit model in the model registry to evaluate the inference dataset in BigQuery and give a ranked list of the best newsletters for each user, and persist it in Datastore. A Cloud Function is provided as a REST/HTTP endpoint to retrieve the precomputed predictions from Datastore.
All components of the code and architecture are modular and easy to use, which means they can be adapted and tweaked to several other use cases within the company as well.
Better newsletter predictions for millions
The newsletter prediction system was first deployed in production in February, and Digitec Galaxus has been using it to personalize over 2 million newsletters a week for subscribers. The results have been impressive, 50% higher than our baseline. However, the collaboration is still ongoing to improve the results even more.
“Working at this level in direct exchange with Google’s machine learning experts is a unique opportunity for us. The use of contextual bandits in the targeting of our recommendations enables us to pursue completely new approaches in personalization by also personalizing the delivery of the respective recommender to the user. We have already achieved good results in our newsletter in initial experiments and are now working on extending the approach to the entire newsletter by including more contextual data about the bandits arms. Furthermore, as a next step, we intend to apply the system to our online store as well, in order to provide our users with an even more personalized experience. To build this scalable solution, we are using Google’s open source tools such as TFX and TF Agents, as well as Google Cloud Services such as Compute Engine, Cloud Machine Learning Engine, Kubernetes Engine and Cloud Dataflow.”—Christian Sager, Product Owner, Personalization ( Digitec Galaxus)
Since the existing architecture and system is also dynamic, it will automatically adapt to new behaviours, trends, and users. As a result, Digitec Galaxus plans to re-use the same components and extend the existing system to help them improve the personalization of their homepage and other current use cases they have within the company. Beyond clicks and user engagement, the system’s flexibility also allows for future optimization of other criteria. It’s a very exciting time and we can’t wait to see what they build next!
Unified, Flexible and Accessible: How Companies’ Data Help Them Achieve More on Google Cloud

4861
Of your peers have already read this article.
1:30 Minutes
The most insightful time you'll spend today!
As the volume of data that people and businesses produce continues to grow exponentially, it goes without saying that data-driven approaches are critical for tech companies and startups across all industries. But our conversations with customers, as well as numerous industry commentaries, reiterate that managing data and extracting value from it remains difficult, especially with scale.
Numerous factors underpin the challenges, including access to and storage of data, inconsistent tools, new and evolving data sources and formats, compliance concerns, and security considerations. To help you identify and solve these challenges, we’ve created a new whitepaper, “The future of data will be unified, flexible, and accessible,” which explores many of the most common reasons our customers tell us they’re choosing Google Cloud to get the most out of their data.
For example, you might need to combine data in legacy systems with new technologies. Does this mean moving all your data to the cloud? Should it be in one cloud or distributed across several? How do you extract real value from all of this data without creating more silos?
You might also be limited to analyzing your data in batch instead of processing it in real-time, adding complexity to your architecture and necessitating expensive maintenance to combat latency. Or you might be struggling with unstructured data, with no scalable way to analyze and manage it. Again, the factors are numerous—but many of them accrue to inadequate access to data, often exacerbated by silos, and insufficient ability to process and understand it.
The modern tech stack should be a streaming stack that scales with your data, provides real-time analytics, incorporates and understands different types of data, and lets you use AI/ML to predictively derive insights and operationalize processes. These requirements mean that to effectively leverage your data assets:
- Data should be unified across your entire company, even across suppliers, partners, and platforms., eliminating organizational and technology silos.
- Unstructured data should be unlocked and leveraged in your analytics strategy.
- The technology stack should be unified and flexible enough to support use cases ranging from analysis of offline data to real-time streaming and application of ML without maintaining multiple bespoke tech stacks.
- The technology stack should be accessible on-demand, with support for different platforms, programming languages, tools, and open standards compatible with your employees’ existing skill sets.
With these requirements met, you’ll be equipped to maximize your data, whether that means discerning and adapting to changing customer expectations or understanding and optimizing how your data engineers and data scientists spend their time. In coming weeks, we’ll explore aspects of the whitepaper in additional blog posts—but if you’re ready to dive in now, and to steer your tech company or startup towards success by making your data better work for you, click here to download your copy, free of charge.
10138
Of your peers have already watched this video.
1:00 Minutes
The most insightful time you'll spend today!
Predict User Churn on Gaming Apps with Google Analytics Data using BigQuery ML
User retention can be a major challenge for mobile game developers. According to the Mobile Gaming Industry Analysis in 2019, most mobile games only see a 25% retention rate for users after the first day. To retain a larger percentage of users after their first use of an app, developers can take steps to motivate and incentivize certain users to return. But to do so, developers need to identify the propensity of any specific user returning after the first 24 hours.
In this blog post, we will discuss how you can use BigQuery ML to run propensity models on Google Analytics 4 data from your gaming app to determine the likelihood of specific users returning to your app.
You can also use the same end-to-end solution approach in other types of apps using Google Analytics for Firebase as well as apps and websites using Google Analytics 4. To try out the steps in this blogpost or to implement the solution for your own data, you can use this Jupyter Notebook.
Using this blog post and the accompanying Jupyter Notebook, you’ll learn how to:
- Explore the BigQuery export dataset for Google Analytics 4
- Prepare the training data using demographic and behavioural attributes
- Train propensity models using BigQuery ML
- Evaluate BigQuery ML models
- Make predictions using the BigQuery ML models
- Implement model insights in practical implementations
Google Analytics 4 (GA4) properties unify app and website measurement on a single platform and are now default in Google Analytics. Any business that wants to measure their website, app, or both, can use GA4 for a more complete view of how customers engage with their business. With the launch of Google Analytics 4, BigQuery export of Google Analytics data is now available to all users. If you are already using a Google Analytics 4 property, you can follow this guide to set up exporting your GA data to BigQuery.
Once you have set up the BigQuery export, you can explore the data in BigQuery. Google Analytics 4 uses an event-based measurement model. Each row in the data is an event with additional parameters and properties. The Schema for BigQuery Export can help you to understand the structure of the data.
In this blogpost, we use the public sample export data from an actual mobile game app called “Flood It!” (Android, iOS) to build a churn prediction model. But you can use data from your own app or website.
Here’s what the data looks like. Each row in the dataset is a unique event, which can contain nested fields for event parameters.
SELECT *FROM `firebase-public-project.analytics_153293282.events_*`TABLESAMPLE SYSTEM (1 PERCENT)

This dataset contains 5.7M events from over 15k users.
SELECTCOUNT(DISTINCT user_pseudo_id) as count_distinct_users,COUNT(event_timestamp) as count_eventsFROM`firebase-public-project.analytics_153293282.events_*

Our goal is to use BigQuery ML on the sample app dataset to predict propensity to user churn or not churn based on users’ demographics and activities within the first 24 hours of app installation.

In the following sections, we’ll cover how to:
- Pre-process the raw event data from GA4
- Identify users & the label feature
- Process demographic features
- Process behavioral features
- Train classification model using BigQuery ML
- Evaluate the model using BigQueryML
- Make predictions using BigQuery ML
- Utilize predictions for activation
Pre-process the raw event data
You cannot simply use raw event data to train a machine learning model as it would not be in the right shape and format to use as training data. So in this section, we’ll go through how to pre-process the raw data into an appropriate format to use as training data for classification models.
This is what the training data should look like for our use case at the end of this section:

Notice that in this training data, each row represents a unique user with a distinct user ID (user_pseudo_id).
Identify users & the label feature
We first filtered the dataset to remove users who were unlikely to return the app anyway. We defined these ‘bounced’ users as ones who spent less than 10 mins with the app. Then we labeled all remaining users:
- churned: No event data for the user after 24 hours of first engaging with the app.
- returned: The user has at least one event record after 24 hours of first engaging with the app.
For your use case, you can have a different definition of bounce and churning. Also you can even try to predict something else other than churning, e.g.:
- whether a user is likely to spend money on in-game currency
- likelihood of completing n-number of game levels
- likelihood of spending n amount of time in-game etc.
In such cases, label each record accordingly so that whatever you are trying to predict can be identified from the label column.
From our dataset, we found that ~41% users (5,557) bounced. However, from the remaining users (8,031), ~23% (1,883) churned after 24 hours:
SELECTbounced,churned,COUNT(churned) as count_usersFROMbqmlga4.returningusersGROUP BY 1,2ORDER BY bounced

To create these bounced and churned columns, we used the following snippet of SQL code.
...#churned = 1 if last_touch within 24 hr of app installation, else 0IF (user_last_engagement < TIMESTAMP_ADD(user_first_engagement,INTERVAL 24 HOUR),1,0 ) AS churned,#bounced = 1 if last_touch within 10 min, else 0IF (user_last_engagement <= TIMESTAMP_ADD(user_first_engagement,INTERVAL 10 MINUTE),1,0 ) AS bounced,...
You can view the Jupyter Notebook for the full query used for materializing the bounced and churned labels.
Process demographic features
Next, we added features both for demographic data and for behavioral data spanning across multiple columns. Having a combination of both demographic data and behavioral data helps to create a more predictive model.
We used the following fields for each user as demographic features:
geo.countrydevice.operating_systemdevice.language
A user might have multiple unique values in these fields — for example if a user uses the app from two different devices. To simplify, we used the values from the very first user engagement event.
CREATE OR REPLACE VIEW bqmlga4.user_demographics AS (WITH first_values AS (SELECTuser_pseudo_id,geo.country as country,device.operating_system as operating_system,device.language as language,ROW_NUMBER() OVER (PARTITION BY user_pseudo_id ORDER BY event_timestamp DESC) AS row_numFROM `firebase-public-project.analytics_153293282.events_*`WHERE event_name="user_engagement")SELECT * EXCEPT (row_num)FROM first_valuesWHERE row_num = 1 #first engagement);
Process behavioral features
There is additional demographic information present in the GA4 export dataset, e.g. app_info, device, event_params, geo etc. You may also send demographic information to Google Analytics through each hit via user_properties. Furthermore, if you have first-party data on your own system, you can join that with the GA4 export data based on user_ids.
To extract user behavior from the data, we looked into the user’s activities within the first 24 hours of first user engagement. In addition to the events automatically collected by Google Analytics, there are also the recommended events for games that can be explored to analyze user behavior. For our use case, to predict user churn, we counted the number of times the follow events were collected for a user within 24 hours of first user engagement:
user_engagementlevel_start_quickplaylevel_end_quickplaylevel_complete_quickplaylevel_reset_quickplaypost_scorespend_virtual_currencyad_rewardchallenge_a_friendcompleted_5_levelsuse_extra_steps
The following query shows how these features were calculated:
WITHevents_first24hr AS (SELECTe.*FROM`firebase-public-project.analytics_153293282.events_*` eJOINbqmlga4.returningusers rONe.user_pseudo_id = r.user_pseudo_idWHERETIMESTAMP_MICROS(e.event_timestamp) <= r.ts_24hr_after_first_engagement)SELECTuser_pseudo_id,SUM(IF(event_name = 'user_engagement', 1, 0)) AS cnt_user_engagement,# ... repeated for all behavior data ...SUM(IF(event_name = 'use_extra_steps', 1, 0)) AS cnt_use_extra_steps,FROMevents_first24hrGROUP BY1
View the notebook for the query used to aggregate and extract the behavioral data. You can use different sets of events for your use case. To view the complete list of events, use the following query:
SELECTevent_name,COUNT(event_name) as event_countFROM`firebase-public-project.analytics_153293282.events_*`GROUP BY 1ORDER BYevent_count DESC
After this we combined the features to ensure our training dataset reflects the intended structure. We had the following columns in our table:
- User ID:
user_pseudo_id
- Label:
churned
- Demographic features
countrydevice_osdevice_language
- Behavioral features
cnt_user_engagementcnt_level_start_quickplaycnt_level_end_quickplaycnt_level_complete_quickplaycnt_level_reset_quickplaycnt_post_scorecnt_spend_virtual_currencycnt_ad_rewardcnt_challenge_a_friendcnt_completed_5_levelscnt_use_extra_stepsuser_first_engagement
At this point, the dataset was ready to train the classification machine learning model in BigQuery ML. Once trained, the model will output a propensity score between churn (churned=1) or return (churned=0) indicating the probability of a user churning based on the training data.
Train classification model
When using the CREATE MODEL statement, BigQuery ML automatically splits the data between training and test. Thus the model can be evaluated immediately after training (see the documentation for more information).
For the ML model, we can choose among the following classification algorithms where each type has its own pros and cons:

Often logistic regression is used as a starting point because it is the fastest to train. The query below shows how we trained the logistic regression classification models in BigQuery ML.
CREATE OR REPLACE MODEL bqmlga4.churn_logregTRANSFORM(EXTRACT(MONTH from user_first_engagement) as month,EXTRACT(DAYOFYEAR from user_first_engagement) as julianday,EXTRACT(DAYOFWEEK from user_first_engagement) as dayofweek,EXTRACT(HOUR from user_first_engagement) as hour,* EXCEPT(user_first_engagement, user_pseudo_id))OPTIONS(MODEL_TYPE="LOGISTIC_REG",INPUT_LABEL_COLS=["churned"]) ASSELECT*FROMbqmlga4.train
We extracted month, julianday, and dayofweek from datetimes/timestamps as one simple example of additional feature preprocessing before training. Using TRANSFORM() in your CREATE MODEL query allows the model to remember the extracted values. Thus, when making predictions using the model later on, these values won’t have to be extracted again. View the notebook for the example queries to train other types of models (XGBoost, deep neural network, AutoML Tables).
Evaluate model
Once the model finished training, we ran ML.EVALUATE to generate precision, recall, accuracy and f1_score for the model:
SELECT*FROMML.EVALUATE(MODEL bqmlga4.churn_logreg)

The optional THRESHOLD parameter can be used to modify the default classification threshold of 0.5. For more information on these metrics, you can read through the definitions on precision and recall, accuracy, f1-score, log_loss and roc_auc. Comparing the resulting evaluation metrics can help to decide among multiple models.Furthermore, we used a confusion matrix to inspect how well the model predicted the labels, compared to the actual labels. The confusion matrix is created using the default threshold of 0.5, which you may want to adjust to optimize for recall, precision, or a balance (more information here).
SELECTexpected_label,_0 AS predicted_0,_1 AS predicted_1FROMML.CONFUSION_MATRIX(MODEL bqmlga4.churn_logreg)

This table can be interpreted in the following way:

Make predictions using BigQuery ML
Once the ideal model was available, we ran ML.PREDICT to make predictions. For propensity modeling, the most important output is the probability of a behavior occurring. The following query returns the probability that the user will return after 24 hrs. The higher the probability and closer it is to 1, the more likely the user is predicted to return, and the closer it is to 0, the more likely the user is predicted to churn.
SELECTuser_pseudo_id,returned,predicted_returned,predicted_returned_probs[OFFSET(0)].prob as probability_returnedFROMML.PREDICT(MODEL bqmlga4.churn_logreg,(SELECT * FROM bqmlga4.train)) #can be replaced with a proper test dataset
Utilize predictions for activation
Once the model predictions are available for your users, you can activate this insight in different ways. In our analysis, we used user_pseudo_id as the user identifier. However, ideally, your app should send back the user_id from your app to Google Analytics. In addition to using first-party data for model predictions, this will also let you join back the predictions from the model into your own data.
- You can import the model predictions back into Google Analytics as a user attribute. This can be done using the Data Import feature for Google Analytics 4. Based on the prediction values you can Create and edit audiences and also do Audience targeting. For example, an audience can be users with prediction probability between 0.4 and 0.7, to represent users who are predicted to be “on the fence” between churning and returning.
- For Firebase Apps, you can use the Import segments feature. You can tailor user experience by targeting your identified users through Firebase services such as Remote Config, Cloud Messaging, and In-App Messaging. This will involve importing the segment data from BigQuery into Firebase. After that you can send notifications to the users, configure the app for them, or follow the user journeys across devices.
- Run targeted marketing campaigns via CRMs like Salesforce, e.g. send out reminder emails.
You can find all of the code used in this blogpost in the Github repository:
What’s next?
Continuous model evaluation and re-training
As you collect more data from your users, you may want to regularly evaluate your model on fresh data and re-train the model if you notice that the model quality is decaying.
Continuous evaluation—the process of ensuring a production machine learning model is still performing well on new data—is an essential part in any ML workflow. Performing continuous evaluation can help you catch model drift, a phenomenon that occurs when the data used to train your model no longer reflects the current environment.
To learn more about how to do continuous model evaluation and re-train models, you can read the blogpost: Continuous model evaluation with BigQuery ML, Stored Procedures, and Cloud Scheduler
More resources
If you’d like to learn more about any of the topics covered in this post, check out these resources:
- BigQuery export of Google Analytics data
- BigQuery ML quickstart
- Events automatically collected by Google Analytics 4
- Qwiklabs: Create ML models with BigQuery ML
Or learn more about how you can use BigQuery ML to easily build other machine learning solutions:
- How to build demand forecasting models with BigQuery ML
- How to build a recommendation system on e-commerce data using BigQuery ML
Let us know what you thought of this post, and if you have topics you’d like to see covered in the future! You can find us on Twitter at @polonglin and @_mkazi_.Thanks to reviewers: Abhishek Kashyap, Breen Baker, David Sabater Dinter.
Principles to Make Organizations Data Engineering Driven

4836
Of your peers have already read this article.
4:00 Minutes
The most insightful time you'll spend today!
In the “What type of data processing organisation” paper, we examined that you can build a data culture whether your organization consists mostly of data analysts, or data engineers, or data scientists. However, the path and technologies to become a data-driven innovator are different and success comes from implementing the right tech in a way that matches a company’s culture. In this blog we will expand the data engineering driven organizations and provide how it can be built from the first principles.
Not all organizations are alike. All companies have similar functions (sales, engineering, marketing), but not all functions have the same influence on the overall business decisions. Some companies are more engineering-driven, others are sales-driven, others are marketing-driven. In practice, all companies are a mixture of all these functions. In the same way, the data strategy can be more focused on data analysts, and others on data engineering. Culture is a combination of several factors, business requirements, organizational culture, and skills within the organization.
Traditionally organizations that focused on engineering mainly came from technology driven digital backgrounds. They built their own frameworks or used programming frameworks to build repeatable data pipelines. Some of this is due to the way the data is received, the shape the data is received and the speed of the data arrival as well. If your data allows it, your organization can be more focused on data analysis, and not so much on data engineering. If you can apply an Extract-Load-Transform approach (ELT) rather than the classic Extract-Transform-Load (ETL), then you can focus on data analysis and might not need extensive data engineering capability. For example, data that can be loaded directly into the data warehouse allows data analysts to also do data engineering work and apply transformations to the data.
This does not happen so often though. Sometimes your data is messy, inconsistent, bulky, and encoded in legacy file formats or as part of legacy databases or systems, with a little potential to be actionable by data analysts.
Or maybe you need to process data in streaming, applying complex event processing to obtain competitive insights in near real time. The value of data decays exponentially with time. Most companies can process data by the next day in batch mode. However, not so many are probably obtaining such knowledge the next second data is produced.
In these situations, you need the talent to unveil the insights hidden in that amalgam of data, either messy or fast changing (or both!). And almost as importantly, you need the right tools and systems to enable that talent too.
What are those right tools? Cloud provides the scalability and flexibility for data workloads that are required in such complex situations. Long gone are the times when data teams had to beg for the resources that were required to have an impact in the business. Data processing systems are no longer scarce, so your data strategy should not generate that scarcity artificially.
In this article, we explain how to leverage Google Cloud to enable data teams to do complex processing of data, in batch and streaming. By doing so, your data engineering and science teams can have an impact when (in seconds) after the input data is generated.
Data engineering driven organizations
When the complexity of your data transformation needs is high, data engineers have a central role in the data strategy of your company, leading to data engineering driven organization. In this type of organization, data architectures are organized in three layers: business data owners, data engineers, and data consumers.
Data engineers are at the crossroads between data owners and data consumers, with clear responsibilities:
- Transporting data, enriching data whilst building integrations between analytical systems and operational systems ( as in the real time use cases)
- Parsing and transforming messy data coming from business units into meaningful and clean data, with documented metadata
- Applying DataOps, that is, functional knowledge of the business plus software engineering methodologies applied to the data lifecycle
- Deployment of models and other artifacts analyzing or consuming data
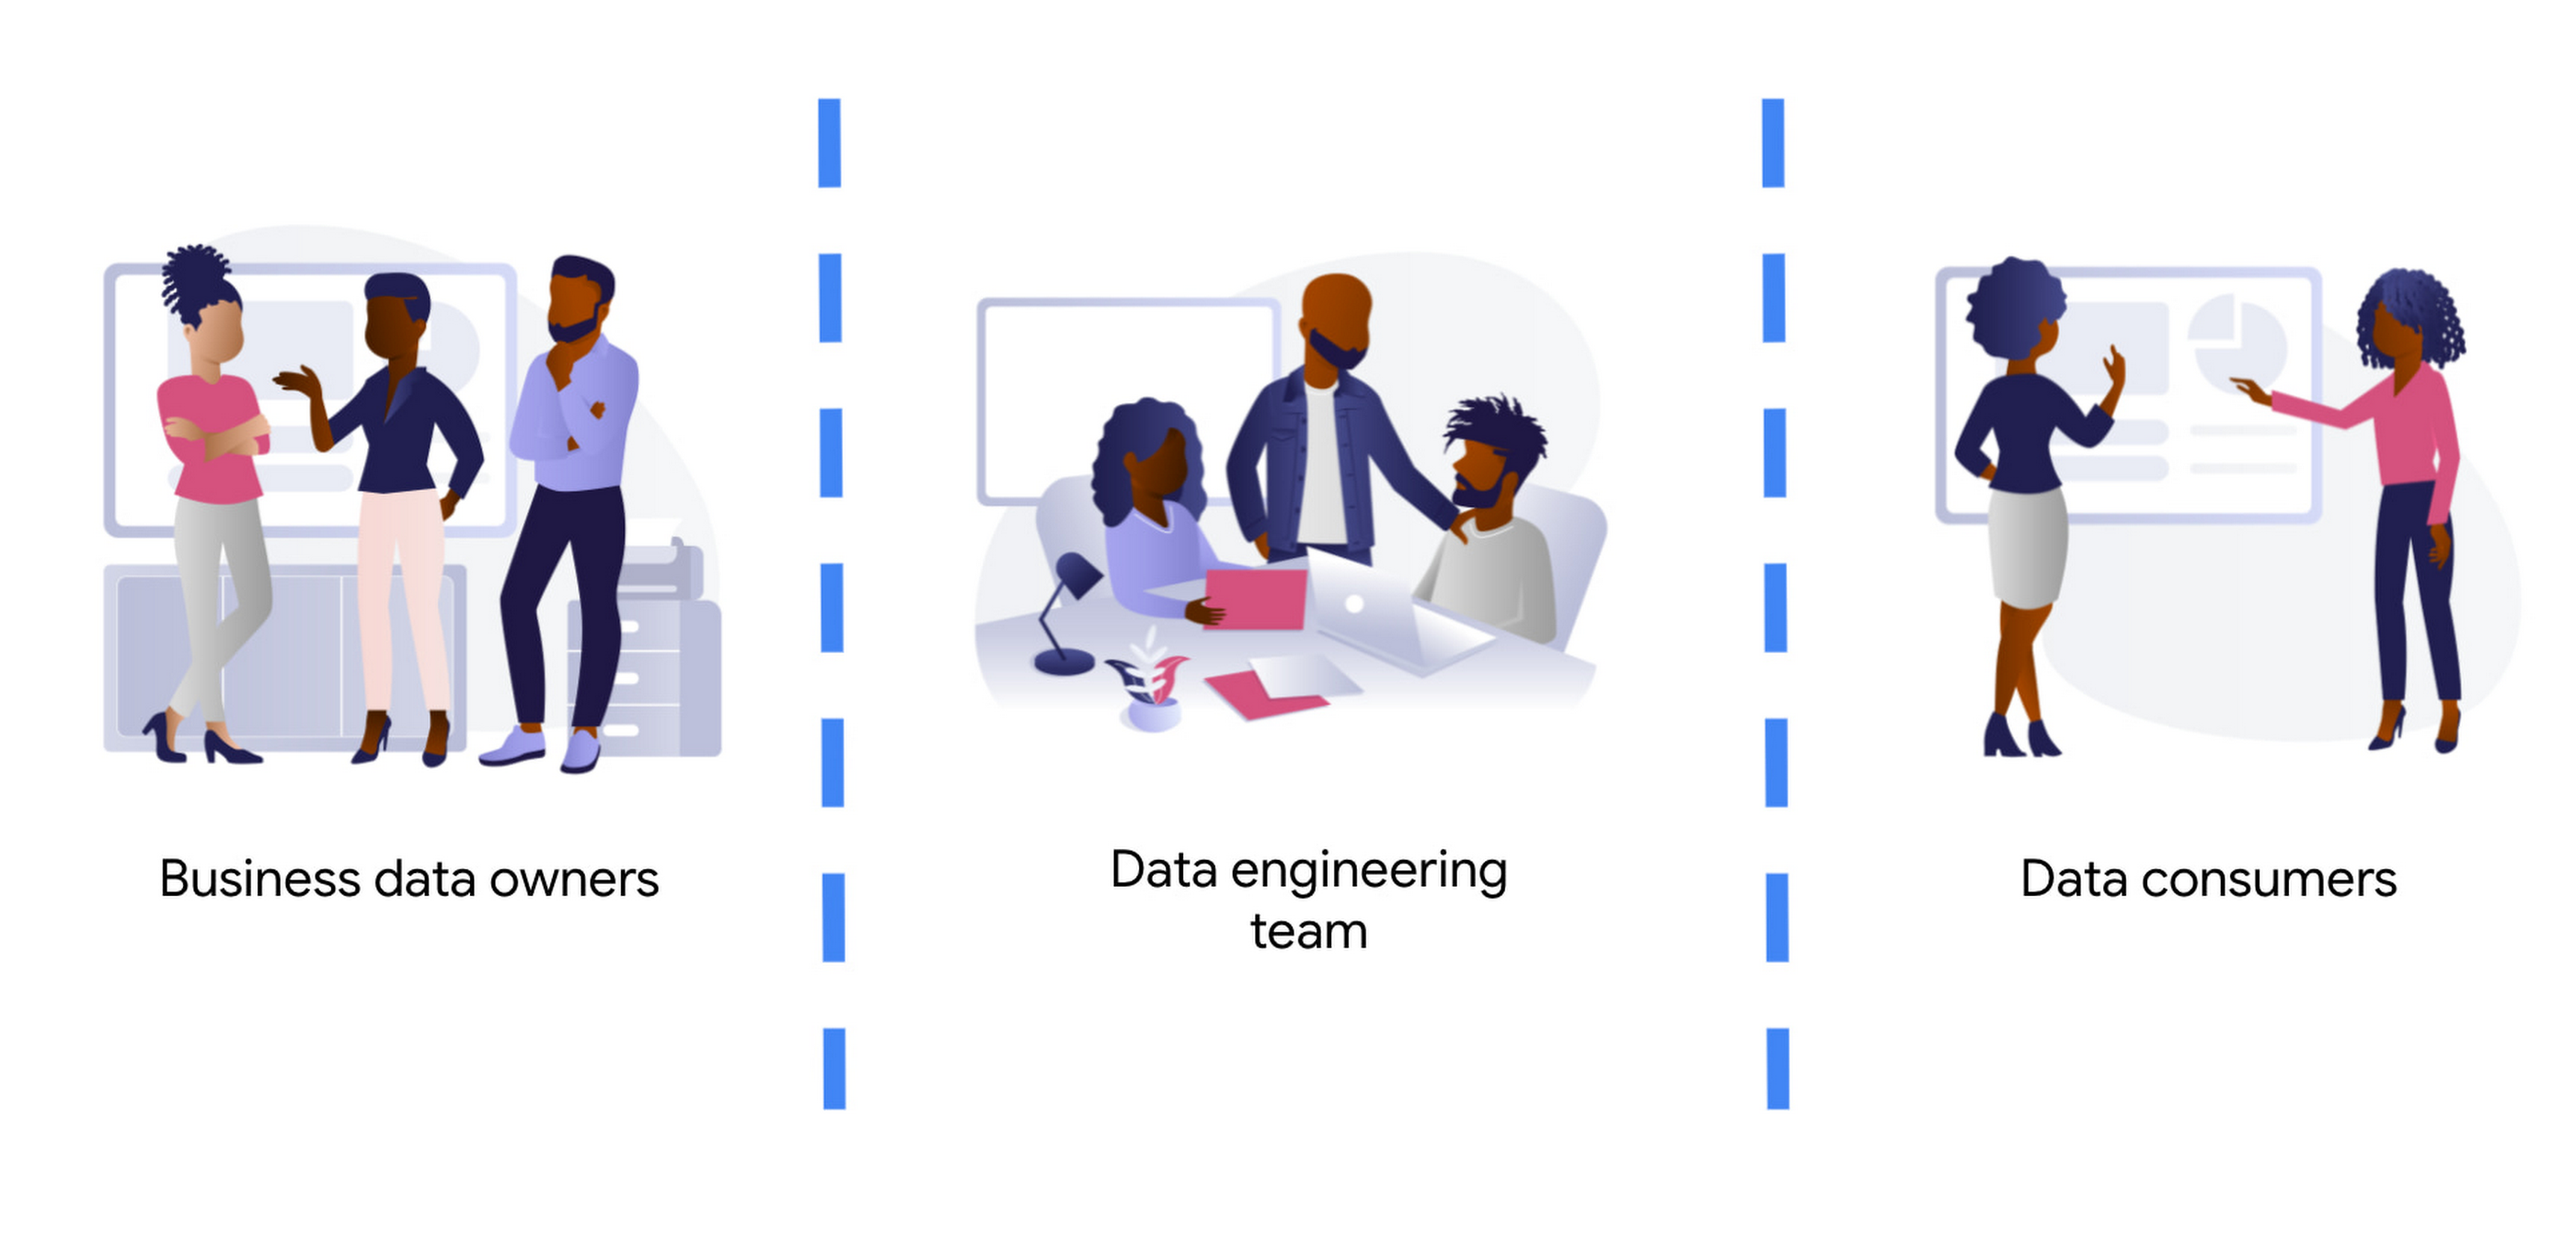
Business data owners are cross-functional domain-oriented teams. These teams know the business in detail, and are the source of data that feeds the data architecture. Sometimes these business units may also have some data-specific roles, such as data analysts, data engineers, or data scientists, to work as interfaces with the rest of the layers. For instance, these teams may design a business data owner, that is the point of contact of a business unit in everything that is related to the data produced by the unit.
At the other end of the architecture, we find the data consumers. Again, also cross-functional, but more focused on extracting insights from the different data available in the architecture. Here we typically find data science teams, data analysts, business intelligence teams, etc. These groups sometimes combine data from different business units, and produce artifacts (machine learning models, interactive dashboards, reports, and so on). For deployment, they require the help of the data engineering team so that data is consistent and trusted.
At the center of these crossroads, we find the data engineering team. Data engineers are responsible for making sure that the data generated and needed by different business units gets ingested into the architecture. This job requires two disparate skills: functional knowledge and data engineering/software development skills. This is often coined under the term DataOps (which evolved from DevOps methodologies developed within the past decades but applied to data engineering practices).
Data engineers have another responsibility too. They must help in the deployment of artifacts produced by the data consumers. Typically, the data consumers do not have the deep technical skills and knowledge to take the sole responsibility for deployment of their artifacts.This is also true for highly sophisticated data science teams. So data engineers must add other skills under their belt: machine learning and business intelligence platform knowledge. Let’s clarify this point, we don’t expect data engineers to become machine learning engineers. Data engineers need to understand ML to ensure that the data delivered to the first layer of a model ( the input ) is correct. They will also become key when delivering that first layer of data in the inference path, as here the data engineering skills around scale / HA etc really need to shine.
By taking the responsibility of parsing and transforming messy data from various business units, or for ingesting in real time, data engineers allow the data consumers to focus on creating value. Data science and other types of data consumers are abstracted away from data encodings, large files, legacy systems, complex message queue configurations for streaming. The benefits of concentrating that knowledge in a highly skilled data engineering team are clear, notwithstanding that other teams (business units and consumers) may also have their data engineers to work as interfaces with other teams. More recently, we even see squads created with members of the business units (data product owners), data engineers, data scientists, and other roles. Effectively creating complete teams with autonomy and full responsibility over a data stream, from the incoming data down to the data driven decision with impact in the business.
Reference architecture – Serverless
The number of skills required for the data engineering team is vast and diverse. We should not make it harder by expecting the team to maintain the infrastructure where they run data pipelines. They should be focusing on how to cleanse, transform, enrich, and prepare the data rather than how much memory or how many cores their solution may require.
The reference architectures presented here are based on the following principles:
- Serverless no-ops technologies
- Streaming-enabled for low time-to-insight
We present different alternatives, based on different products available in Google Cloud:
- Dataflow, the built-in streaming analytics platform in Google Cloud
- Dataproc, the Google Cloud’s managed platform for Hadoop and Spark.
- Data Fusion, a codeless environment for creating and running data pipelines
Let’s dig into these principles.
By using serverless technology we eliminate the maintenance burden from the data engineering team, and we provide the necessary flexibility and scalability for executing complex and/or large jobs. For example, scalability is essential when planning for traffic spikes during mega Friday for retailers. Using serverless solutions allows retailers to look into how they are performing during the day. They no longer need to worry about resources needed to process massive data generated during the day.
The team needs to have full control and write their own code for the data pipelines because of the type of pipelines that the team develops. This is true either for batch or streaming pipelines. In batch, the parsing requirements can be complex and no off the shelf solution works. In streaming, if the team wants to fully leverage the capabilities of the platform, they should implement all the complex business logic that is required, without artificially simplifying the complexity in exchange for some better latency. They can develop a pipeline that achieves a low latency with highly complex business logic. This again requires the team to start writing code from first principles.
However, that the team needs to write code should not imply that they need to rewrite any existing piece of code. For many input/output systems, we can probably reuse code from patterns, snippets, and similar examples. Moreover, a logical pipeline developed by a data engineering team does not necessarily need to map to a physical pipeline. Some parts of the logic can be easily reused by using technologies like Dataflow templates, and use those templates in orchestration with other custom developed pipelines. This brings the best of both worlds (reuse and rewrite), while saving precious time that can be dedicated to higher impact code rather than common I/O tasks. The reference architecture presented has another important feature: the possibility to transform existing batch pipelines to streaming.
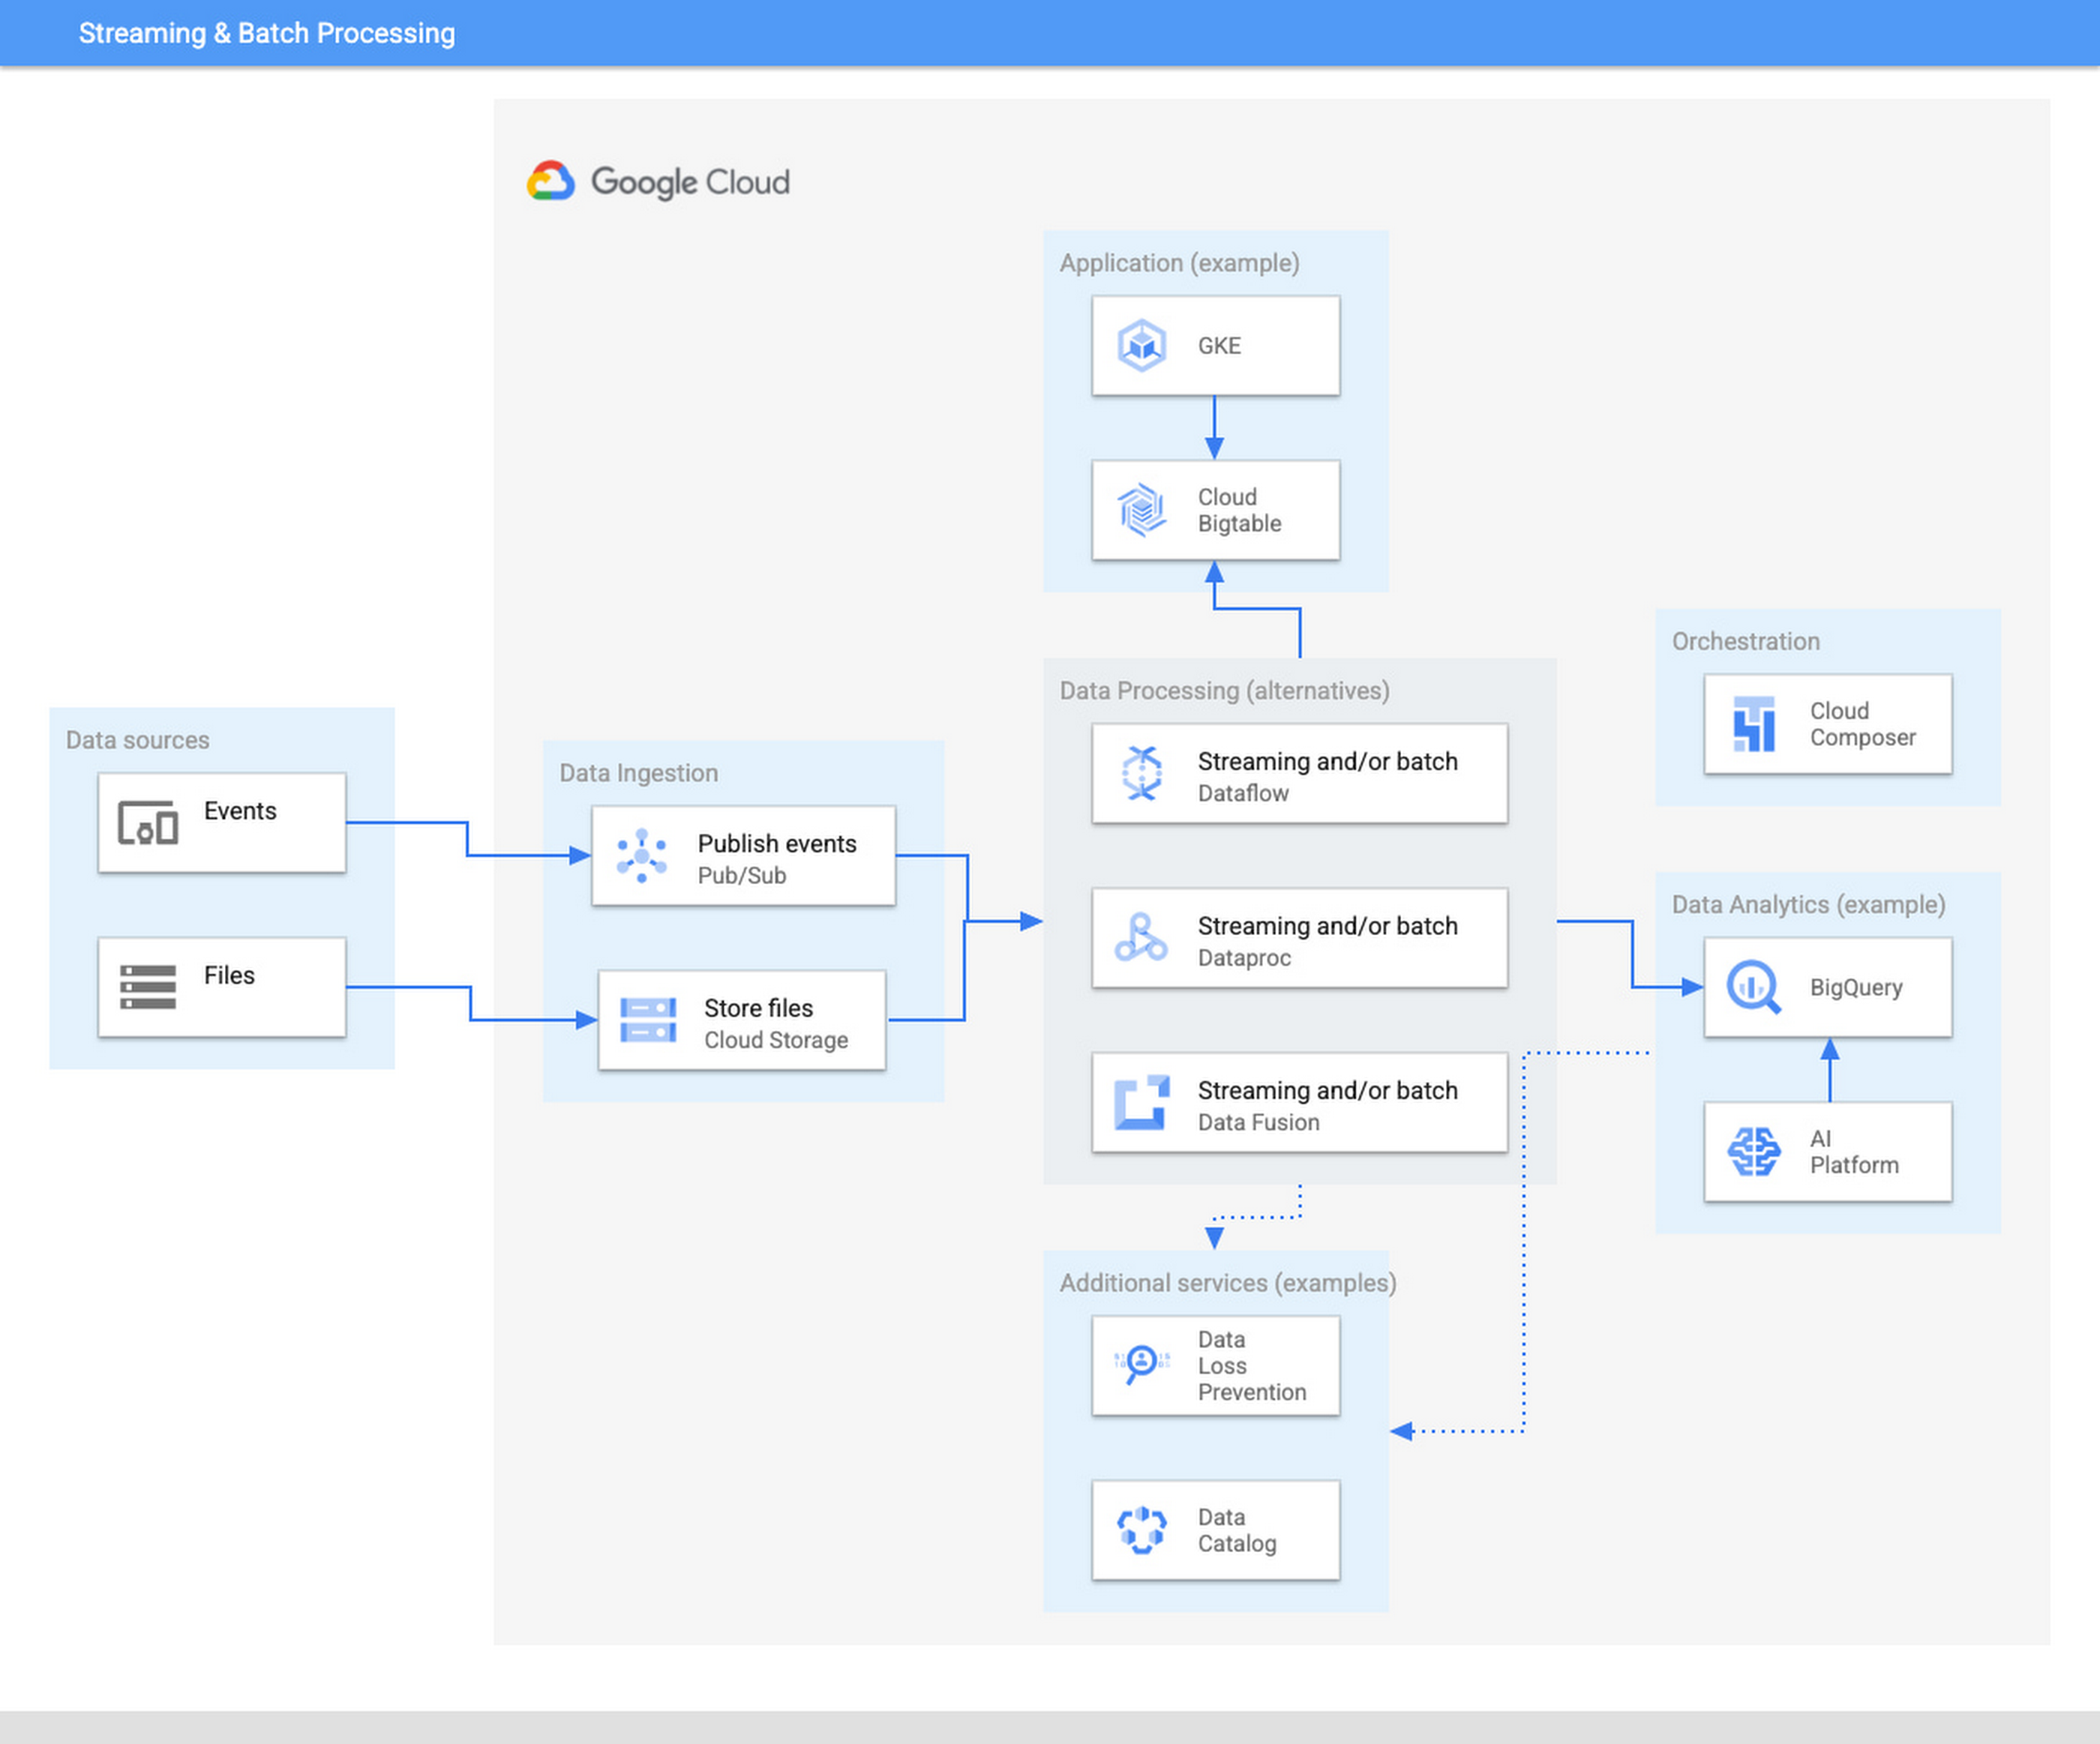
The ingestion layer consists of Pub/Sub for real time and Cloud Storage for batch and does not require any preallocated infrastructure. Both Pub/Sub and Cloud Storage can be used for a range of cases as it can automatically scale up with the input workload.
Once the data has been ingested, our proposed architecture follows the classical division in three stages: Extract, Transform, and Load (ETL). For some types of files, direct ingestion into BigQuery (following an ELT approach) is also possible.
In the transform layer, we primarily recommend Dataflow as the data process component. Dataflow uses Apache Beam as SDK. The main advantage of Apache Beam is the unified model for batch and streaming processing. As mentioned before, the same code can be adapted to run in batch or streaming by adapting input and output. For instance, switching the input from files in Cloud Storage to messages published in a topic in Pub/Sub.
One of the alternatives to Dataflow in this architecture is Dataproc, Google Cloud’s solution for managed Hadoop and Spark clusters. The main use case is for those teams that are migrating to Google Cloud but have large amounts of inherited code in Spark or Hadoop. Dataproc enables a direct path to the cloud, without having to review all those pipelines.
Finally, we also present the alternative of Data Fusion, a codeless environment for creating data pipelines using a drag-and-drop interface. Data Fusion actually uses Dataproc as its Compute Engine, so everything we have mentioned earlier applies also to the case of Data Fusion. If your team prefers to create data pipelines without having to write any code, Data Fusion is the right tool.
So in summary, these are the three recommended components for the transform layer:
- Dataflow, powerful and versatile with a unified model for batch and streaming processing. Straightforward path to move from batch processing to streaming
- Dataproc, for those teams that want to reuse existing code from Hadoop or Spark environments.
- Data Fusion, if your team does not want to write any code.
Challenges and opportunities
Data platforms are complex. Having on top of that data responsibility the duty to maintain infrastructure is a wasteful use of valuable skills and talent. Often data teams end up managing infrastructure rather than focusing on analyzing the data. The architecture presented in this article liberates the data engineering team from having to allocate infrastructure and tweak clusters but instead to focus on providing value through data processing pipelines.
For data engineers to focus on what they do best, you need to fully leverage the cloud. A lift & shift approach from any on-premise installation is not going to provide that flexibility and liberation. You need to leverage serverless technologies. As an added advantage, serverless lets you also scale your data processing capabilities with your needs, and be able to respond to peaks of activity, however large these are.
Serverless technologies sometimes face the doubts of practitioners: will I be locked in with my provider if I fully leverage serverless? This is actually a question that you should be asking when deciding whether to set up your architecture on top of a provider.
The components presented here for data processing are based on open source technologies, and fully interoperable with other open source equivalent components. Dataflow uses Apache Beam, which not only unifies batch and streaming, but also offers a widely compatible runner. You can take your code elsewhere to any other runner. For instance, Apache Flink or Apache Spark. Dataproc is a fully managed Hadoop and Spark based on the vanilla open source components of this ecosystem. Data Fusion is actually the Google Cloud version of CDAP, an open source project.
On the other hand, for the serving layer, BigQuery is based on standard Ansi SQL. Whereas in the case of Bigtable and Google Kubernetes Engine, Bigtable is compatible at API level with HBase, and Kubernetes is an open source component.
In summary, when your components are based on open source, like the ones included in this architecture, serverless does not lock you in. The skills required to encode business logic in the form of data processing pipelines are based on engineering principles that remain stable across time. The same principles apply if you are using Hadoop, Spark, or Dataflow or UI driven ETL tooling. In addition, there are now new capabilities, such as low-latency streaming, that were not available before. A team of data engineers that learn the fundamental principles of data engineering will be able to quickly leverage those additional capabilities.
Our recommended architecture separates the logical level, the code of your applications, from the infrastructure where they run. This enables data engineers to focus on what they do best and on where they provide the highest added value. Let your Dataflow and your engineers impact your business, by adopting the technologies that liberate them and allow them to focus on adding business value. To learn more about building an unified data analytics platform, take a look at our recently published Unified Data Analytics Platform paper and Converging Architectures paper.
HSBC Overcomes Capacity Challenges and Innovation-Blocks With Google BigQuery

3999
Of your peers have already read this article.
3:45 Minutes
The most insightful time you'll spend today!
At HSBC, we serve 39 million customers, in-person and online, from consumers to businesses, in 66 countries. We maintain data centers in 21 countries, with more than 94,000 servers. With an on-premises infrastructure supporting our business, we kept running into capacity challenges, which really became an innovation blocker and ultimately a business constraint.
Our teams wanted to do more with data to create better products and services, but the technology tools we had weren’t letting us grow and explore. And that data was growing continually. Just one of our data warehouses had grown 300% from 2014 to 2018.
We had a huge amount of data, but what’s the point of having all that data if we couldn’t get insights and business value from it? We wanted to serve our customers flexibly, in the ways that work best for them.
We knew moving to cloud would let us store and process more data, but as a global bank, we were moving complex systems that needed to also be secure.
It was a team effort to create the project scope and strategy up front, and it paid off in the end. Our cloud migration now enables us to use an agile, DevOps mindset, so we can fail fast and deliver smaller workloads, with automation built in along the way.
This migration also helped us eliminate technical debt and build a data platform that lets us focus on innovation, not managing infrastructure. Along the way, we invented new technology and built processes that we can use as we continue migrating.
Planning for a cloud move
We chose cloud migration because we knew we needed cloud capabilities for our business to really reach its digital potential. We picked Google Cloud, specifically BigQuery, because it’s super fast over small and large datasets, and because we could use both a SQL interface and Connected Sheets to interact with it.
We had to move our data and its schema into the cloud—without having to manually manage every detail and miss the timelines we had set. Our data warehouse is huge, complex, and mission-critical, and didn’t easily lend itself to fit into existing reference architectures. We needed to plan ahead and automate to make sure the migration was efficient, and to ensure we could simplify data and processes along the way.
The first legacy data warehouse we migrated had been built over a period of 15 years, with 30 years worth of data comprising millions of transactions and 180 TB of data.
It ran 6,500 extract, transform, load (ETL) jobs and more than 2,500 reports, getting data from about 100 sources. Cloud migration choices usually involves either re-engineering or lift-and-shift, but we decided on a different strategy for ours: move and improve.
This allowed us to take full advantage of BigQuery’s capabilities, including its capacity and elasticity, to help solve our essential problem of capacity constraints.
Taking the first steps to cloud
We started creating our cloud strategy through a mapping exercise, which also helped start the change management process among internal teams. We chose architecture decision records as our migration approach, basing those on technical user journeys, which we mapped out using an agile board. User journeys included things like “change data capture,” “product event handling,” or “slowly changing dimensions.”
These are typical data warehouse topics that have to be addressed when going through a migration, and we had others more specific to the financial services industry, too.
For example, we needed to make sure the data warehouse would have a consistent, golden source of data at a specific point in time. We considered business impacts as well, so we prioritized initially moving archival and historical data to immediately take load off of the old system.
We also worked to establish metrics early on and introduce new concepts, like managing queries and quotas rather than managing hardware, so that data warehouse users would be prepared for the shift to cloud.
To simplify as we went, we examined what we currently had stored in our data warehouse to see what was used or unused. We worked with stakeholders to assess reports, and identified about 600-plus reports that weren’t being used that we could deprecate. We also examined how we could simplify our ETL jobs to remove the technical debt added by previous migrations, giving our production support teams a bit more sleep at night.
We used a three-step migration strategy for our data: first, migrating schema to BigQuery; second, migrating the reporting load to BigQuery, adding metadata tagging and performing the reconciliation process; and third, moving historical data by converting all the SQL script into data into BigQuery-compliant scripts.
Creating new tools for migration automation
In keeping with our automation mantra, we invented multiple accelerators to speed up migration. We developed these to meet the timelines we’d set, and to eliminate human error.
The schema parser and data reconciliation tool helped us migrate our data layer onto BigQuery. SQL parser helped migrate the data access layer onto Google Cloud Platform (GCP) without having to individually migrate 3,500 SQL instances that don’t have data lineage or documentation. This helped us to prioritize workloads.
And the data lineage tool identified components across layers to find dependencies. This was essential for finding and eliminating integration issues during the planning stage, and for identifying application owners during the migration. Finally, the data reconciliation tool reconciles any discrepancies between the data source and the cloud data target.
Building a cloud future
We used this first migration in our UK data center as a template, so we now have a tailored process and custom tools that we’re confident using going forward.
Our careful approach has paid off for our teams and our customers. We’re enjoying better development and testing procedures. We’ve created an onboarding path for applications, we have a single source of truth in our data warehouse, and we use authorized views for secure data access. The flexibility and scalable capacity of BigQuery means that users can explore data without constraints and our customers get the information they need, faster.
Cloud Spanner Powers Vimeo to Deliver Consistent UX for across Content

3508
Of your peers have already read this article.
3:00 Minutes
The most insightful time you'll spend today!
Editor’s note: The video platform Vimeo leverages managed database services from Google Cloud to serve up billions of views around the world each day. Here’s how they deliver a consistent user experience across all their content.
Vimeo is the world’s leading video software solution, powering hundreds of thousands of new uploads every day and billions of views. At our scale, it’s paramount that we retain a seamless user experience across all of the videos hosted, shared, and viewed on our platform. With managed database services from Google Cloud, we’ve been able to deliver a consistent and reliable user experience no matter where our users and their audiences are.
https://youtube.com/watch?v=ggpAUgEL2iE%3Fenablejsapi%3D1%26
Outgrowing the data center and gaining more scale
Our first exposure to Google Cloud was the excellent performance between Google Compute Engine (GCE) and Google Cloud Storage (GCS), which we used to design a really high quality playback and upload environment for our customers’ videos. At first we were simply creating cloud-based packaging and delivery of their content, but the bulk of our application ran on an on-premises MySQL database. Seeing the gains from our initial investment in GCE and GCS, we decided to fully migrate to Google Cloud.
We started by lifting and shifting our workloads from our on-premises deployments to GCE. But we quickly realized we had to redesign our application to deliver higher availability and responsiveness for an exceptional user experience, which led us to Cloud Spanner, a distributed SQL database management and storage service. With Spanner, we found all the benefits of a relational semantics database with global scale, allowing us to add more nodes with the push of a button.
Today we have a multi-region instance with 99.999% uptime, so we’re confident it can handle our video workloads. We use about 16 Spanner nodes to cover approximately 50.8 billion rows and about 4.5 terabytes of storage/disk space. And with the launch of Video Library, we have the scale we need to fundamentally change the way organizations handle content.
Using Spanner as a time machine during migration
During the initial migration, we wanted to ensure an accurate data transfer with as few errors or bugs as possible. When we moved data from MySQL tables into Spanner, we ran spot analyses to check for potential problems. If the data didn’t match, Spanner allowed us to revert to the original in a single click. Through Spanner we could check stale timestamps or past users. It almost functioned like a time machine by offering point-in-time recovery functionality.
Serving up any video at any time
We work with a long tail of content. Depending on how popular a video is, we take a different approach to storing it. We cache the most popular material so it’s immediately accessible and use Cloud Spanner to ensure it’s highly available across multiple regions. On the flip side, we use Cloud SQL for some lower volume satellite services that support other components of the application that don’t require the same guarantees or performance that Cloud Spanner provides.
As our millions of users continue to upload their own videos, Spanner also acts as a video metadata indexing and cataloging service. When we need to play back a particular video, we can quickly and easily find it in a sea of content. It’s crucial that our database is highly available and reliable so the playback experience is seamless for our users.
To learn more about Vimeo, visit our site.
Learn more about how your organization can use Cloud Spanner.
More Relevant Stories for Your Company

What is Cloud SQL for SQL Server? And What Do IT Departments Say About It?
At Google Cloud, we develop our database services to meet the needs of enterprise teams wherever they are in their cloud journey. That is why we announce launched Cloud SQL for SQL Server and make it available to all of our customers. This addition to our database lineup means you can migrate

Experts’ Guideline for Personalizing Platforms with the Right Recommendation System on Google Cloud
Over the past two decades, consumers have become accustomed to receiving personalized recommendations in all facets of their online life. Whether that be recommended products while shopping on Amazon, a curated list of apps in the Google Play store, or relevant videos to watch next on YouTube. In fact, in

Google Data Cloud: The Catalyst for Modern App Development and Innovation
97 zettabytes was the estimated volume of data generated worldwide in 20221. This sort of explosion in data volume is happening in every enterprise. Now imagine being able to access all this data you own from anywhere, at any time, analyze it, and leverage its insights to innovate your products

Why Data Cloud Matters for Business Transformation
I’m so excited to be part of Google Cloud. Data has been a longstanding part of my career and it is at the heart of business transformation. Many companies have mastered the ability to collect data and have mechanisms in place to draw on some of it to solve business
