






7694
Of your peers have already downloaded this article
4:30 Minutes
The most insightful time you'll spend today!
10170
Of your peers have already watched this video.
1:00 Minutes
The most insightful time you'll spend today!
Predict User Churn on Gaming Apps with Google Analytics Data using BigQuery ML
User retention can be a major challenge for mobile game developers. According to the Mobile Gaming Industry Analysis in 2019, most mobile games only see a 25% retention rate for users after the first day. To retain a larger percentage of users after their first use of an app, developers can take steps to motivate and incentivize certain users to return. But to do so, developers need to identify the propensity of any specific user returning after the first 24 hours.
In this blog post, we will discuss how you can use BigQuery ML to run propensity models on Google Analytics 4 data from your gaming app to determine the likelihood of specific users returning to your app.
You can also use the same end-to-end solution approach in other types of apps using Google Analytics for Firebase as well as apps and websites using Google Analytics 4. To try out the steps in this blogpost or to implement the solution for your own data, you can use this Jupyter Notebook.
Using this blog post and the accompanying Jupyter Notebook, you’ll learn how to:
- Explore the BigQuery export dataset for Google Analytics 4
- Prepare the training data using demographic and behavioural attributes
- Train propensity models using BigQuery ML
- Evaluate BigQuery ML models
- Make predictions using the BigQuery ML models
- Implement model insights in practical implementations
Google Analytics 4 (GA4) properties unify app and website measurement on a single platform and are now default in Google Analytics. Any business that wants to measure their website, app, or both, can use GA4 for a more complete view of how customers engage with their business. With the launch of Google Analytics 4, BigQuery export of Google Analytics data is now available to all users. If you are already using a Google Analytics 4 property, you can follow this guide to set up exporting your GA data to BigQuery.
Once you have set up the BigQuery export, you can explore the data in BigQuery. Google Analytics 4 uses an event-based measurement model. Each row in the data is an event with additional parameters and properties. The Schema for BigQuery Export can help you to understand the structure of the data.
In this blogpost, we use the public sample export data from an actual mobile game app called “Flood It!” (Android, iOS) to build a churn prediction model. But you can use data from your own app or website.
Here’s what the data looks like. Each row in the dataset is a unique event, which can contain nested fields for event parameters.
SELECT *FROM `firebase-public-project.analytics_153293282.events_*`TABLESAMPLE SYSTEM (1 PERCENT)

This dataset contains 5.7M events from over 15k users.
SELECTCOUNT(DISTINCT user_pseudo_id) as count_distinct_users,COUNT(event_timestamp) as count_eventsFROM`firebase-public-project.analytics_153293282.events_*

Our goal is to use BigQuery ML on the sample app dataset to predict propensity to user churn or not churn based on users’ demographics and activities within the first 24 hours of app installation.

In the following sections, we’ll cover how to:
- Pre-process the raw event data from GA4
- Identify users & the label feature
- Process demographic features
- Process behavioral features
- Train classification model using BigQuery ML
- Evaluate the model using BigQueryML
- Make predictions using BigQuery ML
- Utilize predictions for activation
Pre-process the raw event data
You cannot simply use raw event data to train a machine learning model as it would not be in the right shape and format to use as training data. So in this section, we’ll go through how to pre-process the raw data into an appropriate format to use as training data for classification models.
This is what the training data should look like for our use case at the end of this section:

Notice that in this training data, each row represents a unique user with a distinct user ID (user_pseudo_id).
Identify users & the label feature
We first filtered the dataset to remove users who were unlikely to return the app anyway. We defined these ‘bounced’ users as ones who spent less than 10 mins with the app. Then we labeled all remaining users:
- churned: No event data for the user after 24 hours of first engaging with the app.
- returned: The user has at least one event record after 24 hours of first engaging with the app.
For your use case, you can have a different definition of bounce and churning. Also you can even try to predict something else other than churning, e.g.:
- whether a user is likely to spend money on in-game currency
- likelihood of completing n-number of game levels
- likelihood of spending n amount of time in-game etc.
In such cases, label each record accordingly so that whatever you are trying to predict can be identified from the label column.
From our dataset, we found that ~41% users (5,557) bounced. However, from the remaining users (8,031), ~23% (1,883) churned after 24 hours:
SELECTbounced,churned,COUNT(churned) as count_usersFROMbqmlga4.returningusersGROUP BY 1,2ORDER BY bounced

To create these bounced and churned columns, we used the following snippet of SQL code.
...#churned = 1 if last_touch within 24 hr of app installation, else 0IF (user_last_engagement < TIMESTAMP_ADD(user_first_engagement,INTERVAL 24 HOUR),1,0 ) AS churned,#bounced = 1 if last_touch within 10 min, else 0IF (user_last_engagement <= TIMESTAMP_ADD(user_first_engagement,INTERVAL 10 MINUTE),1,0 ) AS bounced,...
You can view the Jupyter Notebook for the full query used for materializing the bounced and churned labels.
Process demographic features
Next, we added features both for demographic data and for behavioral data spanning across multiple columns. Having a combination of both demographic data and behavioral data helps to create a more predictive model.
We used the following fields for each user as demographic features:
geo.countrydevice.operating_systemdevice.language
A user might have multiple unique values in these fields — for example if a user uses the app from two different devices. To simplify, we used the values from the very first user engagement event.
CREATE OR REPLACE VIEW bqmlga4.user_demographics AS (WITH first_values AS (SELECTuser_pseudo_id,geo.country as country,device.operating_system as operating_system,device.language as language,ROW_NUMBER() OVER (PARTITION BY user_pseudo_id ORDER BY event_timestamp DESC) AS row_numFROM `firebase-public-project.analytics_153293282.events_*`WHERE event_name="user_engagement")SELECT * EXCEPT (row_num)FROM first_valuesWHERE row_num = 1 #first engagement);
Process behavioral features
There is additional demographic information present in the GA4 export dataset, e.g. app_info, device, event_params, geo etc. You may also send demographic information to Google Analytics through each hit via user_properties. Furthermore, if you have first-party data on your own system, you can join that with the GA4 export data based on user_ids.
To extract user behavior from the data, we looked into the user’s activities within the first 24 hours of first user engagement. In addition to the events automatically collected by Google Analytics, there are also the recommended events for games that can be explored to analyze user behavior. For our use case, to predict user churn, we counted the number of times the follow events were collected for a user within 24 hours of first user engagement:
user_engagementlevel_start_quickplaylevel_end_quickplaylevel_complete_quickplaylevel_reset_quickplaypost_scorespend_virtual_currencyad_rewardchallenge_a_friendcompleted_5_levelsuse_extra_steps
The following query shows how these features were calculated:
WITHevents_first24hr AS (SELECTe.*FROM`firebase-public-project.analytics_153293282.events_*` eJOINbqmlga4.returningusers rONe.user_pseudo_id = r.user_pseudo_idWHERETIMESTAMP_MICROS(e.event_timestamp) <= r.ts_24hr_after_first_engagement)SELECTuser_pseudo_id,SUM(IF(event_name = 'user_engagement', 1, 0)) AS cnt_user_engagement,# ... repeated for all behavior data ...SUM(IF(event_name = 'use_extra_steps', 1, 0)) AS cnt_use_extra_steps,FROMevents_first24hrGROUP BY1
View the notebook for the query used to aggregate and extract the behavioral data. You can use different sets of events for your use case. To view the complete list of events, use the following query:
SELECTevent_name,COUNT(event_name) as event_countFROM`firebase-public-project.analytics_153293282.events_*`GROUP BY 1ORDER BYevent_count DESC
After this we combined the features to ensure our training dataset reflects the intended structure. We had the following columns in our table:
- User ID:
user_pseudo_id
- Label:
churned
- Demographic features
countrydevice_osdevice_language
- Behavioral features
cnt_user_engagementcnt_level_start_quickplaycnt_level_end_quickplaycnt_level_complete_quickplaycnt_level_reset_quickplaycnt_post_scorecnt_spend_virtual_currencycnt_ad_rewardcnt_challenge_a_friendcnt_completed_5_levelscnt_use_extra_stepsuser_first_engagement
At this point, the dataset was ready to train the classification machine learning model in BigQuery ML. Once trained, the model will output a propensity score between churn (churned=1) or return (churned=0) indicating the probability of a user churning based on the training data.
Train classification model
When using the CREATE MODEL statement, BigQuery ML automatically splits the data between training and test. Thus the model can be evaluated immediately after training (see the documentation for more information).
For the ML model, we can choose among the following classification algorithms where each type has its own pros and cons:

Often logistic regression is used as a starting point because it is the fastest to train. The query below shows how we trained the logistic regression classification models in BigQuery ML.
CREATE OR REPLACE MODEL bqmlga4.churn_logregTRANSFORM(EXTRACT(MONTH from user_first_engagement) as month,EXTRACT(DAYOFYEAR from user_first_engagement) as julianday,EXTRACT(DAYOFWEEK from user_first_engagement) as dayofweek,EXTRACT(HOUR from user_first_engagement) as hour,* EXCEPT(user_first_engagement, user_pseudo_id))OPTIONS(MODEL_TYPE="LOGISTIC_REG",INPUT_LABEL_COLS=["churned"]) ASSELECT*FROMbqmlga4.train
We extracted month, julianday, and dayofweek from datetimes/timestamps as one simple example of additional feature preprocessing before training. Using TRANSFORM() in your CREATE MODEL query allows the model to remember the extracted values. Thus, when making predictions using the model later on, these values won’t have to be extracted again. View the notebook for the example queries to train other types of models (XGBoost, deep neural network, AutoML Tables).
Evaluate model
Once the model finished training, we ran ML.EVALUATE to generate precision, recall, accuracy and f1_score for the model:
SELECT*FROMML.EVALUATE(MODEL bqmlga4.churn_logreg)

The optional THRESHOLD parameter can be used to modify the default classification threshold of 0.5. For more information on these metrics, you can read through the definitions on precision and recall, accuracy, f1-score, log_loss and roc_auc. Comparing the resulting evaluation metrics can help to decide among multiple models.Furthermore, we used a confusion matrix to inspect how well the model predicted the labels, compared to the actual labels. The confusion matrix is created using the default threshold of 0.5, which you may want to adjust to optimize for recall, precision, or a balance (more information here).
SELECTexpected_label,_0 AS predicted_0,_1 AS predicted_1FROMML.CONFUSION_MATRIX(MODEL bqmlga4.churn_logreg)

This table can be interpreted in the following way:

Make predictions using BigQuery ML
Once the ideal model was available, we ran ML.PREDICT to make predictions. For propensity modeling, the most important output is the probability of a behavior occurring. The following query returns the probability that the user will return after 24 hrs. The higher the probability and closer it is to 1, the more likely the user is predicted to return, and the closer it is to 0, the more likely the user is predicted to churn.
SELECTuser_pseudo_id,returned,predicted_returned,predicted_returned_probs[OFFSET(0)].prob as probability_returnedFROMML.PREDICT(MODEL bqmlga4.churn_logreg,(SELECT * FROM bqmlga4.train)) #can be replaced with a proper test dataset
Utilize predictions for activation
Once the model predictions are available for your users, you can activate this insight in different ways. In our analysis, we used user_pseudo_id as the user identifier. However, ideally, your app should send back the user_id from your app to Google Analytics. In addition to using first-party data for model predictions, this will also let you join back the predictions from the model into your own data.
- You can import the model predictions back into Google Analytics as a user attribute. This can be done using the Data Import feature for Google Analytics 4. Based on the prediction values you can Create and edit audiences and also do Audience targeting. For example, an audience can be users with prediction probability between 0.4 and 0.7, to represent users who are predicted to be “on the fence” between churning and returning.
- For Firebase Apps, you can use the Import segments feature. You can tailor user experience by targeting your identified users through Firebase services such as Remote Config, Cloud Messaging, and In-App Messaging. This will involve importing the segment data from BigQuery into Firebase. After that you can send notifications to the users, configure the app for them, or follow the user journeys across devices.
- Run targeted marketing campaigns via CRMs like Salesforce, e.g. send out reminder emails.
You can find all of the code used in this blogpost in the Github repository:
What’s next?
Continuous model evaluation and re-training
As you collect more data from your users, you may want to regularly evaluate your model on fresh data and re-train the model if you notice that the model quality is decaying.
Continuous evaluation—the process of ensuring a production machine learning model is still performing well on new data—is an essential part in any ML workflow. Performing continuous evaluation can help you catch model drift, a phenomenon that occurs when the data used to train your model no longer reflects the current environment.
To learn more about how to do continuous model evaluation and re-train models, you can read the blogpost: Continuous model evaluation with BigQuery ML, Stored Procedures, and Cloud Scheduler
More resources
If you’d like to learn more about any of the topics covered in this post, check out these resources:
- BigQuery export of Google Analytics data
- BigQuery ML quickstart
- Events automatically collected by Google Analytics 4
- Qwiklabs: Create ML models with BigQuery ML
Or learn more about how you can use BigQuery ML to easily build other machine learning solutions:
- How to build demand forecasting models with BigQuery ML
- How to build a recommendation system on e-commerce data using BigQuery ML
Let us know what you thought of this post, and if you have topics you’d like to see covered in the future! You can find us on Twitter at @polonglin and @_mkazi_.Thanks to reviewers: Abhishek Kashyap, Breen Baker, David Sabater Dinter.
Improving Patient Outcomes with SAVI and Google Cloud’s Innovative Surgical Instrument Tracking

2484
Of your peers have already read this article.
2:30 Minutes
The most insightful time you'll spend today!
Powered by Vertex AI (Google Cloud’s platform for accelerating development and deployment of machine learning models into production), SAVI (Semi Automated Vision Inspection)1 is transforming surgical instrument identification and cataloging, leading to fewer canceled surgeries and easing pressure on surgery waitlists.
Max Kelsen, an analytics and software agency that specializes in machine learning, has worked closely with Google Cloud and Johnson & Johnson MedTech to create a system that can manage tens of thousands of individual devices, their characteristics, and how they apply to each set or tray used by a surgeon. SAVI does this while delivering a one in 10,000 real-world error rate, much faster and more accurately than manual processes currently in use across the industry. Implementing SAVI can also unlock end-to-end visibility and traceability across the surgical set supply chain and provide advanced analytics and insights.
Eliminating time-consuming manual processes
Surgeons need a large number of specialist instruments and devices to complete complex, delicate procedures. Because each tray of these instruments can typically cost more than $350,000, and having every type of set on shelf at every surgical facility is not feasible, manufacturers generally loan them to hospitals for procedures, such as inserting one of the manufacturers’ implants into a patient’s knee. Once a procedure is complete, the hospital returns the instrument tray to the manufacturer for storage and re-distribution to other hospitals as needed.
Each time a hospital returns a tray, the manufacturer needs to check that each instrument is there, correctly placed, cleaned, and fit for the purpose of the next procedure. As each set may hold more than 400 instruments, completing this process manually is complex and time-consuming. While each tray is checked before and after surgery at the hospital, and again when it arrives and leaves the manufacturer’s facility, Max Kelsen finds that 5% of surgeries can still be affected by missing, broken or bent instruments. This has a severe downstream impact on private hospitals in particular, directly affecting patient safety and outcomes; in Australia, for example, around 60% of surgeries are performed in private hospitals.
Johnson & Johnson MedTech has 60,000 surgical trays across the Asia-Pacific, and loans these trays out about 100,000 times per month. The manufacturer approached Max Kelsen to help design and develop a solution to make the supply chain more efficient, and to give more visibility into asset movement. As a Google Cloud Partner specializing in applying machine learning at scale in healthcare contexts, Max Kelsen had the expertise and track record to meet Johnson & Johnson MedTech’s need for a globally scalable solution that was engineered for quality and performance.
The first step was to establish a baseline for the project by determining how long the manufacturer’s team took to process each tray, and to set an efficiency number. We then spent six months determining and evaluating how to deliver a robust, accurate solution that outperformed current manual and labor-intensive methods in processing instruments and trays, globally. Our work included extensive technical feasibility research involving a representative sample for the variety and complexity of sets, trays, and devices needed for different types of surgery, including orthopedics, spinal trauma, and maxillofacial groups.
Working with Google Cloud to accelerate and de-risk the project
This is a familiar problem that is industry-wide. The issue has been widely explored and tried with a number of technologies over several years without producing the scalability and performance results required to make this an appropriate and feasible solution. Google Cloud partnered with Max Kelsen to accelerate and de-risk this large and strategic project for a mutual customer.
Technical feasibility took four months, prior to a year-long production pilot of SAVl in a distribution center in Queensland that services over 100 hospitals. After obtaining enough real-world data and experience to validate that the solution was as scalable and as accurate as needed, an Asia-Pacific rollout of the system commenced. SAVI is now live across Johnson & Johnson MedTech’s operations in Australia, New Zealand, and Japan, garnering recognition with a JAISA excellence award.
Google Cloud machine learning is integral to SAVI. Google Cloud’s technologies were a big differentiator for Max Kelsen’s engineering team in delivering the breakthroughs needed at scale, and in production, to meet Johnson & Johnson MedTech’s needs.
Reducing checking and documentation time
Running SAVI in Google Cloud has reduced the time Johnson & Johnson MedTech needs to check and document inspections of these surgical instrument sets by over 40%. The application also delivers consistent measurable quality that is often hard to measure at scale when using manual processes. During the pandemic, the application enabled Johnson & Johnson MedTech to operate with a lower headcount for the same volume output, enabling the organization to quickly service a backlog of waiting list surgeries.
In addition, the automation delivered with SAVI has reduced the time required to bring technicians up to speed on quality control processes, from eight to 12 months down to just three months, enhancing productivity and performance while delivering a more robust workforce.
So how does SAVI work in a real-world context? SAVI is deployed via a tablet and a web-based application incorporates an API to photograph the medical device trays, as shown below. Max Kelsen captures the photograph and sends it to a range of different services, via an API endpoint hosted on Google Cloud:
- Image information is stored in Cloud Storage
- Data relating to the trays is stored in Cloud SQL for PostgreSQL
- APIs and web UI components run in CloudRun
- Analytics data is stored within BigQuery
Once this tray and device onboarding stage is completed, the next step is to perform inferences from the images and data. By hosting online models with Kubeflow model serving on GKE, we enable a model to identify all the instruments in a tray at low latency.
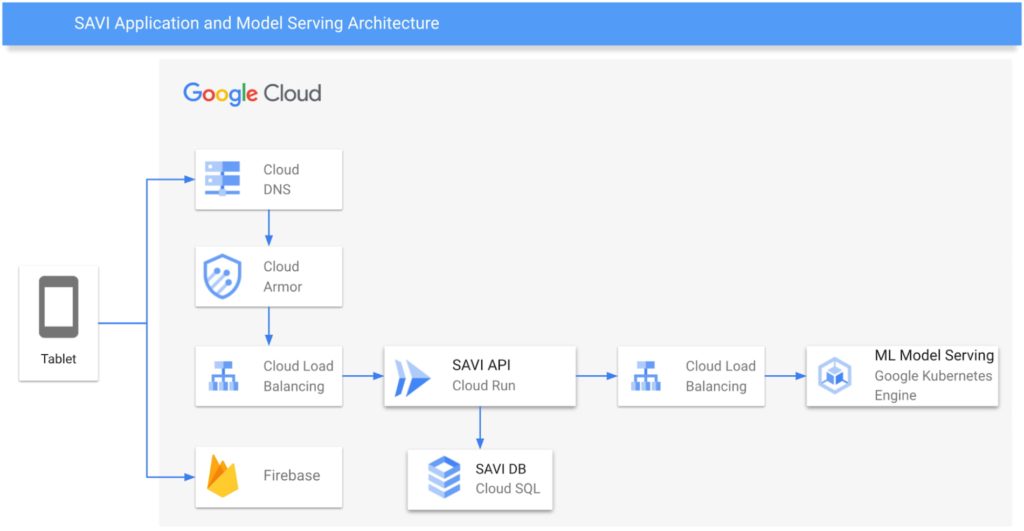
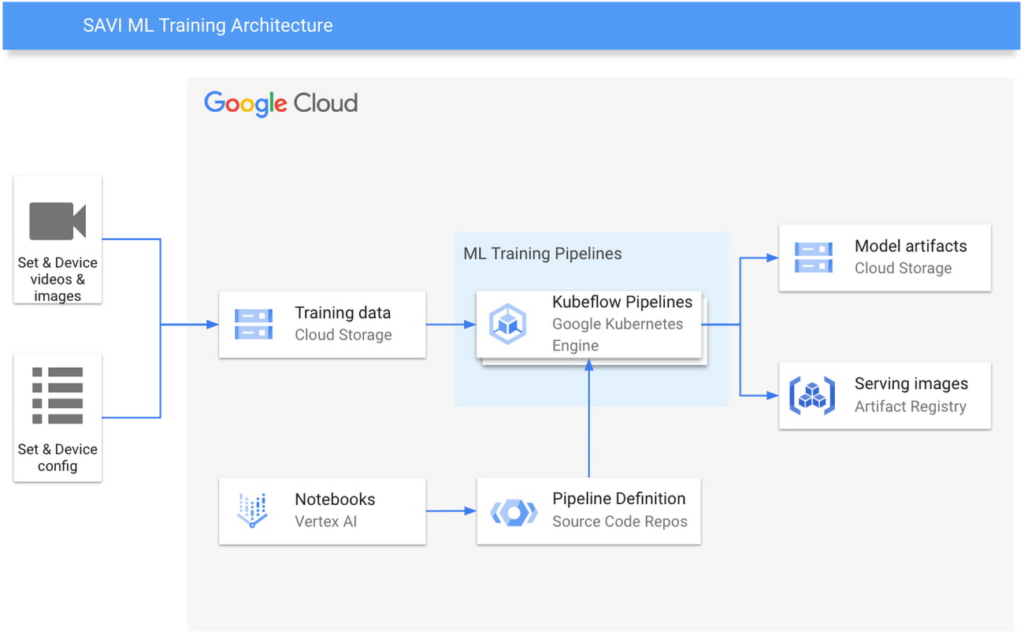
Vertex AI Workbench notebooks are used for data exploration and modeling. Kubeflow training pipelines hosted on GKE are executed to produce machine learning models for specific surgical instrument sets. Several hundred machine learning models are then hosted with Kubeflow model serving on GKE, with state and analytics managed using Firebase. Using machine learning to infer from images whether any devices are incorrectly placed, dirty, or otherwise not fit for purpose, the data is then returned to the tablet for the user to respond accordingly.
Based on our success to date with SAVI, it is now available on Google Cloud Marketplace to help healthcare organizations achieve machine learning-powered efficiencies across a range of use cases, and ultimately improve patient safety and outcomes.
Not to be confused with the usage of Visual Inspection Model (Assembly) available in Vertex AI Vision
Trend 2: Google Research on Machine Learning Themes for 2022 and Beyond!
2885
Of your peers have already read this article.
6:00 Minutes
The most insightful time you'll spend today!
Trend 2: Continued Efficiency Improvements for ML
Improvements in efficiency — arising from advances in computer hardware design as well as ML algorithms and meta-learning research — are driving greater capabilities in ML models. Many aspects of the ML pipeline, from the hardware on which a model is trained and executed to individual components of the ML architecture, can be optimized for efficiency while maintaining or improving on state-of-the-art performance overall. Each of these different threads can improve efficiency by a significant multiplicative factor, and taken together, can reduce computational costs, including CO2 equivalent emissions (CO2e), by orders of magnitude compared to just a few years ago. This greater efficiency has enabled a number of critical advances that will continue to dramatically improve the efficiency of machine learning, enabling larger, higher quality ML models to be developed cost effectively and further democratizing access. I’m very excited about these directions of research!
Continued Improvements in ML Accelerator Performance
Each generation of ML accelerator improves on previous generations, enabling faster performance per chip, and often increasing the scale of the overall systems. Last year, we announced our TPUv4 systems, the fourth generation of Google’s Tensor Processing Unit, which demonstrated a 2.7x improvement over comparable TPUv3 results in the MLPerf benchmarks. Each TPUv4 chip has ~2x the peak performance per chip versus the TPUv3 chip, and the scale of each TPUv4 pod is 4096 chips (4x that of TPUv3 pods), yielding a performance of approximately 1.1 exaflops per pod (versus ~100 petaflops per TPUv3 pod). Having pods with larger numbers of chips that are connected together with high speed networks improves efficiency for larger models.
ML capabilities on mobile devices are also increasing significantly. The Pixel 6 phone features a brand new Google Tensor processor that integrates a powerful ML accelerator to better support important on-device features.
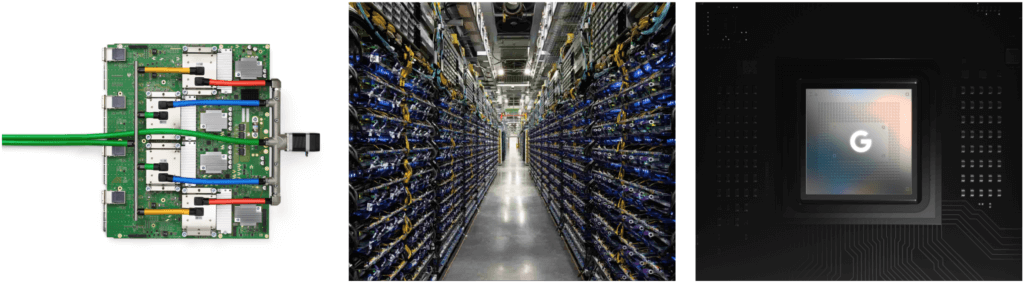
Our use of ML to accelerate the design of computer chips of all kinds (more on this below) is also paying dividends, particularly to produce better ML accelerators.
Continued Improvements in ML Compilation and Optimization of ML Workloads
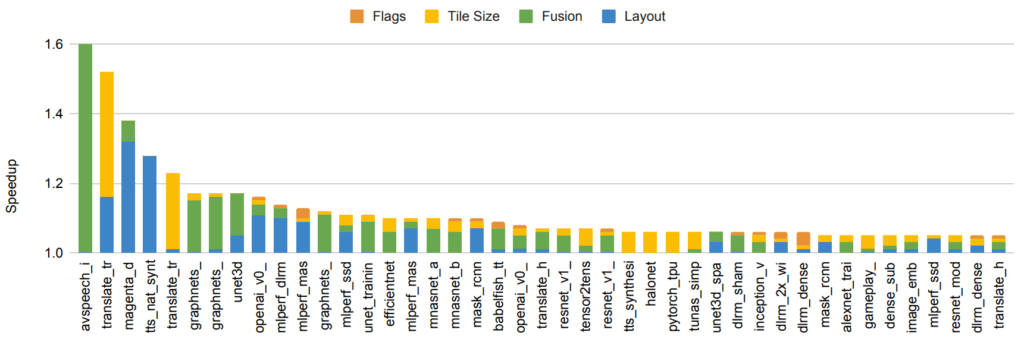
Even when the hardware is unchanged, improvements in compilers and other optimizations in system software for machine learning accelerators can lead to significant improvements in efficiency. For example, “A Flexible Approach to Autotuning Multi-pass Machine Learning Compilers” shows how to use machine learning to perform auto-tuning of compilation settings to get across-the-board performance improvements of 5-15% (and sometimes as much as 2.4x improvement) for a suite of ML programs on the same underlying hardware. GSPMD describes an automatic parallelization system based on the XLA compiler that is capable of scaling most deep learning network architectures beyond the memory capacity of an accelerator and has been applied to many large models, such as GShard-M4, LaMDA, BigSSL, ViT, MetNet-2, and GLaM, leading to state-of-the-art results across several domains.
Human-Creativity–Driven Discovery of More Efficient Model Architectures
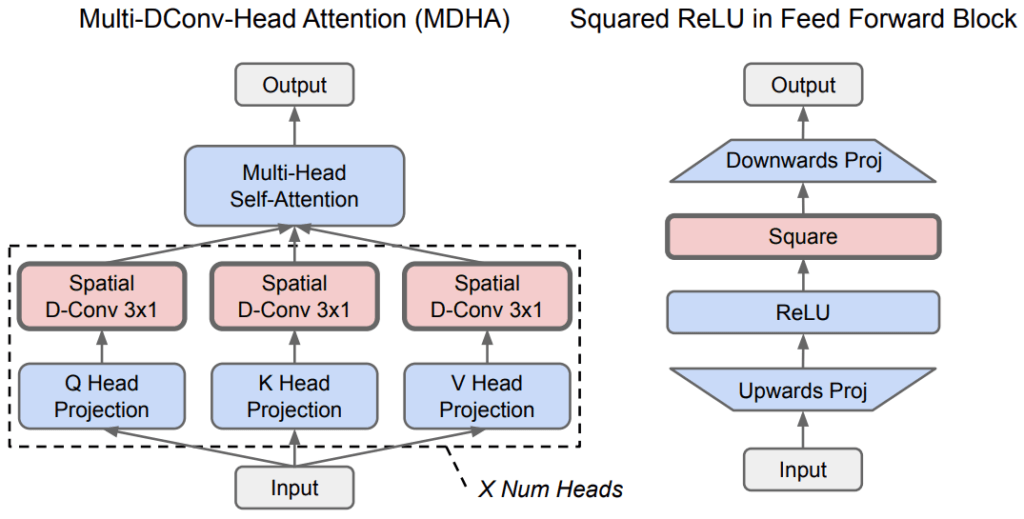
Continued improvements in model architectures give substantial reductions in the amount of computation needed to achieve a given level of accuracy for many problems. For example, the Transformer architecture, which we developed in 2017, was able to improve the state of the art on several NLP and translation benchmarks while simultaneously using 10x to 100x less computation to achieve these results than a variety of other prevalent methods, such as LSTMs and other recurrent architectures. Similarly, the Vision Transformer was able to show improved state-of-the-art results on a number of different image classification tasks despite using 4x to 10x less computation than convolutional neural networks.
Machine-Driven Discovery of More Efficient Model Architectures
Neural architecture search (NAS) can automatically discover new ML architectures that are more efficient for a given problem domain. A primary advantage of NAS is that it can greatly reduce the effort needed for algorithm development, because NAS requires only a one-time effort per search space and problem domain combination. In addition, while the initial effort to perform NAS can be computationally expensive, the resulting models can greatly reduce computation in downstream research and production settings, resulting in greatly reduced resource requirements overall. For example, the one-time search to discover the Evolved Transformer generated only 3.2 tons of CO2e (much less than the 284t CO2e reported elsewhere; see Appendix C and D in this joint Google/UC Berkeley preprint), but yielded a model for use by anyone in the NLP community that is 15-20% more efficient than the plain Transformer model. A more recent use of NAS discovered an even more efficient architecture called Primer (that has also been open-sourced), which reduces training costs by 4x compared to a plain Transformer model. In this way, the discovery costs of NAS searches are often recouped from the use of the more-efficient model architectures that are discovered, even if they are applied to only a handful of downstream uses (and many NAS results are reused thousands of times).
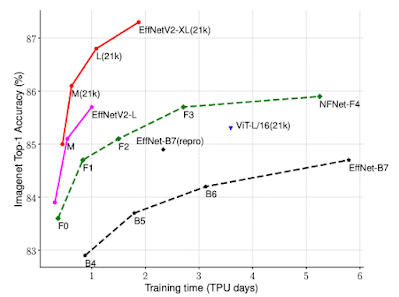
NAS has also been used to discover more efficient models in the vision domain. The EfficientNetV2 model architecture is the result of a neural architecture search that jointly optimizes for model accuracy, model size, and training speed. On the ImageNet benchmark, EfficientNetV2 improves training speed by 5–11x while substantially reducing model size over previous state-of-the-art models. The CoAtNet model architecture was created with an architecture search that uses ideas from the Vision Transformer and convolutional networks to create a hybrid model architecture that trains 4x faster than the Vision Transformer and achieves a new ImageNet state of the art.
The broad use of search to help improve ML model architectures and algorithms, including the use of reinforcement learning and evolutionary techniques, has inspired other researchers to apply this approach to different domains. To aid others in creating their own model searches, we have open-sourced Model Search, a platform that enables others to explore model search for their domains of interest. In addition to model architectures, automated search can also be used to find new, more efficient reinforcement learning algorithms, building on the earlier AutoML-Zero work that demonstrated this approach for automating supervised learning algorithm discovery.
Use of Sparsity
Sparsity, where a model has a very large capacity, but only some parts of the model are activated for a given task, example or token, is another important algorithmic advance that can greatly improve efficiency. In 2017, we introduced the sparsely-gated mixture-of-experts layer, which demonstrated better results on a variety of translation benchmarks while using 10x less computation than previous state-of-the-art dense LSTM models. More recently, Switch Transformers, which pair a mixture-of-experts–style architecture with the Transformer model architecture, demonstrated a 7x speedup in training time and efficiency over the dense T5-Base Transformer model. The GLaM model showed that transformers and mixture-of-expert–style layers can be combined to produce a model that exceeds the accuracy of the GPT-3 model on average across 29 benchmarks using 3x less energy for training and 2x less computation for inference. The notion of sparsity can also be applied to reduce the cost of the attention mechanism in the core Transformer architecture.
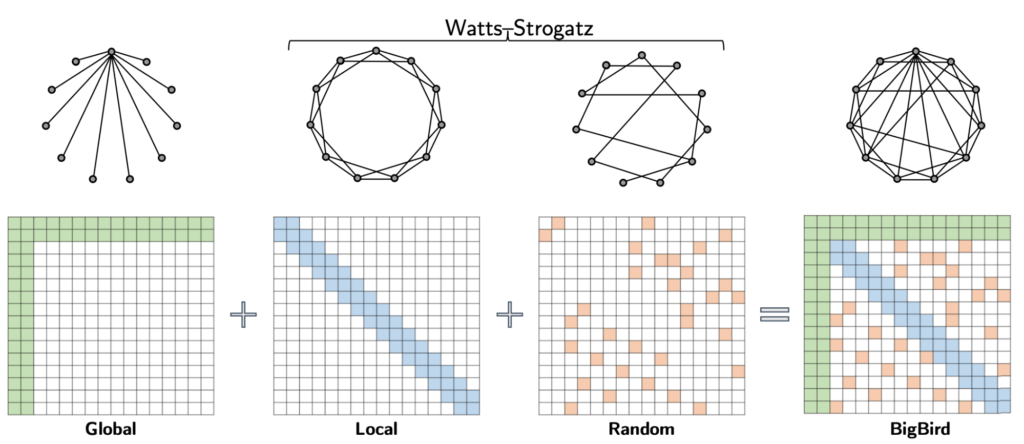
The use of sparsity in models is clearly an approach with very high potential payoff in terms of computational efficiency, and we are only scratching the surface in terms of research ideas to be tried in this direction.
Each of these approaches for improved efficiency can be combined together so that equivalent-accuracy language models trained today in efficient data centers are ~100 times more energy efficient and produce ~650 times less CO2e emissions, compared to a baseline Transformer model trained using P100 GPUs in an average U.S. datacenter using an average U.S. energy mix. And this doesn’t even account for Google’s carbon-neutral, 100% renewable energy offsets. We’ll have a more detailed blog post analyzing the carbon emissions trends of NLP models soon.
FAQs: Everything Your Need to Know About Cloud Computing

6617
Of your peers have already read this article.
1:30 Minutes
The most insightful time you'll spend today!
There are a number of terms and concepts in cloud computing, and not everyone is familiar with all of them. To help, we’ve put together a list of common questions, and the meanings of a few of those acronyms. You can find all these, and many more, in our learning resources.
What are containers?
Containers are packages of software that contain all of the necessary elements to run in any environment. In this way, containers virtualize the operating system and run anywhere, from a private data center to the public cloud or even on a developer’s personal laptop. Containerization allows development teams to move fast, deploy software efficiently, and operate at an unprecedented scale. Read more.
Containers vs. VMs: What’s the difference?
You might already be familiar with VMs: a guest operating system such as Linux or Windows runs on top of a host operating system with access to the underlying hardware. Containers are often compared to virtual machines (VMs). Like virtual machines, containers allow you to package your application together with libraries and other dependencies, providing isolated environments for running your software services. However, the similarities end here as containers offer a far more lightweight unit for developers and IT Ops teams to work with, carrying a myriad of benefits. Containers are much more lightweight than VMs, virtualize at the OS level while VMs virtualize at the hardware level, and share the OS kernel and use a fraction of the memory VMs require. Read more.
What is Kubernetes?
With the widespread adoption of containers among organizations, Kubernetes, the container-centric management software, has become the de facto standard to deploy and operate containerized applications. Google Cloud is the birthplace of Kubernetes—originally developed at Google and released as open source in 2014. Kubernetes builds on 15 years of running Google’s containerized workloads and the valuable contributions from the open source community. Inspired by Google’s internal cluster management system, Borg, Kubernetes makes everything associated with deploying and managing your application easier. Providing automated container orchestration, Kubernetes improves your reliability and reduces the time and resources attributed to daily operations. Read more.
What is microservices architecture?
Microservices architecture (often shortened to microservices) refers to an architectural style for developing applications. Microservices allow a large application to be separated into smaller independent parts, with each part having its own realm of responsibility. To serve a single user request, a microservices-based application can call on many internal microservices to compose its response. Containers are a well-suited microservices architecture example, since they let you focus on developing the services without worrying about the dependencies. Modern cloud-native applications are usually built as microservices using containers. Read more.
What is ETL?
ETL stands for extract, transform, and load and is a traditionally accepted way for organizations to combine data from multiple systems into a single database, data store, data warehouse, or data lake. ETL can be used to store legacy data, or—as is more typical today—aggregate data to analyze and drive business decisions. Organizations have been using ETL for decades. But what’s new is that both the sources of data, as well as the target databases, are now moving to the cloud. Additionally, we’re seeing the emergence of streaming ETL pipelines, which are now unified alongside batch pipelines—that is, pipelines handling continuous streams of data in real time versus data handled in aggregate batches. Some enterprises run continuous streaming processes with batch backfill or reprocessing pipelines woven into the mix. Read more.
What is a data lake?
A data lake is a centralized repository designed to store, process, and secure large amounts of structured, semistructured, and unstructured data. It can store data in its native format and process any variety of it, ignoring size limits. Read more.
What is a data warehouse?
Data-driven companies require robust solutions for managing and analyzing large quantities of data across their organizations. These systems must be scalable, reliable, and secure enough for regulated industries, as well as flexible enough to support a wide variety of data types and use cases. The requirements go way beyond the capabilities of any traditional database. That’s where the data warehouse comes in. A data warehouse is an enterprise system used for the analysis and reporting of structured and semi-structured data from multiple sources, such as point-of-sale transactions, marketing automation, customer relationship management, and more. A data warehouse is suited for ad hoc analysis as well custom reporting and can store both current and historical data in one place. It is designed to give a long-range view of data over time, making it a primary component of business intelligence. Read more.
What is streaming analytics?
Streaming analytics is the processing and analyzing of data records continuously rather than in batches. Generally, streaming analytics is useful for the types of data sources that send data in small sizes (often in kilobytes) in a continuous flow as the data is generated. Read more.
What is machine learning (ML)?
Today’s enterprises are bombarded with data. To drive better business decisions, they have to make sense of it. But the sheer volume coupled with complexity makes data difficult to analyze using traditional tools. Building, testing, iterating, and deploying analytical models for identifying patterns and insights in data eats up employees’ time. Then after being deployed, such models also have to be monitored and continually adjusted as the market situation or the data itself changes. Machine learning is the solution. Machine learning allows businesses to enable the data to teach the system how to solve the problem at hand with machine learning algorithms—and how to get better over time. Read more.
What is natural language processing (NLP)?
Natural language processing (NLP) uses machine learning to reveal the structure and meaning of text. With natural language processing applications, organizations can analyze text and extract information about people, places, and events to better understand social media sentiment and customer conversations. Read more.
Learn more
This is just a sampling of frequently asked questions about cloud computing. To learn more, visit our resources page at cloud.google.com/learn.
AI-powered Business Messages for Timely, Engaging and Helpful Conversations with Customers

9385
Of your peers have already read this article.
2:00 Minutes
The most insightful time you'll spend today!
Over the last two years, we’ve seen a significant uptick in the number of people using messaging to connect with businesses. Whether it was checking hours of operation, verifying what was in stock, or scheduling a pick-up, the pandemic caused a significant shift in consumer behavior.
- 45% of users are spending more time on messaging services because of the pandemic
- 85% of consumers would like to message brands directly
With the rise in demand for messaging, consumers expect communication with businesses to be speedy, simple, and convenient. For businesses, keeping up with customer inquiries can be a labor-intensive process, and offering 24/7 support outside of store hours can be costly.
To help businesses seamlessly deliver helpful, timely, and engaging conversations with customers when and where they need help, we introduced AI-powered Business Messages.
https://youtube.com/watch?v=fcgP3RHjBLY%3Fenablejsapi%3D1%26
What is AI-powered Business Messages?
With AI-powered Business Messages, you can connect with your customers in their moment of need, in the places they’re looking for answers—such as Google Search, Google Maps, or any brand-owned channel. For instance, check out how Walmart customers in the US are able to receive real-time information on product availability, straight from a search results page.

People turn to Google when they are searching for answers to their questions, looking to buy something, or trying to accomplish a particular task with one of our many tools. In fact, 68% of all online experiences begin with a search engine.
At Google, we know how important it is for interactions with a brand to be personalized, helpful, and simple. With AI-powered Business Messages, customers are able to chat with virtual agents that understand, interact, and respond in natural ways.
We are also combining smart automation with the ability for customers to chat with live agents when it’s really needed. This approach saves your customers precious time, while also saving you money. And with Business Messages automatically handling many customer inquiries in the background, businesses have the option to distribute their human customer service agents to address other needs.
Getting started with conversational AI is easy with Bot-in-a-Box
We know it can be difficult to get started with AI. That’s why we are utilizing existing Google AI tools like Dialogflow—part of Google Cloud Contact Center AI—to create the capability within Google’s Business Messages called Bot-in-a-Box, which makes getting started with Conversational AI easy. Bot-in-a-Box allows for fast and effective adoption of automation for businesses of all sizes.
Enabling Business Messages with Bot-in-a-Box can be as simple as leveraging an existing customer FAQ document you already have, whether it’s from a web page or an internal document. And since the conversational AI is powered by Business Messages and Dialogflow working together, your chat bot is able to understand and respond to customer questions automatically without the need to write code.
Bot-in-a-Box also supports other critical journeys like “Custom Intents.” That means that your bot is able to understand the different ways customers express a similar question and respond accurately by using machine learning capabilities.

Finding success
In April 2021, Wake County courthouses in North Carolina partnered with Tango Technology to implement Business Messages when it became apparent that being able to provide the public and attorneys with around-the-clock access to information would significantly reduce the pressure on courthouse staff. Using Bot-in-a-Box, Tango Technology was able to customize a solution for Wake County Courthouse, Justice Center, and Clerk of Superior Court in just four days.
“With the combination of Google’s Business Messages, GCP, and Dialogflow, we were able to spin up an AI-driven bot for the courts in days. And the technology stack allows us to continually improve by adding functionality in an agile process.”— Mike Lotz, Co-Founder, Tango Technology
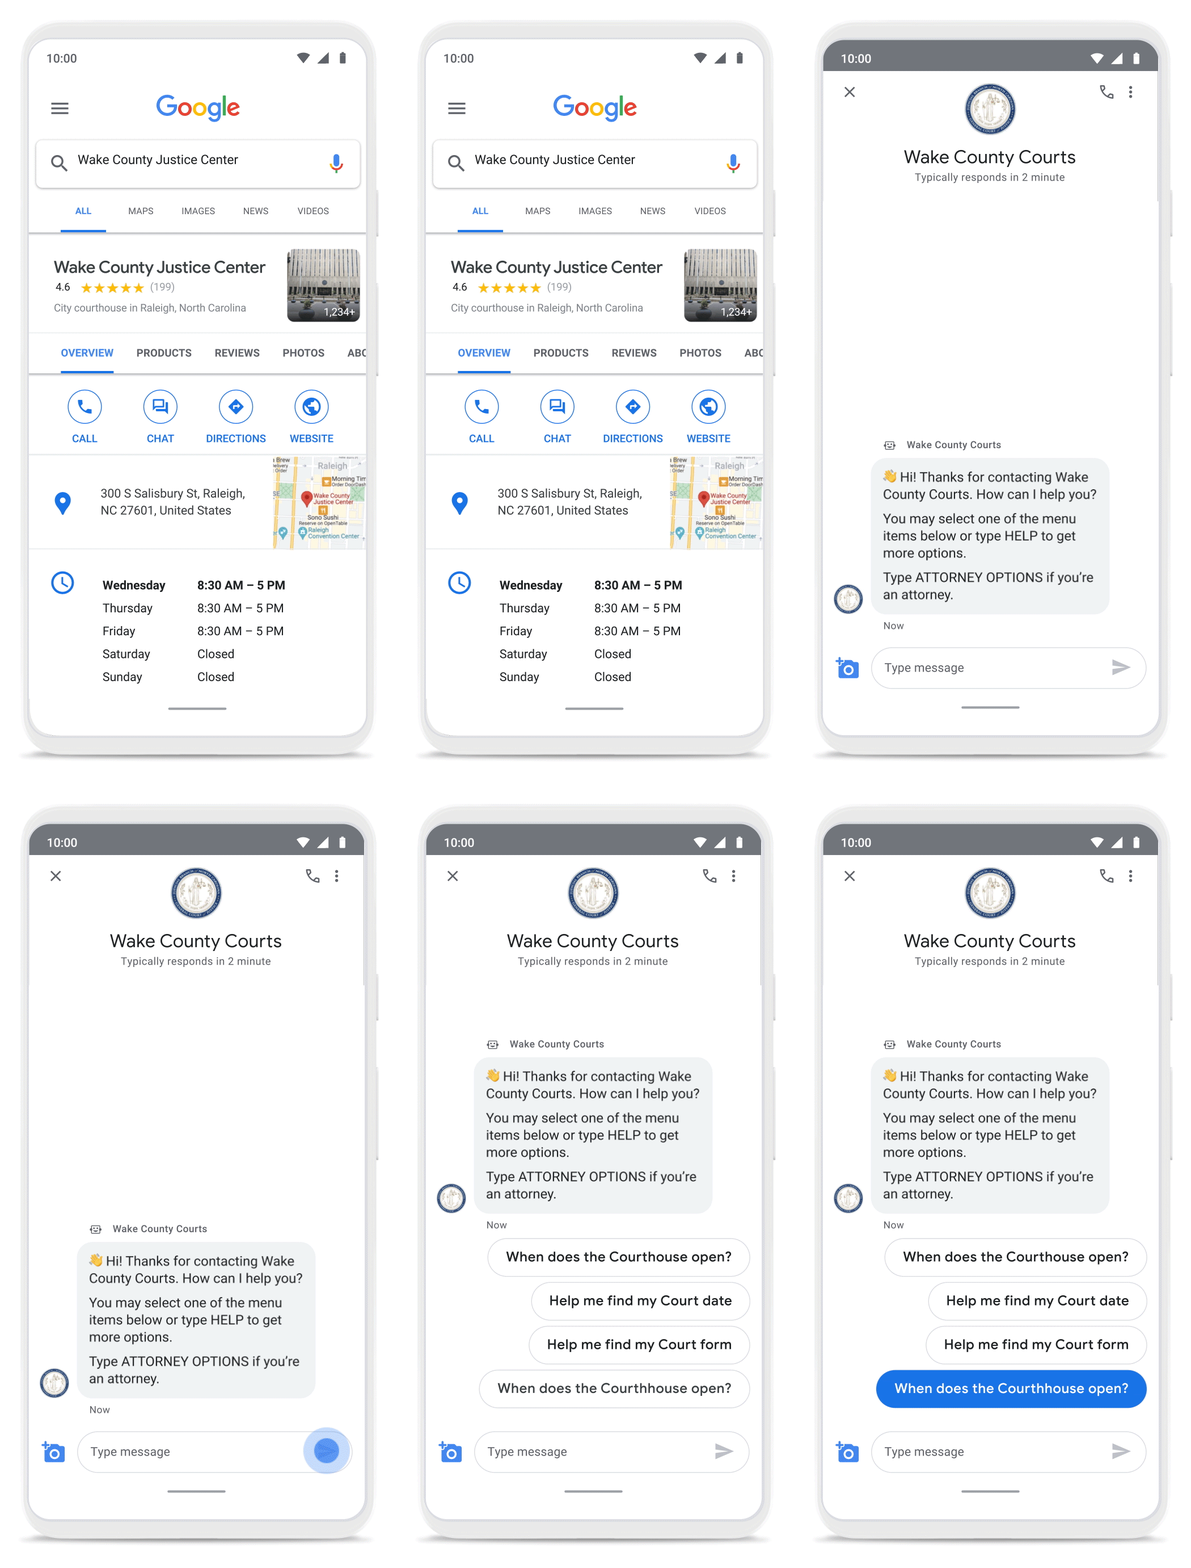
With Business Messages, North Carolina courthouses saw a 37% decrease in the call volume handled by courthouse staff. With 398,298 fewer phone calls during the first year of operation, the AI-based messages helped Wake County Courthouse work more efficiently and productively.
We’ve seen many brands benefiting from AI-powered Business Messages. For instance, Levi’s saw a 30% increase in off-hours shoppers and surpassed 85% customer satisfaction scores after implementing Business Messages. They also drove 30x more store-related questions than Levi’s website chat.
Bring Google’s conversational AI to your storefront with Business Messages
Google’s Business Messages makes it easier for businesses of all sizes to engage their existing or potential customers in a virtual conversation, when and where they need it.
To learn more, watch our Cloud Next session here or visit us at g.co/businessmessages. We have specialized services to help you get started and can share the wisdom of our channel partners and dedicated experts who specialize in unleashing the potential of conversational AI.
More Relevant Stories for Your Company

How AI Can Predict Consumer Demand and Retain Customers
How can AI help you target customers who are looking for products like yours? The challenge: This customer wants to buy the best cat food for her pets. Reach the Right Customers How can AI help you target customers who are looking for products like yours?The challenge: This customer wants

A Breakdown of Cloud-based Data Ingestion Practices
Businesses around the globe are realizing the benefits of replacing legacy data silos with cloud-based enterprise data warehouses, including easier collaboration across business units and access to insights within their data that were previously unseen. However, bringing data from numerous disparate data sources into a single data warehouse requires you

OCR Engine Upgrade: Document AI Introduces 3 New Capabilities
Documents are indispensable parts of our professional and personal lives. They give us crucial insights that help us become more efficient, that organize and optimize information, and that even help us to stay competitive. But as documents become increasingly complex, and as the variety of document types continues to expand,

Transform ‘Dark Data’ from Documents with Document AI, Cloud Functions and Workflows
At enterprises across industries, documents are at the center of core business processes. Documents store a treasure trove of valuable information whether it's a company's invoices, HR documents, tax forms and much more. However, the unstructured nature of documents make them difficult to work with as a data source. We
