





What Swiggy and You Can Learn From This Company’s Use of ML to Engage Customers

9635
Of your peers have already read this article.
1:45 Minutes
The most insightful time you'll spend today!
The app economy has enabled a huge range of unique business models to flourish. One such model is online food ordering and delivery services, in which apps leverage geo-location data to aggregate local food choices and offer personalized options to consumers.
A leading company in this space is Just Eat. Launched in the UK in 2001 with a vision of ‘serving the world’s greatest menu. Brilliantly.’ The company has capitalized on the popularity of online food delivery and grown its presence across 12 markets.
Just Eat acts as an intermediary between take-out food outlets and hungry customers, giving local restaurants access to a broader base of potential diners, while providing consumers with an easy and secure way to order and pay for food from their favourite restaurants.
Today the company helps 27 million customers find food from more than 112,000 restaurants—everything from homemade Italian pasta, to Chinese noodle bowls, to fish-and-chips.
Data is the fuel of Just Eat’s rapid growth, but it wasn’t always looked at that way. In its early days, Just Eat struggled with the deluge of information and faced fragmentation across its systems. In fact, the company realized its legacy data vendor wasn’t capable of ingesting 90 percent of the data produced by its food platform. This was incredibly frustrating for Just Eat’s analysts and data scientists, who had to waste time cleaning up sources instead of leveraging the data to create a better user experience.
Just Eat turned to Google Cloud, and now uses machine learning (ML) to power sophisticated consumer recommendations on both its app and website. It also makes heavy use of features offered by Google Cloud Platform, including BigQuery for running analytics on its customer data set and Cloud Pub/Sub for messaging app users with relevant offers in real-time.
Having all of Just Eat’s data in one platform has translated into real value for its customers. With Google Cloud tools, Just Eat has created its own proprietary Customer Ontology framework, which today contains 5.5 billion features that better understand consumers’ behavior and food habits, and provides insights into previous visits.
Just Eat recently created an “Adventurous Index” to map its customers according to their ordering habits, enabling them to tailor their marketing and user experiences. For example, mid-adventurous customers are shown a choice of restaurants that serve their most ordered cuisine, while adventurous customers can choose from restaurants that serve a wider variety. This not only has prompted consumers to be more adventurous with their choices, but also has led to more business at a more diverse set of restaurants.
Matt Cresswell, Director of Customer Platforms at Just Eat said that Google Cloud has become integral to its product delivery: “Consumer food choice is a hugely nuanced topic. We know that individuals have their own unique journeys when they use Just Eat. We’ve sought to create a truly one-to-one relationship with every customer. The changes we’ve made to the platform mean they can access the dishes they enjoy at the touch of a fingertip, and find inspiration to discover new dishes they’ll love. We’re grateful to Google Cloud for helping us support our customers on their culinary explorations.”
Bit Capital Rolls Out a Digital Financial Solution in Under 3 Months and at 2/3 the Cost

5673
Of your peers have already read this article.
4:00 Minutes
The most insightful time you'll spend today!
In the past few years, a series of new technologies and regulatory changes has been transforming Brazil’s financial industry. The concept of blockchain added security and agility to financial transactions. The open banking system being deployed by the country’s Central Bank (BC) allows for platform integration and data sharing -with the user’s consent- between financial institutions. Recently, the launch of Pix, also by the BC, has shaken the market by creating a new payment method that is instant, free for individuals and 24/7.
Since 2018, the startup Bit Capital has been working on the development of 100%-digital financial solutions in the cloud to help its clients adapt to this new scenario in a convenient way, without the need to build an infrastructure for that or hiring different providers. Pix was not the exception.
In less than 3 months, the team was able to build and go live with a solution that can be used by both direct participants (i.e. those with banking licenses granted by BC) and indirect participants (i.e. companies depending on direct participants to offer payments on Pix) through Bit Capital’s platform.
Besides this differential, Pix and the startup’s other solutions are based on blockchain and Google Cloud’s cloud, ensuring greater security, scalability and availability for customers and allowing for an easy integration between Bit Capital’s platform’s solutions and those from other companies.
“Now we have a platform with an API and various microsservices, allowing clients to connect and develop their own financial product without having to start from scratch.”
—Francesco Miolo, CFO, Bit Capital
A robust structure to handle Pix’s high demand
Bit Capital was established with a certain urgency to develop its platform. The idea was well-developed and customers were interested. The fast deployment of Google Cloud’s tools was one of the main factors that attracted the company to use it as a basis for its infrastructure.
“We managed to deliver everything we have today in Google Cloud with a small team. That was another challenge: being able to grow with a few people,” says Juliano Souza, the startup’s head of IT infrastructure. “We sought other cloud partners, but they had a steep curve. We chose Google Cloud because we needed quick, quality scaling.”
The same thing happened when they built the solution for Pix, despite the specific challenges involved. The BC had performance requirements that led the company to spend some time experimenting until they reached the best suite of tools to meet those requirements. The startup wanted to create a unique architecture that could help both large and small customers and be integrated to the platform’s other microservices.
With the support from Google Cloud’s team to answer doubts and make the best decisions, the solution was built in a few months, at a cost about two-thirds lower than other providers.
The solution’s architecture is based on apps running in Docker in Google Kubernetes Engine (GKE), with interconnected microservices. The blockchain system runs on Compute Engine, its rows are managed in Pub/Sub and Dataflow, and persistent data, in Cloud SQL. Cloud Interconnect is used for the connection with BC. Cloud KMS and Secrets Management store the company’s pre-credentials. All of this is supported by Cloud Load Balancing for load balancing and autoscaling.
According to the team, GKE was essential for the solution’s success. Using infrastructure as code in the tool made uploading of a group of microservices significantly easier. Developers are able to help set up this environment, which has helped spread the DevOps culture in the team. Besides orchestrating and integrating apps, GKE also provides an elastic structure to handle demand peaks and visibility to monitor internal components.
“Google Kubernetes Engine was the only way to ensure availability, observability and elasticity for all clients, whether small, middle-sized or large.”
—Juliano Souza, Head of IT Infrastructure, Bit Capital
Nowadays, the solution’s environment has 20 clusters with over 1,500 pods – 250GB in data per month, providing a robust structure to support a service involving periods of intense demand such as Black Friday.
Ease to monitor, fix and improve
Just 10 days after Pix’s official launch date, the company had its first test: Black Friday. This allowed a major e-commerce customer to test the scale and see the success of the architecture that had been built. “It worked great regarding what the cloud could deliver. And we found what we needed to fix very quickly. Operations [formerly Stackdriver], in particular Cloud Trace, showed us clearly what needed to be done to improve performance,” Souza explains.
Using Operations added reliability by putting deliveries into production. Checking Cloud Trace to see if there were any performance issues and the exact point where they were happening became routine for Bit Capital’s developers. Google Cloud’s security tools and Google Safety Center provided the resources needed to monitor and secure the environment, with automatic data encryption at rest and in transit.
“Google Cloud has security as a premise. When we upload any kind of component, like a database or a virtual machine, the drive is encrypted by default. With other providers, you must specify that you want it encrypted.
”—Juliano Souza, Head of IT Infrastructure, Bit Capital
The easy service monitoring and management accelerates product and technology development because the team no longer needs to worry about infrastructure. Automated management allows professionals to spend more time on new projects and the company’s business. Also, the deployment of services in a Google Cloud multi-region impacts on customer experience, providing high availability for their solutions.
In the coming months, Bit Capital aims to ramp up service usage and the creation of new projects in Google Cloud by adding more customers to Pix’s solution and Banking as a Service (BaaS) solutions. Anthos will be incorporated to the tool suite to make it easier to connect apps with the customers’ on-prem environments. And the deployment of open banking has the potential to be a business driver for the company.
“We joke that we’re already doing open banking, because we have various connections with different providers, which allows us to offer an integrated solution,” says Francesco Miolo, the startup’s CFO. “With the arrival of the new regulations, something we are waiting for since we started out, we will be able, through our platform, to take our customers to the open finance ecosystem, enabling the development of disruptive business models.”
Data to Business Outcomes with Google’s Data Analytics Design Pattern

6727
Of your peers have already read this article.
1:30 Minutes
The most insightful time you'll spend today!
Companies today are inundated with vast amounts of data from various sources. This overwhelming amount of data is meant to benefit the company, but often leaves data teams feeling overwhelmed, which can create data bottlenecks and result in a slow time to value. In fact, only twenty seven percent of companies agree that data and analytics projects produce insights and recommendations that are highly actionable (Accenture). This means that nearly 3 in 4 companies are not unlocking value in their data, which poses a huge challenge for organizations trying to move the needle and drive real business results. We at Google Cloud, however, saw opportunity in this challenge, which is why we created Data Analytics Design Patterns: cross-product technical solutions designed to accelerate a customer’s path to value realization with their data. These industry solutions bring together product capabilities alongside design methodology, open source deployable code, data models, and reference architectures to accelerate your business outcomes.

With Data Analytics Design Patterns, you get access to more than 30 ready-to-deploy data analytics solutions. Design patterns leverage the best of Google and our rich partner ecosystem, including Technology Partners & System Integrators. In this blog, we will cover 3 examples on how a design pattern can be applied to unlock the value of data:
- Improve mobile app experience with Unified App Analytics
- Maximize digital shop’s revenue with Price Optimization
- Protect internal systems from security and malware threat with Anomaly Detection
Unified App Analytics
If mobile apps are part of your go-to-market strategy, you have several data sources that can provide invaluable customer insights. In addition to tools such as CRM (e.g. Salesforce) and customer care (e.g. Zendesk), you likely use Google Analytics to log app events and Firebase Crashlytics to gather data about app errors. But can you easily combine back-end server data with app front-end data to unlock customer insights?
The Unified App Analytics design pattern makes it easy to plug all the disparate data sources into a single warehouse (BigQuery) and start analyzing it with a Business Intelligence tool (Looker). Once you have a complete and real time view of your customer experience with your app, you can take action. For example, if you notice an increase in app errors, you can quickly combine your Crashlytics data with your CRM data to narrow down the crashes with the highest revenue impact and prioritize their resolution. Further, you can automate your issue resolution workflow by creating a rule for any future crash that impacts a subset of VIP customers.

With the Unified App Analytics design pattern, you’ll gain access to valuable insights about your user experience with your app so you can inform your future app strategy. For example, NPR, an American media company, increased user engagement by showing content that better mapped to listener interests and behaviors.
Price Optimization
In a competitive and hectic global marketplace, strategic pricing matters more than ever, but often projects are consumed by the tedium of standardizing, cleaning, and preparing data—from transactions, inventory, demand, among other sources.
Price Optimization solution allows retailers to build a data driven pricing model. The solution consists of three main components:
- Dataprep by Trifacta: integrates different data sources into a single Common Data Model (CDM). Dataprep is an intelligent data service for visually exploring, cleaning, and preparing structured and unstructured data for analysis, reporting, and machine learning.
- BigQuery: allows you to create and store pricing models in a consistent and scalable way as a serverless Cloud Data Warehouse service
- Looker dashboards: surface insights and enable business teams to take action with enterprise ready BI platform
With the Price Optimization design pattern from Google Cloud and our partner Trifacta, you’ll be able to rapidly unify multiple data sources and create a real-time and ML-powered analysis, leveraging predictive models to estimate future sales. For example, PDPAOLA, an online jewelry company, doubled sales with dynamic pricing adjustments enabled by a single data view.

Anomaly Detection
Organizations need to anticipate and act on risks and opportunities to stay competitive in a digitally transforming society. Anomaly detection helps organizations identify and respond to data points and data trends in high velocity, high volume data sets that deviate from historical standards and expected behaviors, allowing them to take action on changing user needs, mitigate malicious actors and behaviors, and prevent unnecessary costs and monetary losses.
The Anomaly Detection design pattern uses Google Pub/Sub, BigQuery, Dataflow, and Looker to:
- Stream events in real time
- Process the events, extract useful data points, train the detection algorithm of choice
- Apply the detection algorithm in near-real time to the events to detect anomalies
- Update dashboards and/or send alerts
The challenge of finding the important insights and anomalies in vast amounts of data applies to organizations across all industries and lines of business, but is especially important to protecting the security of an organization. For example, TELUS, a national communications company, modernized their security analytics platform leveraging this pattern, allowing them to detect anomalies in near real time to detect and mitigate suspicious activity.
Get started
Turn your data into business outcomes with Google Cloud and our broad partner ecosystem by deploying Data Analytics Design Patterns at your organization. There are more than 30 Data Analytics Design Patterns ready for you to use. We have more than 200+ more ideas in the pipeline, so be sure to check in regularly as new patterns will be added soon.
To dive deeper and find out more about how Data Analytics Design Patterns can help your organization accelerate use cases and create faster time to value, check out this video.
Google is a Leader in the 2019 Gartner Magic Quadrant for Data Management Solutions for Analytics

5975
Of your peers have already read this article.
2:10 Minutes
The most insightful time you'll spend today!
As organizations continue to produce vast quantities of data, they increasingly need platforms that allow them to analyze, store, and extract meaningful insights from that data. And research from analyst firms like Gartner offer an important way for organizations to evaluate and compare cloud data warehouse providers.
Earlier this year, Gartner named Google a Leader in the 2019 Gartner Magic Quadrant for Data Management Solutions for Analytics (DMSA) (report available here). This evaluation covers Google Cloud’s core data analytics offerings, including BigQuery, a serverless, managed data warehouse, Cloud Dataproc, a managed Spark and Hadoop service, and Cloud Dataflow, which enables you to stream and batch-process your data. Here are a few takeaways:
Simplicity and speed
BigQuery’s performance permits complex queries on large-scale data sets to return in seconds, and a substantial number of BigQuery customers maintain data warehouses that store more than 50 terabytes (and a few customers now use more than 100 petabytes). More than half of these customers are loading data either continuously or many times per day. These customers value the ability to extract, transform, load, and analyze their data on a serverless platform, all without maintaining any underlying infrastructure.
A versatile serverless data warehouse
One of BigQuery’s major advantages is its ability to allow customers to address a wide variety of use cases—from a traditional data warehouse to data science. Over the past year, we’ve worked hard to introduce new features in BigQuery like data types for financial and monetary uses, BigQuery GIS for geospatial data, and machine learning capabilities through BigQuery ML. BigQuery’s continuous ingest capabilities make it suitable for an operational—or a real-time—serverless data warehouse.
An expanding ecosystem
With overall increased market adoption, our analytics offerings continue to benefit from a fast-growing partner ecosystem of service providers, and business intelligence (BI) and data integration vendors. In particular, in 2018 we expanded our partnerships with established industry providers, including Confluent, Dell Boomi, Informatica, Looker, Reltio, Tableau, and ThoughtSpot.
More and more organizations are finding value in Google Cloud’s serverless data warehouse and analytics offerings. If you’d like to learn more, you can download a complimentary copy of the Gartner Magic Quadrant for Data Management Solutions for Analytics on the Google site (requires an email address).
Gartner does not endorse any vendor, product or service depicted in its research publications, and does not advise technology users to select only those vendors with the highest ratings or other designation. Gartner research publications consist of the opinions of Gartner’s research organization and should not be construed as statements of fact. Gartner disclaims all warranties, expressed or implied, with respect to this research, including any warranties of merchantability or fitness for a particular purpose.
3013
Of your peers have already watched this video.
21:30 Minutes
The most insightful time you'll spend today!
Can Users Just Ask Questions of Data in BigQuery and Get Answers?
At the root of every data insight lies a question. For a non-technical user, getting answers to an ad-hoc question, not found in existing dashboards or reports, has been the burden of BI teams for ages.
Data QnA, a new service that empowers business users to simply ask questions of their data in BigQuery, using natural language, and get an answer immediately can help.
In this video, Abhishek Kashyap, Product Manager, Google Cloud introduces Data QnA and demonstrates how it can be used.
Then Fabrice Nico, Data and Robotic manager, Veolia, a global leader in water, waste, and energy resource management solutions, will share the companies journey and explain how they’re using Data QnA to democratize access to analytics.
3423
Of your peers have already watched this video.
19:30 Minutes
The most insightful time you'll spend today!
Data vs. COVID-19: How public data is helping flatten the curve
The outbreak of COVID-19 has changed the reality of millions of lives around the world. Communities around the world began social distancing, events were cancelled, and healthcare efforts redirected to fight the pandemic.
Hear how public data and the Google Cloud COVID-19 Public Datasets Program is helping combat the pandemic and informing individual decision-making to help everyone make informed decisions about the spread and risks of the virus, and how cooperative efforts could help flatten the curve.
In this presentation, Javier de la Torre, Founder and Chief Strategy Officer of Carto, and Shane Glass, Developer Advocate, Google Cloud demonstrate how the Carto platform is contributing to spatial analysis and understanding for how the outbreak evolved over time as government policies and social distancing measures were put into place.
They also show how to access these public datasets, what is included in the COVID-19 Public Datasets Program, and how you can use these datasets to develop maps and dashboards that will help us continue to combat the pandemic.
More Relevant Stories for Your Company
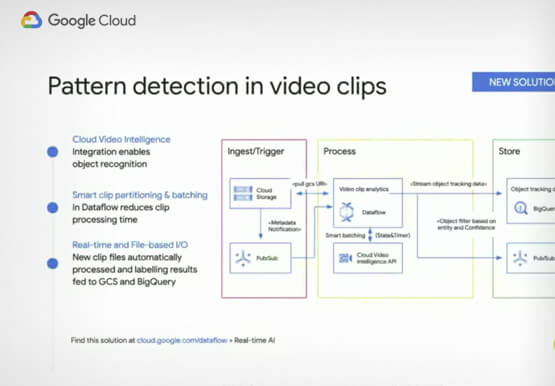
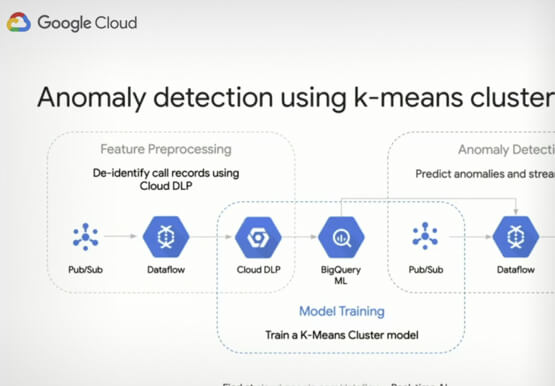
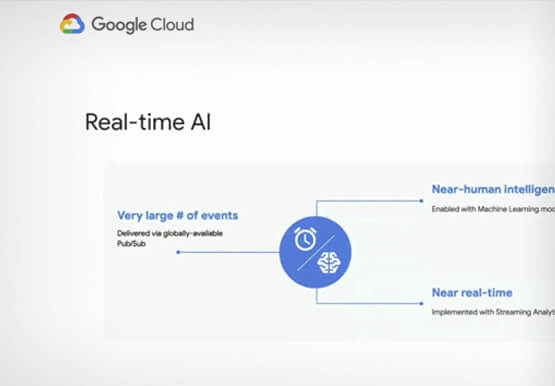

Deploying Real-time AI: A Walkthrough
Enterprises are increasingly looking to leverage streaming data (customer interactions, sales transactions, machine logs) for building new innovative features, increasing sales, and protecting against risks. AI/ML (artificial intelligence/machine learning) technologies make it possible to amp up the detection of insights in large volumes of data: insights that otherwise would be

Getting Started with BigQuery: 10 Quick Steps
BigQuery is Google's fully managed, petabyte scale, low cost analytics data warehouse. BigQuery is NoOps—there is no infrastructure to manage and you don't need a database administrator—so you can focus on analyzing data to find meaningful insights, use familiar SQL, and take advantage of our pay-as-you-go model. That's great, right? So

Google Cloud Celebrates Journey of 3 Inspiring Founders for the Asian Pacific American Heritage Month
May is Asian Pacific American Heritage Month —a time for us to come together to celebrate and remember the important people and history of Asian and Pacific Island heritage. This feature highlights three AAPI founders from the Google For Startups community. Read on to learn how these three founders built

How Google Cloud Solutions Help Retail Firms to ABP(Always Be Pivoting)
For years, retailers have been told that they must embrace a litany of new technologies, trends, and imperatives like online shopping, mobile apps, omnichannel, and digital transformation. In search of growth and stability, retailers adopted many of these, only to realize that for every box they ticked, there was another
