





Google Cloud Celebrates Journey of 3 Inspiring Founders for the Asian Pacific American Heritage Month

8138
Of your peers have already read this article.
1:30 Minutes
The most insightful time you'll spend today!
May is Asian Pacific American Heritage Month —a time for us to come together to celebrate and remember the important people and history of Asian and Pacific Island heritage. This feature highlights three AAPI founders from the Google For Startups community.
Read on to learn how these three founders built their businesses, leverage Google tech, and suggestion they have for aspiring entrepreneurs.
CultivatePeople
Founder: Lola Han
Description: CultivatePeople’s compensation software, Kamsa, provides global market pay rate data and helps companies make data-driven salary decisions so they can attract and retain their most valuable asset: employees.
Why GCP: “CultivatePeople began using GCP when integrating SSO/SAML authentication after our SaaS product became a high priority. We were able to exceed our clients’ expectations and increase their level of trust in our platform’s capabilities. We’re currently investigating additional machine learning products, such as Cloud AutoML, that will allow us to quickly deliver exciting features.”
Note from the Founder: “I grew up with immigrant parents who value stability and are risk-averse. My parents discouraged me from starting my own company because they didn’t want to see me struggle financially or see my health suffer (due to stress). I felt strongly about what CultivatePeople could do, so I started the company as a sole founder in 2017 and watched it double in size year over year since. While the ones I love most may not have cheered me on initially, it was important for me to hang on to the encouraging words of former bosses, executives, and founders to keep me focused on my mission.
My advice for other AAPI founders is to be a “silent assassin” and believe in the mission and values of your organization. Always remember to stop along the way and:
1) Enjoy the journey by celebrating wins and giving yourself credit;
2) Follow your intuition—it’s (almost) always right;
3) Recognize and invest in your people regularly (ie. give increases more than once a year, if warranted);
4) Give regular words of affirmation to employees on even small achievements.”

Swit
Founder: Josh Lee and Max Lim
Description: Swit is a team collaboration platform that seamlessly combines team chat with task management by allowing teams to turn their conversations into trackable tasks and share tasks to chat with simple drag-and-drop functionality, ensuring everyone is on the same page and projects get done faster.
Why GCP: “Swit is a cross-category hybrid work tool for chat and tasks. This functionality requires more complicated and heavier architecture for performance. So, configuring and managing virtual machines was really challenging to scale up our systems, while handling occasional unexpected traffic surges and frequent updates. Eventually we divided our monolithic architecture into 35 microservices when we launched our official product. The migration to GKE took around one month, and it turned out to be well worth the effort—our systems became able to offer high scalability and enough resilience to keep its uptime no matter what happened. Now we’re operating 84 workloads and 252 microservices with high stability with remarkably low downtime – less than 0.00001%/year.”
Note from the Founder: “As an AAPI founder based in Silicon Valley, I feel proud of the work ethics and diligence fellow Korean American entrepreneurs and professionals have long demonstrated here. Especially with K-pop breaking into the mainstream, I feel even more proud of our culture that strives toward an absolute perfection molded through years of training and dedication. The mission-driven culture of Silicon Valley coupled with Google’s edging technology and creativity really helped us build a product that not only encompasses verticals but also transcends cultures. Swit is growing at an unprecedented rate, and we hope to join the long list of successful AAPI entrepreneurs here. Swit’s close network with the AAPI community wouldn’t have been possible without Google support. We are grateful for this collaborative environment, and we hope to become the next-generation ambassador for collaboration after Google.”
Check out more from Swit in their founder story.

WISY
Founder: Min Chen
Description: Wisy develops technology to bring digital efficiency into the physical world, supporting consumer products businesses and making them thrive in the new economy. All of us have a bad experience when we can’t find the product we want to buy. That is a $1.9T problem in the consumer-packaged goods industry that Wisy is solving with AI and analytics to help manufacturers and retailers sell more by reducing out-of-stocks and waste at a global scale.
Why GCP: “GCP has an intuitive, easy to use interface, was lower cost, and offered preemptible instances with flexible compute options. Some of the reasons why Wisy decided to use GCP include instance and payment configurability, privacy and traffic security, cost-efficiency, and Machine Learning.
Wisy has been able to advance quickly with product development, as well as collaborate better and iterate faster in the creation of our AI models, while reducing costs by 40%. At Wisy, we are solving a problem that affects everyone who shops at a store.“
Note from the Founder: “Two years ago, I moved to San Francisco to expand my second startup, Wisy. This is when I learned that my name ‘Min’ stands for ‘minority.’ I was born in China, raised in a Black community in Panama, received scholarships to attend both Carnegie Mellon and UC Berkeley. I worked for 20 years in several countries, but I have never felt so discriminated against due to my race, ethnicity, gender and age than during my time in Silicon Valley. However, this is also the place I learned that my diverse life experience is my competitive advantage. My background enables me to recruit and relate to people in different countries, create scalable and flexible products for multinational customers, and run global operations efficiently.
My recommendation to AAPI founders is to find strength in their multicultural background. Don’t hide what makes you unique, do not limit yourselves, and do not let others limit you. You will lose your edge when trading authenticity for validation. Be proud and own your story.”
If you want to learn more about how Google Cloud can help your startup, visit our Startup Program application page here and sign up for our monthly startup newsletter to get a peek at our community activities, digital events, special offers, and more.To learn more about how you can help #StopAsianHate during Asian Pacific American Heritage Month and beyond, visit their website here.
4576
Of your peers have already watched this video.
1:30 Minutes
The most insightful time you'll spend today!
Introduction to Cloud Shell Editor
Watch the video to understand how Google’s Cloud Shell Editor and its powerful features-packed environment can streamline your development workflows.
4411
Of your peers have already watched this video.
31:30 Minutes
The most insightful time you'll spend today!
Smart analytics: Deep dive on roadmap
Data across organizations is growing and that organizations need a very strong analytics platform to leverage this data create insights and make real-time decisions on top of this data.
That’s driving the advent of three large trends. First is the convergence of data lakes and data warehouses, that’s enable organizations to maximize the value of their data.
Second, is the growing phenomena of real-time decision-making which is forcing enterprises to think of how they can support the needs of batch processing and streaming data.
Finally, there is the rise of artificial intelligence and machine learning, which allows enterprises to leverage their data and create competitive differentiation.
With this background, Sudhir Hasbe, Director of Product Management, Data Analytics, Google Cloud, walks us through Google Cloud’s smart analytics offerings—and what’s new.
He takes us on a tour through the technical value of Google Cloud’s smart analytics platform end-to-end. He provides a comprehensive overview and demos what’s new and what’s next in Google Cloud’s smart analytics portfolio across products like BigQuery, Dataflow, Dataproc, Data Fusion, PubSub, Data Catalog, Dataprep, and Looker.
Serverless and BigQuery Together on Google Cloud: Behind the L’Oreal Beauty Tech Data Platform

5349
Of your peers have already read this article.
4:00 Minutes
The most insightful time you'll spend today!
Editor’s note: In Today’s guest post we hear from beauty leader L’Oréal about their approach to building a modern data platform on fully managed services: managing the ingest of diverse datasets into BigQuery with Cloud Run, and orchestrating transformations into relevant business domain representations for stakeholders across the organization. Learn more about how businesses have benefited from Cloud Run in Forrester’s report on Total Economic Impact.
L’Oréal was born out of science. For over 100 years, we have always shaped the future of beauty, and taken its eternal quest to new horizons. This has earned us our current position as the world’s uncontested beauty leader (~€ 32 B annual sales in 2021), present in 150 countries with over 85,000 employees.
Today, with the power of our game-changing science, multiplied by cutting-edge technologies, we continue our lifelong journey of shaping the future of beauty.
As a Beauty Tech company, we leverage our decades-long heritage of rich data assets to empower our decision-making with instant, sophisticated analysis.
Because we oversee global brands, which must adapt to local requirements, we need to maintain a deep understanding of what a brands’ data represents, while managing disparate legal and regulatory requirements for different countries. Our end goal is to run a safe, compliant and sustainable data warehouse as efficiently and effectively as possible.
We sync and aggregate internal and external data from a wide variety of sources across organizations and retail stores. This made the management of our data warehouse infrastructure used to be very complex and hard to manage before Google Cloud. L’Oréal’s footprint was so large that we once found it impossible to have a standardized method to handle data. Every process was vendor-specific, and the infrastructure was brittle. We went looking for a solution to our complex data infrastructure needs, and defined the following non-negotiable principles:
- No Ops: The job of a developer at L’Oréal is not to manage servers. We need an elastic infrastructure that scales on demand, so that our developers can focus on delivering customized and inclusive beauty experiences to all consumers, rather than focusing on managing servers.
- Secure: We have strict security and compliance requirements which vary by country, and we employ a zero-trust security strategy. We must keep both our own internal data and customer data safe and encrypted.
- Sustainable : Our data lives in multiple environments, including on-prem data centers and public cloud services. We must be able to securely access and analyze this data while minimizing the complexity and environmental impact of moving and duplicating data.
- End-to-end supervision: Because developers shouldn’t be managing servers, we need a “single pane of glass” dashboard to monitor and triage the system if something goes wrong.
- Easy-to-deploy: Deploying code safely should not compromise velocity. We are constantly developing innovations that push the boundaries of science and reinvent beauty rituals. We need integrated tools to make our code deployment process seamless and safe.
- Event-driven architecture: Our data is used globally by research, product, business and engineering teams with high expectations on data quality and timeliness. Many of our internal processes and analysis are based on near real-time data.
- Data products delivered “as a service”: We want to empower our employees to drive business value at record speed. To that end, we need solutions that enable us to remove the developers from the critical path of solution delivery as much as possible.
- Extract-load-transform (ELT): Our goal is to implement the pattern to load data as soon as possible into the data warehouse to take advantage of SQL transformations.
After considering multiple vendors on the market, with these principles in mind, we landed on end-to-end Google Cloud serverless and data tooling. We were already using Google Cloud for a few processes, including BigQuery, and loved the experience.
We’ve now expanded our use of Google Cloud to fully support the L’Oréal Beauty Tech Data Platform.
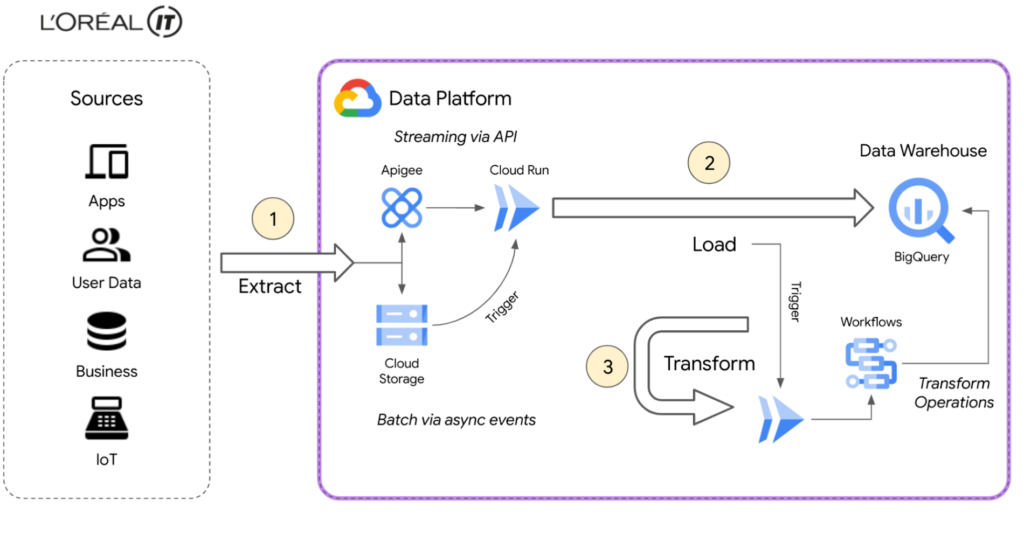
L’Oréal’s Beauty Tech Data Platform incorporates data from two types of sources: directly via API, which is data that adapts easily to our schema and is inserted directly into BigQuery, and bulk data from integrations, which require event-driven transformations using Eventarc mechanisms. These transformations are performed in Cloud Run and Cloud Functions (2nd gen), or directly in SQL. With Google Cloud, we can adapt very quickly.
Today, we currently have 8500 flows for ~5000 users using the native zero-trust capabilities offered by Google Cloud. Indeed, the flows come from Google Cloud and other third-party services.
BigQuery enabled us to adopt standard SQL as our universal language in our data warehouse and meet all expectations for queries and reporting. We were also able to load original data using features like federated queries, and efficiently transitioned from ETL to ELT data ingestion by handling semi-structured data with SQL. This approach of loading original data from sources into BigQuery with non-destructive transformations allows us to reprocess data for new use-cases easily, directly within BigQuery.
Our applications are hosted on multiple environments – on-premises, in Google Cloud, and in other public clouds. This made it difficult for our data engineers and analysts to natively analyze data across clouds until we started using BigQuery Omni. This capability of BigQuery allowed us to globally access and analyze data across clouds through a single pane of glass using the native BigQuery user interface itself. Without BigQuery Omni, it would’ve been impossible for our teams to natively do cross-cloud analytics. Moreover, it eliminated the need for us to move sensitive data, which is not only expensive because of local tax and subsea transport, but also incredibly risky – sometimes even forbidden – because of local regulations.
Today Google Cloud powers our Beauty Tech Data Platform, which stores 100TB of production data in BigQuery and processes 20TB of data each month. We have more than 8000 governed datasets, and 2 millions of BigQuery tables coming from multiple data sources such as Salesforce, SAP, Microsoft, and Google Ads.
For more complex transformations where custom and specific libraries are required, Cloud Workflows help us to manage the complexity very efficiently by orchestrating steps in containers through Cloud Run, Cloud Functions and even BigQuery jobs — the most used way to transform and add value to the L’Oréal data.
Additionally, by using BigQuery and Google Cloud’s serverless compute for API ingestion, bulk data loading, and post-loading transformations, we can keep the entire system in a single boundary of trust at a fraction of the cost. With ingest, queries, and transformations all being fully elastic and on-demand, we no longer have to perform capacity planning for either the compute or analytics components of the system. And of course these services’ pay-as-you-go model perfectly aligns with L’Oréal’s strategy of only paying for something when you use it.
Google Cloud fulfilled the requirements of our Beauty Tech Data Platform. And as if offering us a no-ops, secure, easy-to-deploy, custom-development free, event-based platform with end-to-end supervision wasn’t enough, Google Cloud also helped us with our sustainability efforts.
Being able to measure and understand the environmental footprint of our public cloud usage is also a key part of our sustainable tech roadmap. With Google Cloud Carbon Footprint, we can easily see the impact of our sustainable infrastructure approach and architecture principles. Our Beauty Tech platform is a strategic ambition for L’Oréal: inventing the beauty products of the future while becoming the company of the future.
Sustainable tech is an imperative and a very important step towards this ambition of creating responsible beauty for our consumers, and sustainable-by-design tech services for our employees. We all have a role to play, and by joining forces, we can have a positive impact.
Google Cloud’s data ecosystem and serverless tools are highly complementary, and made it possible to build a next-generation data analytics platform that met all our needs.
Get started using serverless and BigQuery together on Google Cloud today.
10155
Of your peers have already watched this video.
1:00 Minutes
The most insightful time you'll spend today!
Predict User Churn on Gaming Apps with Google Analytics Data using BigQuery ML
User retention can be a major challenge for mobile game developers. According to the Mobile Gaming Industry Analysis in 2019, most mobile games only see a 25% retention rate for users after the first day. To retain a larger percentage of users after their first use of an app, developers can take steps to motivate and incentivize certain users to return. But to do so, developers need to identify the propensity of any specific user returning after the first 24 hours.
In this blog post, we will discuss how you can use BigQuery ML to run propensity models on Google Analytics 4 data from your gaming app to determine the likelihood of specific users returning to your app.
You can also use the same end-to-end solution approach in other types of apps using Google Analytics for Firebase as well as apps and websites using Google Analytics 4. To try out the steps in this blogpost or to implement the solution for your own data, you can use this Jupyter Notebook.
Using this blog post and the accompanying Jupyter Notebook, you’ll learn how to:
- Explore the BigQuery export dataset for Google Analytics 4
- Prepare the training data using demographic and behavioural attributes
- Train propensity models using BigQuery ML
- Evaluate BigQuery ML models
- Make predictions using the BigQuery ML models
- Implement model insights in practical implementations
Google Analytics 4 (GA4) properties unify app and website measurement on a single platform and are now default in Google Analytics. Any business that wants to measure their website, app, or both, can use GA4 for a more complete view of how customers engage with their business. With the launch of Google Analytics 4, BigQuery export of Google Analytics data is now available to all users. If you are already using a Google Analytics 4 property, you can follow this guide to set up exporting your GA data to BigQuery.
Once you have set up the BigQuery export, you can explore the data in BigQuery. Google Analytics 4 uses an event-based measurement model. Each row in the data is an event with additional parameters and properties. The Schema for BigQuery Export can help you to understand the structure of the data.
In this blogpost, we use the public sample export data from an actual mobile game app called “Flood It!” (Android, iOS) to build a churn prediction model. But you can use data from your own app or website.
Here’s what the data looks like. Each row in the dataset is a unique event, which can contain nested fields for event parameters.
SELECT *FROM `firebase-public-project.analytics_153293282.events_*`TABLESAMPLE SYSTEM (1 PERCENT)

This dataset contains 5.7M events from over 15k users.
SELECTCOUNT(DISTINCT user_pseudo_id) as count_distinct_users,COUNT(event_timestamp) as count_eventsFROM`firebase-public-project.analytics_153293282.events_*

Our goal is to use BigQuery ML on the sample app dataset to predict propensity to user churn or not churn based on users’ demographics and activities within the first 24 hours of app installation.

In the following sections, we’ll cover how to:
- Pre-process the raw event data from GA4
- Identify users & the label feature
- Process demographic features
- Process behavioral features
- Train classification model using BigQuery ML
- Evaluate the model using BigQueryML
- Make predictions using BigQuery ML
- Utilize predictions for activation
Pre-process the raw event data
You cannot simply use raw event data to train a machine learning model as it would not be in the right shape and format to use as training data. So in this section, we’ll go through how to pre-process the raw data into an appropriate format to use as training data for classification models.
This is what the training data should look like for our use case at the end of this section:

Notice that in this training data, each row represents a unique user with a distinct user ID (user_pseudo_id).
Identify users & the label feature
We first filtered the dataset to remove users who were unlikely to return the app anyway. We defined these ‘bounced’ users as ones who spent less than 10 mins with the app. Then we labeled all remaining users:
- churned: No event data for the user after 24 hours of first engaging with the app.
- returned: The user has at least one event record after 24 hours of first engaging with the app.
For your use case, you can have a different definition of bounce and churning. Also you can even try to predict something else other than churning, e.g.:
- whether a user is likely to spend money on in-game currency
- likelihood of completing n-number of game levels
- likelihood of spending n amount of time in-game etc.
In such cases, label each record accordingly so that whatever you are trying to predict can be identified from the label column.
From our dataset, we found that ~41% users (5,557) bounced. However, from the remaining users (8,031), ~23% (1,883) churned after 24 hours:
SELECTbounced,churned,COUNT(churned) as count_usersFROMbqmlga4.returningusersGROUP BY 1,2ORDER BY bounced

To create these bounced and churned columns, we used the following snippet of SQL code.
...#churned = 1 if last_touch within 24 hr of app installation, else 0IF (user_last_engagement < TIMESTAMP_ADD(user_first_engagement,INTERVAL 24 HOUR),1,0 ) AS churned,#bounced = 1 if last_touch within 10 min, else 0IF (user_last_engagement <= TIMESTAMP_ADD(user_first_engagement,INTERVAL 10 MINUTE),1,0 ) AS bounced,...
You can view the Jupyter Notebook for the full query used for materializing the bounced and churned labels.
Process demographic features
Next, we added features both for demographic data and for behavioral data spanning across multiple columns. Having a combination of both demographic data and behavioral data helps to create a more predictive model.
We used the following fields for each user as demographic features:
geo.countrydevice.operating_systemdevice.language
A user might have multiple unique values in these fields — for example if a user uses the app from two different devices. To simplify, we used the values from the very first user engagement event.
CREATE OR REPLACE VIEW bqmlga4.user_demographics AS (WITH first_values AS (SELECTuser_pseudo_id,geo.country as country,device.operating_system as operating_system,device.language as language,ROW_NUMBER() OVER (PARTITION BY user_pseudo_id ORDER BY event_timestamp DESC) AS row_numFROM `firebase-public-project.analytics_153293282.events_*`WHERE event_name="user_engagement")SELECT * EXCEPT (row_num)FROM first_valuesWHERE row_num = 1 #first engagement);
Process behavioral features
There is additional demographic information present in the GA4 export dataset, e.g. app_info, device, event_params, geo etc. You may also send demographic information to Google Analytics through each hit via user_properties. Furthermore, if you have first-party data on your own system, you can join that with the GA4 export data based on user_ids.
To extract user behavior from the data, we looked into the user’s activities within the first 24 hours of first user engagement. In addition to the events automatically collected by Google Analytics, there are also the recommended events for games that can be explored to analyze user behavior. For our use case, to predict user churn, we counted the number of times the follow events were collected for a user within 24 hours of first user engagement:
user_engagementlevel_start_quickplaylevel_end_quickplaylevel_complete_quickplaylevel_reset_quickplaypost_scorespend_virtual_currencyad_rewardchallenge_a_friendcompleted_5_levelsuse_extra_steps
The following query shows how these features were calculated:
WITHevents_first24hr AS (SELECTe.*FROM`firebase-public-project.analytics_153293282.events_*` eJOINbqmlga4.returningusers rONe.user_pseudo_id = r.user_pseudo_idWHERETIMESTAMP_MICROS(e.event_timestamp) <= r.ts_24hr_after_first_engagement)SELECTuser_pseudo_id,SUM(IF(event_name = 'user_engagement', 1, 0)) AS cnt_user_engagement,# ... repeated for all behavior data ...SUM(IF(event_name = 'use_extra_steps', 1, 0)) AS cnt_use_extra_steps,FROMevents_first24hrGROUP BY1
View the notebook for the query used to aggregate and extract the behavioral data. You can use different sets of events for your use case. To view the complete list of events, use the following query:
SELECTevent_name,COUNT(event_name) as event_countFROM`firebase-public-project.analytics_153293282.events_*`GROUP BY 1ORDER BYevent_count DESC
After this we combined the features to ensure our training dataset reflects the intended structure. We had the following columns in our table:
- User ID:
user_pseudo_id
- Label:
churned
- Demographic features
countrydevice_osdevice_language
- Behavioral features
cnt_user_engagementcnt_level_start_quickplaycnt_level_end_quickplaycnt_level_complete_quickplaycnt_level_reset_quickplaycnt_post_scorecnt_spend_virtual_currencycnt_ad_rewardcnt_challenge_a_friendcnt_completed_5_levelscnt_use_extra_stepsuser_first_engagement
At this point, the dataset was ready to train the classification machine learning model in BigQuery ML. Once trained, the model will output a propensity score between churn (churned=1) or return (churned=0) indicating the probability of a user churning based on the training data.
Train classification model
When using the CREATE MODEL statement, BigQuery ML automatically splits the data between training and test. Thus the model can be evaluated immediately after training (see the documentation for more information).
For the ML model, we can choose among the following classification algorithms where each type has its own pros and cons:

Often logistic regression is used as a starting point because it is the fastest to train. The query below shows how we trained the logistic regression classification models in BigQuery ML.
CREATE OR REPLACE MODEL bqmlga4.churn_logregTRANSFORM(EXTRACT(MONTH from user_first_engagement) as month,EXTRACT(DAYOFYEAR from user_first_engagement) as julianday,EXTRACT(DAYOFWEEK from user_first_engagement) as dayofweek,EXTRACT(HOUR from user_first_engagement) as hour,* EXCEPT(user_first_engagement, user_pseudo_id))OPTIONS(MODEL_TYPE="LOGISTIC_REG",INPUT_LABEL_COLS=["churned"]) ASSELECT*FROMbqmlga4.train
We extracted month, julianday, and dayofweek from datetimes/timestamps as one simple example of additional feature preprocessing before training. Using TRANSFORM() in your CREATE MODEL query allows the model to remember the extracted values. Thus, when making predictions using the model later on, these values won’t have to be extracted again. View the notebook for the example queries to train other types of models (XGBoost, deep neural network, AutoML Tables).
Evaluate model
Once the model finished training, we ran ML.EVALUATE to generate precision, recall, accuracy and f1_score for the model:
SELECT*FROMML.EVALUATE(MODEL bqmlga4.churn_logreg)

The optional THRESHOLD parameter can be used to modify the default classification threshold of 0.5. For more information on these metrics, you can read through the definitions on precision and recall, accuracy, f1-score, log_loss and roc_auc. Comparing the resulting evaluation metrics can help to decide among multiple models.Furthermore, we used a confusion matrix to inspect how well the model predicted the labels, compared to the actual labels. The confusion matrix is created using the default threshold of 0.5, which you may want to adjust to optimize for recall, precision, or a balance (more information here).
SELECTexpected_label,_0 AS predicted_0,_1 AS predicted_1FROMML.CONFUSION_MATRIX(MODEL bqmlga4.churn_logreg)

This table can be interpreted in the following way:

Make predictions using BigQuery ML
Once the ideal model was available, we ran ML.PREDICT to make predictions. For propensity modeling, the most important output is the probability of a behavior occurring. The following query returns the probability that the user will return after 24 hrs. The higher the probability and closer it is to 1, the more likely the user is predicted to return, and the closer it is to 0, the more likely the user is predicted to churn.
SELECTuser_pseudo_id,returned,predicted_returned,predicted_returned_probs[OFFSET(0)].prob as probability_returnedFROMML.PREDICT(MODEL bqmlga4.churn_logreg,(SELECT * FROM bqmlga4.train)) #can be replaced with a proper test dataset
Utilize predictions for activation
Once the model predictions are available for your users, you can activate this insight in different ways. In our analysis, we used user_pseudo_id as the user identifier. However, ideally, your app should send back the user_id from your app to Google Analytics. In addition to using first-party data for model predictions, this will also let you join back the predictions from the model into your own data.
- You can import the model predictions back into Google Analytics as a user attribute. This can be done using the Data Import feature for Google Analytics 4. Based on the prediction values you can Create and edit audiences and also do Audience targeting. For example, an audience can be users with prediction probability between 0.4 and 0.7, to represent users who are predicted to be “on the fence” between churning and returning.
- For Firebase Apps, you can use the Import segments feature. You can tailor user experience by targeting your identified users through Firebase services such as Remote Config, Cloud Messaging, and In-App Messaging. This will involve importing the segment data from BigQuery into Firebase. After that you can send notifications to the users, configure the app for them, or follow the user journeys across devices.
- Run targeted marketing campaigns via CRMs like Salesforce, e.g. send out reminder emails.
You can find all of the code used in this blogpost in the Github repository:
What’s next?
Continuous model evaluation and re-training
As you collect more data from your users, you may want to regularly evaluate your model on fresh data and re-train the model if you notice that the model quality is decaying.
Continuous evaluation—the process of ensuring a production machine learning model is still performing well on new data—is an essential part in any ML workflow. Performing continuous evaluation can help you catch model drift, a phenomenon that occurs when the data used to train your model no longer reflects the current environment.
To learn more about how to do continuous model evaluation and re-train models, you can read the blogpost: Continuous model evaluation with BigQuery ML, Stored Procedures, and Cloud Scheduler
More resources
If you’d like to learn more about any of the topics covered in this post, check out these resources:
- BigQuery export of Google Analytics data
- BigQuery ML quickstart
- Events automatically collected by Google Analytics 4
- Qwiklabs: Create ML models with BigQuery ML
Or learn more about how you can use BigQuery ML to easily build other machine learning solutions:
- How to build demand forecasting models with BigQuery ML
- How to build a recommendation system on e-commerce data using BigQuery ML
Let us know what you thought of this post, and if you have topics you’d like to see covered in the future! You can find us on Twitter at @polonglin and @_mkazi_.Thanks to reviewers: Abhishek Kashyap, Breen Baker, David Sabater Dinter.
Vector Search: The Tech Powering Billions of Search Results for Google Users

4545
Of your peers have already read this article.
1:30 Minutes
The most insightful time you'll spend today!
Recently, Google Cloud partner Groovenauts, Inc. published a live demo of MatchIt Fast. As the demo shows, you can find images and text similar to a selected sample from a collection of millions in a matter of milliseconds:

Give it a try — and either select a preset image or upload one of your own. Once you make your choice, you will get the top 25 similar images from two million images on Wikimedia images in an instant, as you can see in the video above. No caching involved.
The demo also lets you perform the similarity search with news articles. Just copy and paste some paragraphs from any news article, and get similar articles from 2.7 million articles on the GDELT project within a second.

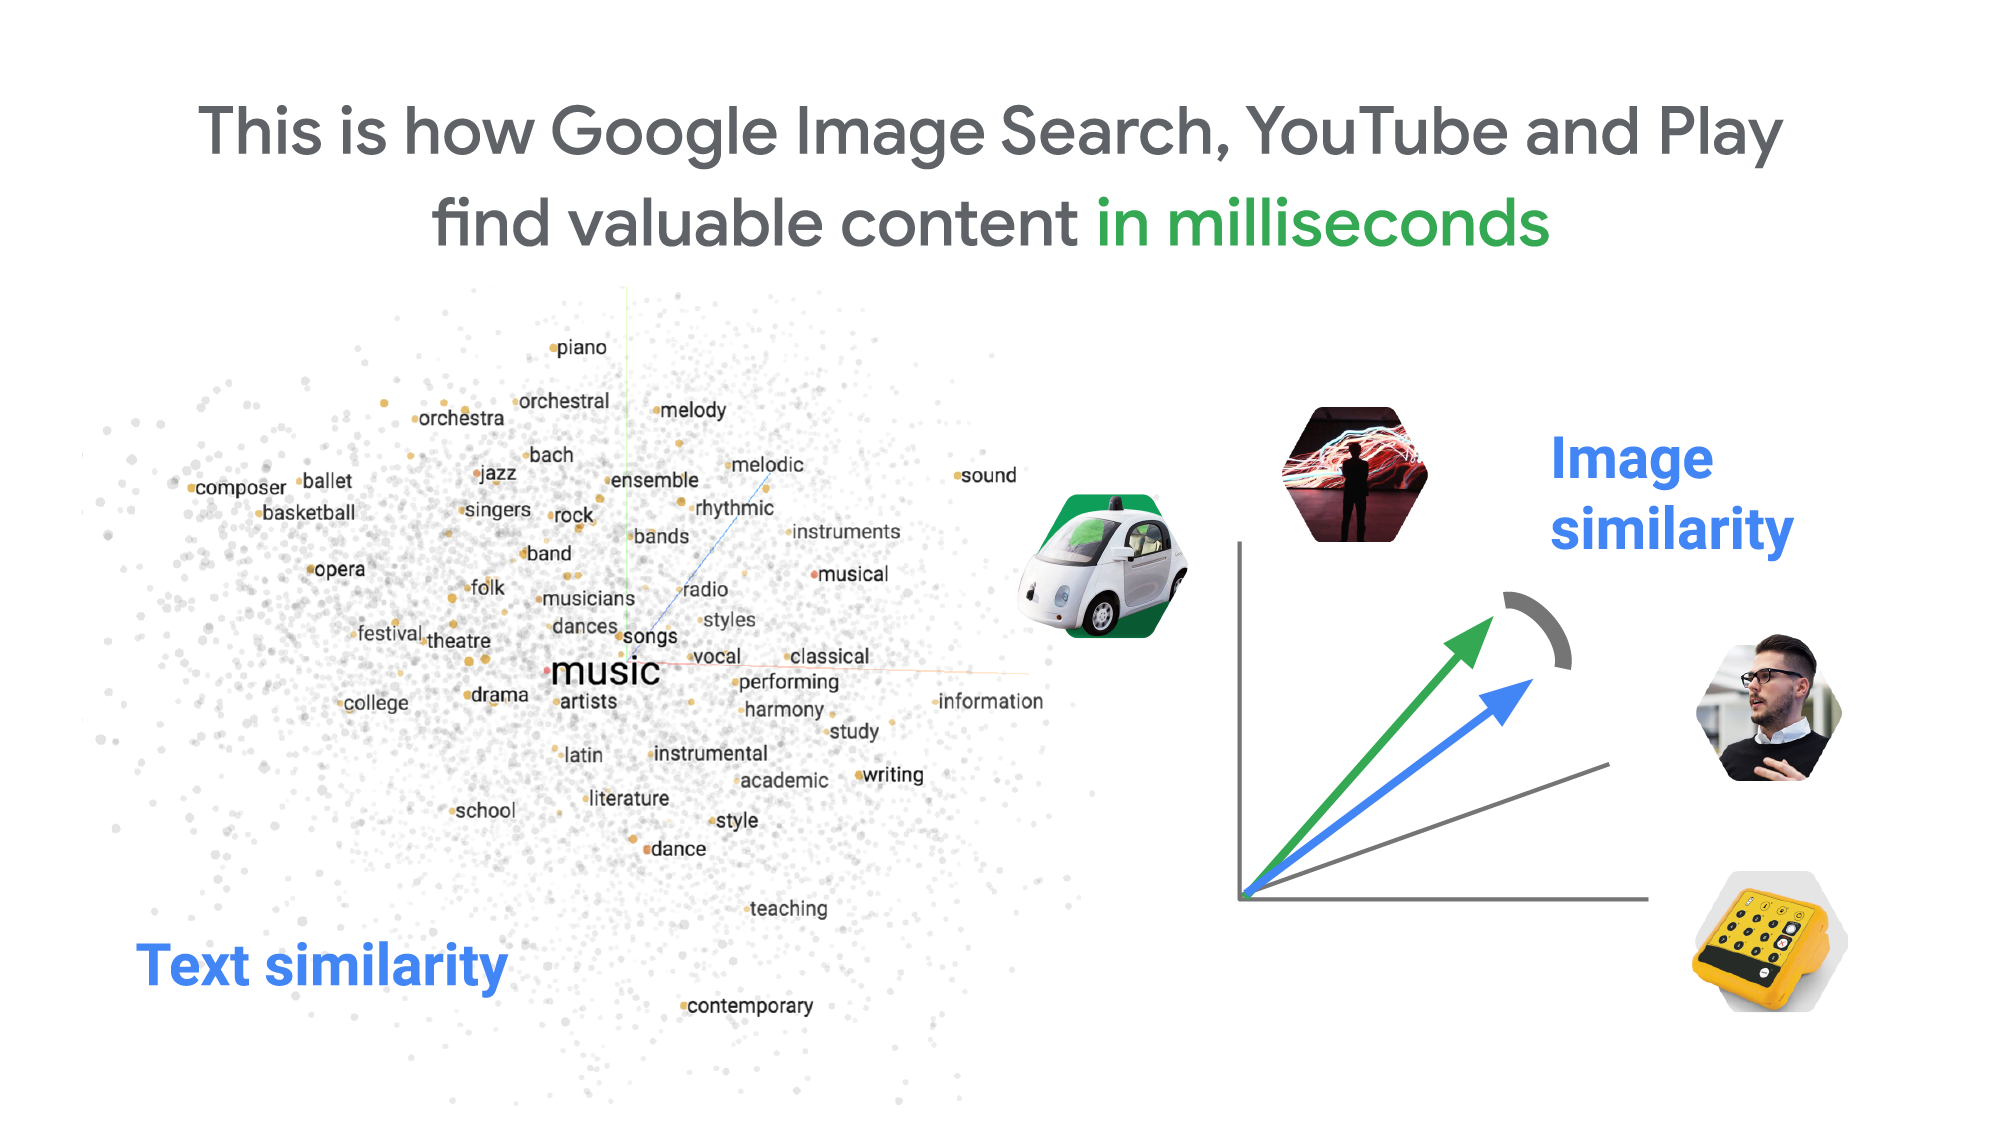
Vector Search: the technology behind Google Search, YouTube, Play, and more
How can it find matches that fast? The trick is that the MatchIt Fast demo uses the vector similarity search (or nearest neighbor search or simply vector search) capabilities of the Vertex AI Matching Engine, which shares the same backend as Google Image Search, YouTube, Google Play, and more, for billions of recommendations and information retrievals for Google users worldwide. The technology is one of the most important components of Google’s core services, and not just for Google: it is becoming a vital component of many popular web services that rely on content search and information retrieval accelerated by the power of deep neural networks.
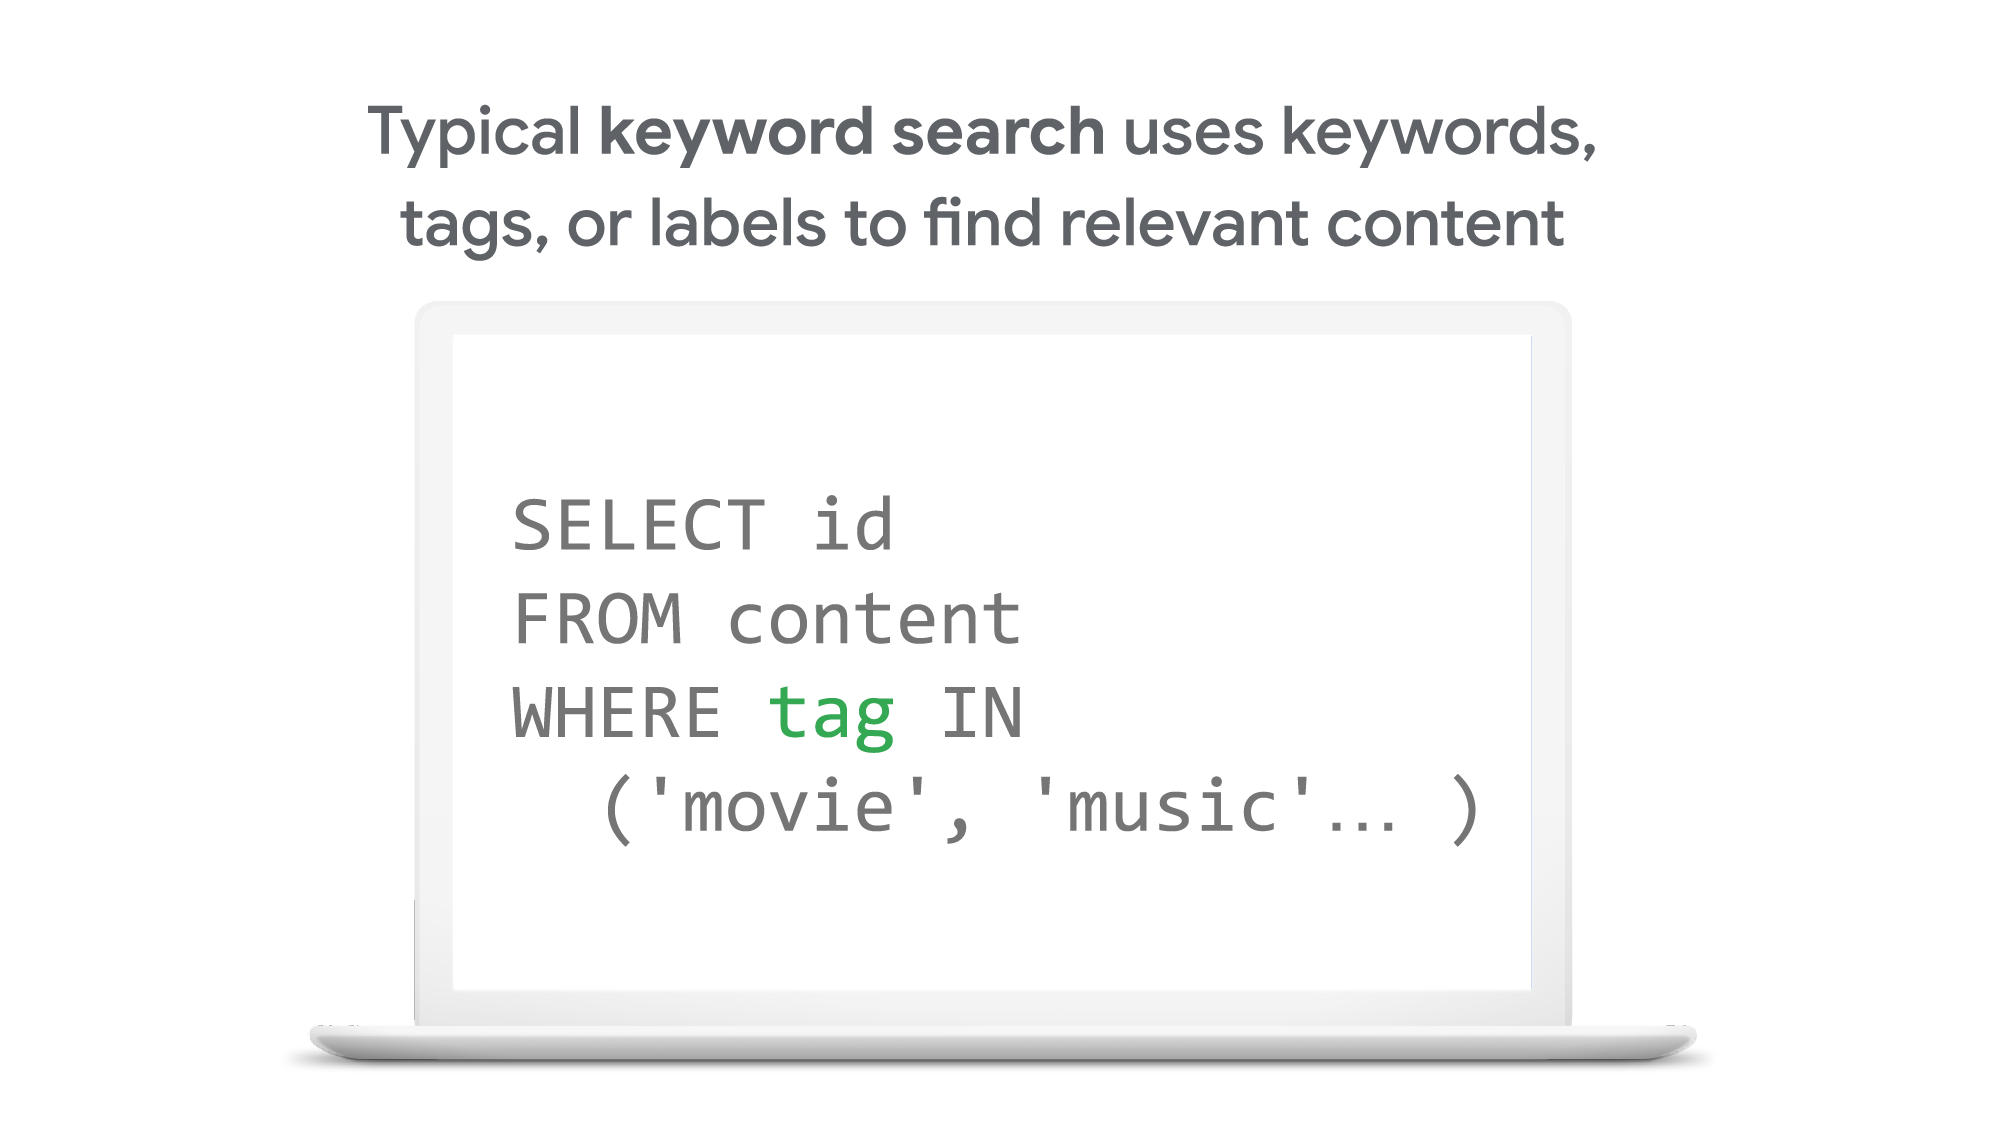
So what’s the difference between traditional keyword-based search and vector similarity search? For many years, relational databases and full-text search engines have been the foundation of information retrieval in modern IT systems. For example, you would add tags or category keywords such as “movie”, “music”, or “actor” to each piece of content (image or text) or each entity (a product, user, IoT device, or anything really). You’d then add those records to a database, so you could perform searches with those tags or keywords.
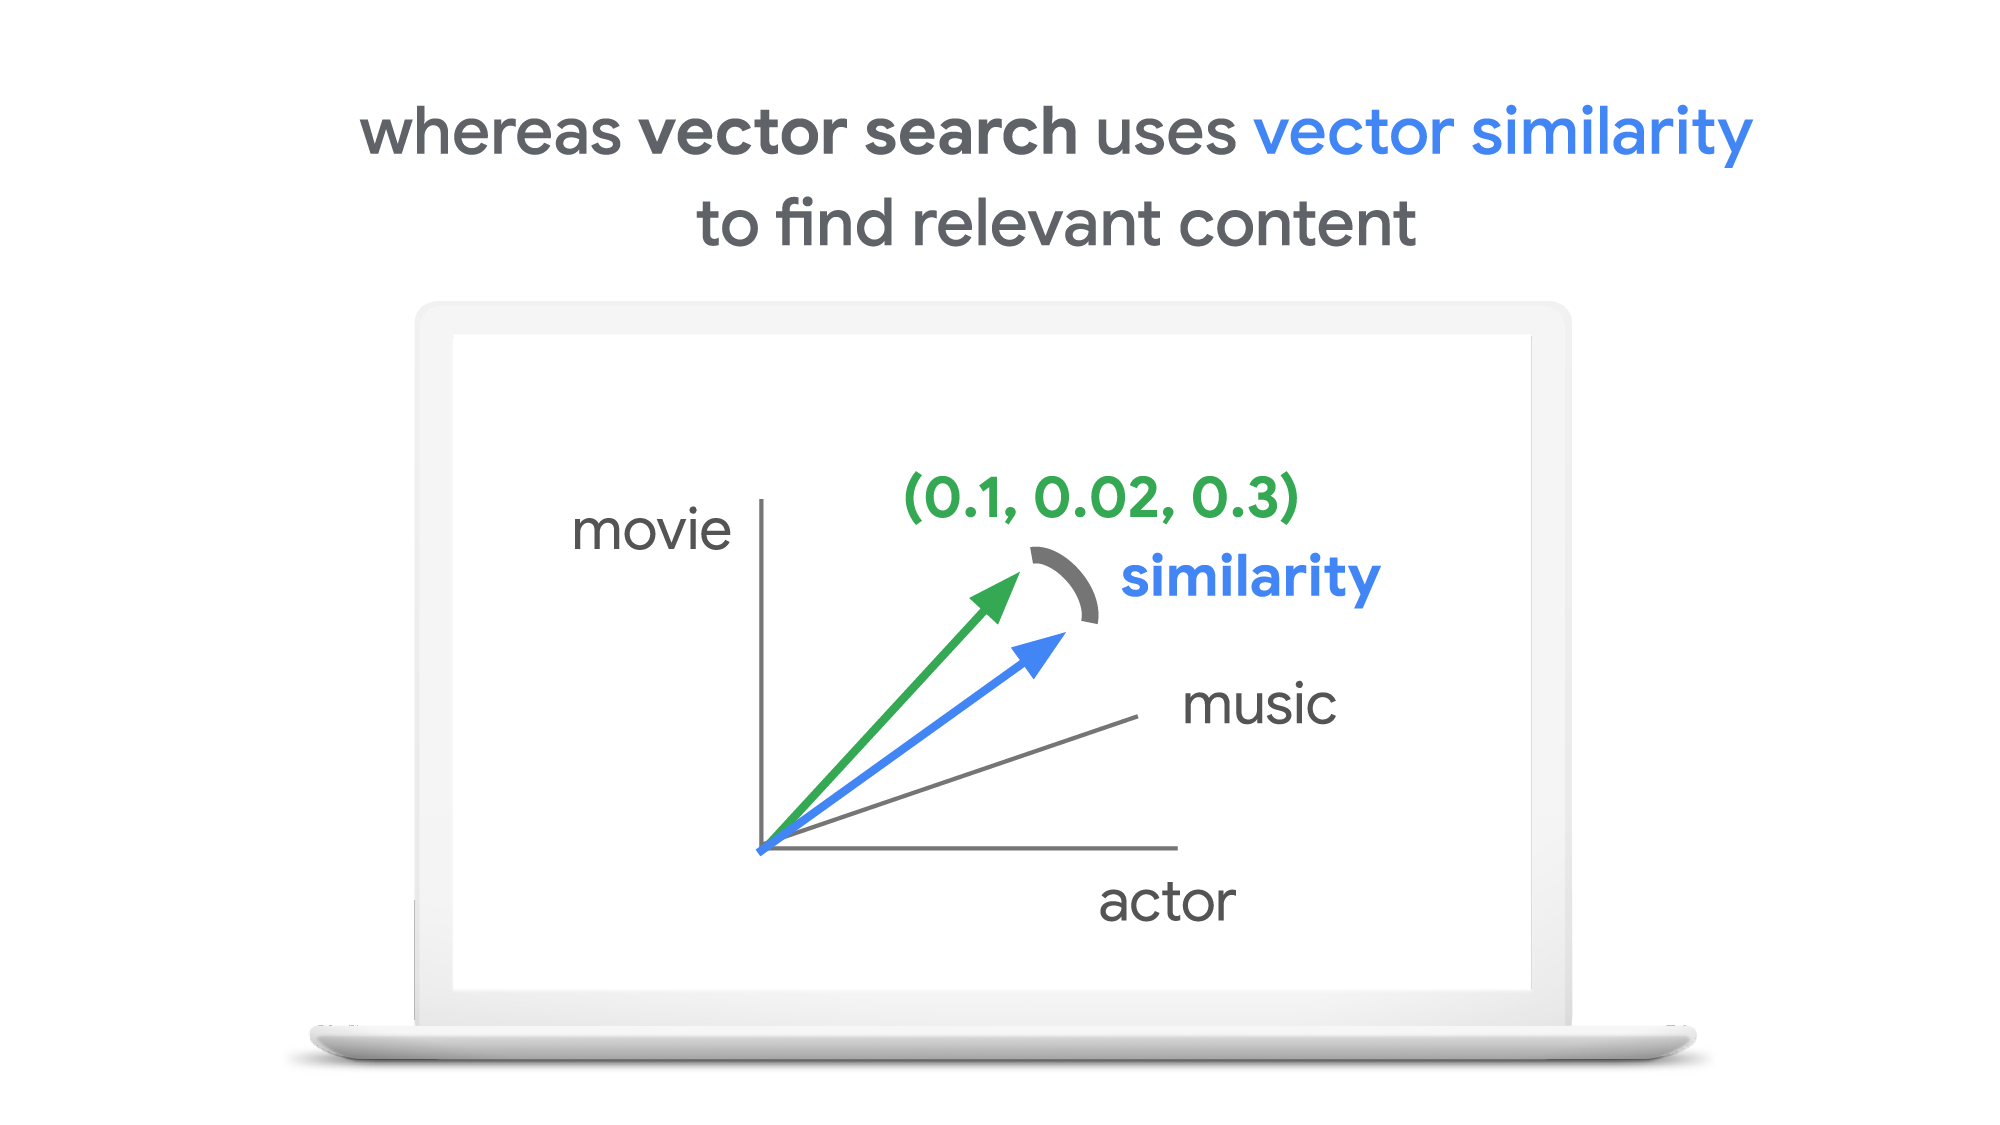
In contrast, vector search uses vectors (where each vector is a list of numbers) for representing and searching content. The combination of the numbers defines similarity to specific topics. For example, if an image (or any content) includes 10% of “movie”, 2% of “music”, and 30% of “actor”-related content, then you could define a vector [0.1, 0.02, 0.3] to represent it. (Note: this is an overly simplified explanation of the concept; the actual vectors have much more complex vector spaces). You can find similar content by comparing the distances and similarities between vectors. This is how Google services find valuable content for a wide variety of users worldwide in milliseconds.
With keyword search, you can only specify a binary choice as an attribute of each piece of content; it’s either about a movie or not, either music or not, and so on. Also, you cannot express the actual “meaning” of the content to search. If you specify a keyword “films”, for example, you would not see any content related to “movies” unless there was a synonyms dictionary that explicitly linked these two terms in the database or search engine.
Vector search provides a much more refined way to find content, with subtle nuances and meanings. Vectors can represent a subset of content that contains “much about actors, some about movies, and a little about music”. Vectors can represent the meaning of content where “films”, “movies”, and “cinema” are all collected together. Also, vectors have the flexibility to represent categories previously unknown to or undefined by service providers. For example, emerging categories of content primarily attractive to kids, such as ASMR or slime, are really hard for adults or marketing professionals to predict beforehand, and going back through vast databases to manually update content with these new labels would be all but impossible to do quickly. But vectors can capture and represent never-before-seen categories instantly.
Vector search changes business
Vector search is not only applicable to image and text content. It can also be used for information retrieval for anything you have in your business when you can define a vector to represent each thing. Here are a few examples:
- Finding similar users: If you define a vector to represent each user in your business by combining the user’s activities, past purchase history, and other user attributes, then you can find all users similar to a specified user. You can then see, for example, users who are purchasing similar products, users that are likely bots, or users who are potential premium customers and who should be targeted with digital marketing.
- Finding similar products or items: With a vector generated from product features such as description, price, sales location, and so on, you can find similar products to answer any number of questions; for example, “What other products do we have that are similar to this one and may work for the same use case?” or “What products sold in the last 24 hours in this area?” (based on time and proximity)
- Finding defective IoT devices: With a vector that captures the features of defective devices from their signals, vector search enables you to instantly find potentially defective devices for proactive maintenance.
- Finding ads: Well-defined vectors let you find the most relevant or appropriate ads for viewers in milliseconds at high throughput.
- Finding security threats: You can identify security threats by vectorizing the signatures of computer virus binaries or malicious attack behaviors against web services or network equipment.
- …and many more: Thousands of different applications of vector search in all industries will likely emerge in the next few years, making the technology as important as relational databases.
OK, vector search sounds cool. But what are the major challenges to applying the technology to real business use cases? Actually there are two:
- Creating vectors that are meaningful for business use cases
- Building a fast and scalable vector search service
Embeddings: meaningful vectors for business use cases
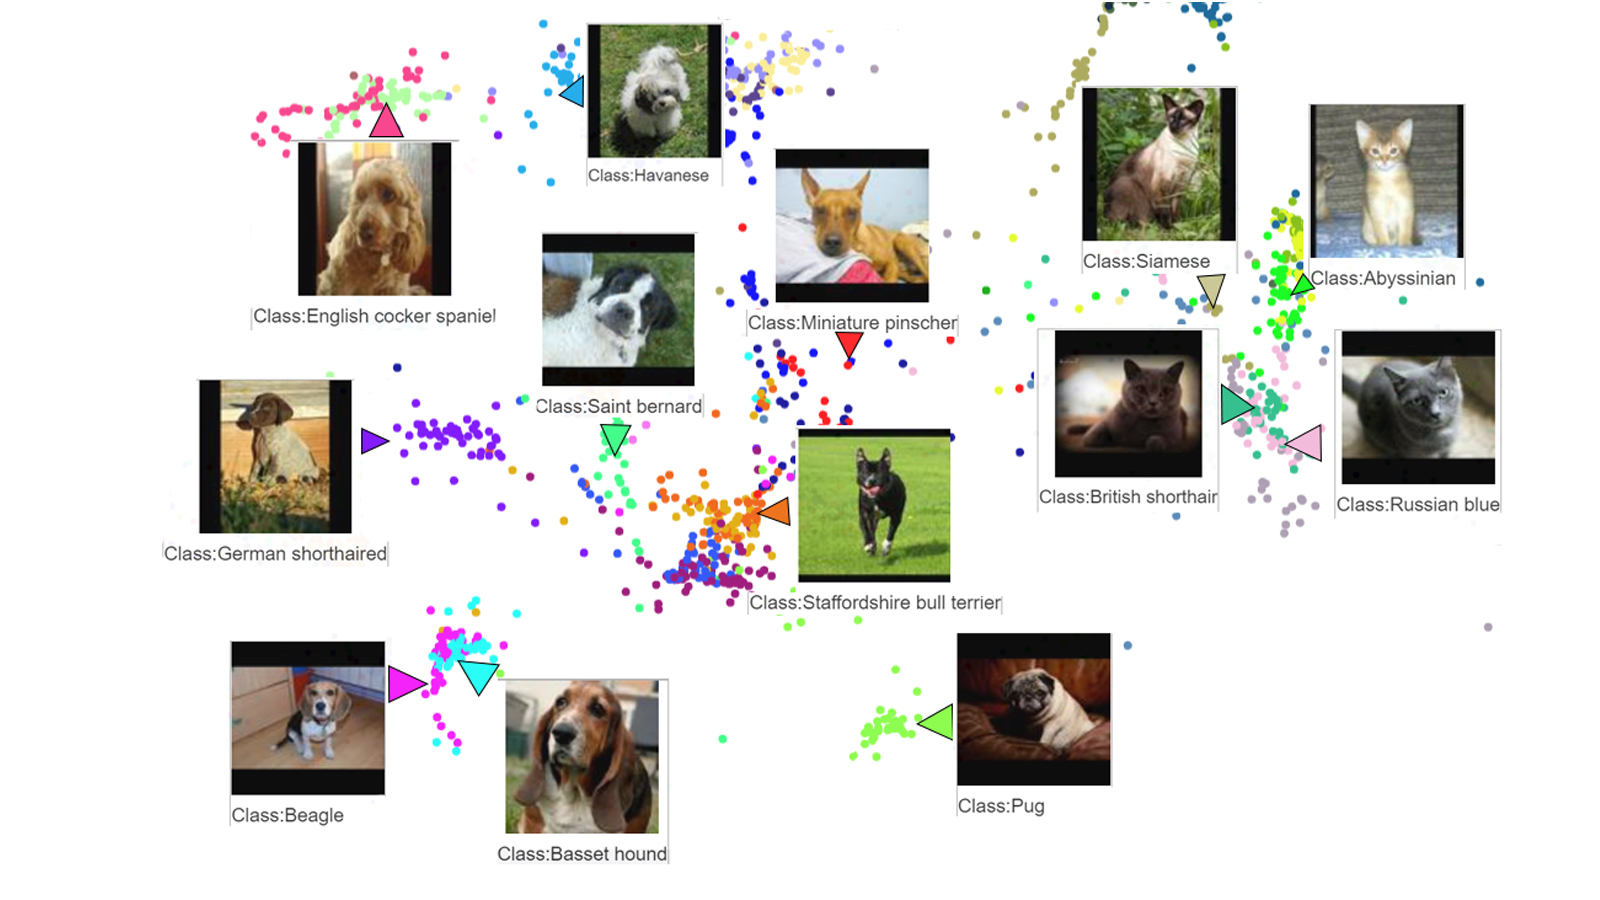
The first challenge is creating vectors for representing various entities that are meaningful and useful for business use cases. This is where deep learning technology can really shine. In the case of the MatchIt Fast demo, the application simply uses a pre-trained MobileNet v2 model for extracting vectors from images, and the Universal Sentence Encoder (USE) for text. By applying such models to raw data, you can extract “embeddings” – vectors that map each row of data in a space of their “meanings”. MobileNet puts images that have similar patterns and textures closer to one another in the embedding space, and USE puts texts that have similar topics closer.
For example, a carefully designed and trained machine learning model could map movies into an embedding space like the following:
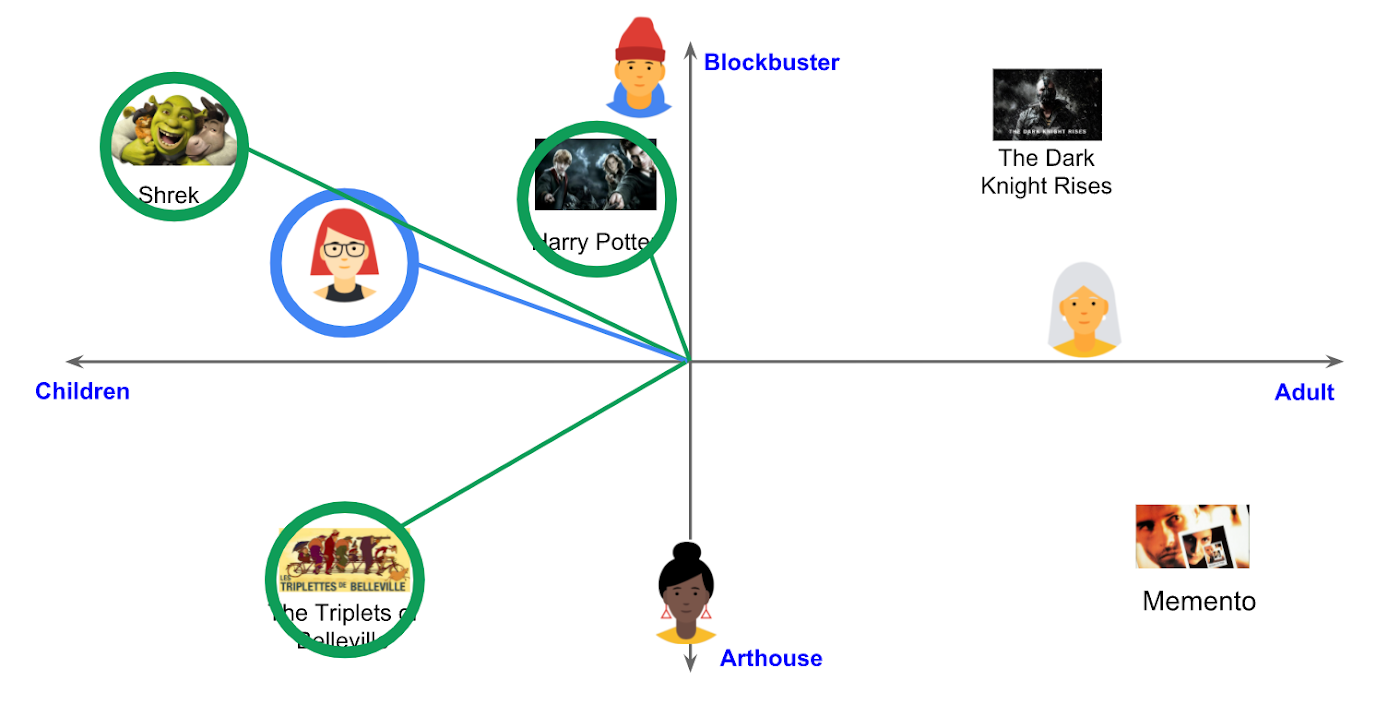
With the embedding space shown here, users could find recommended movies based on the two dimensions: is the movie for children or adults, and is it a blockbuster or arthouse movie? This is a very simple example, of course, but with an embedding space like this that fits your business requirements, you can deliver a better user experience on recommendation and information retrieval services with insights extracted from the model.
For more about creating embeddings, the Machine Learning Crash Course on Recommendation Systems is a great way to get started. We will also discuss how to extract better embeddings from business data later in this post.
Building a fast and scalable vector search service
Suppose that you have successfully extracted useful vectors (embeddings) from your business data. Now the only thing you have to do is search for similar vectors. That sounds simple, but in practice it is not. Let’s see how the vector search works when you implement it with BigQuery in a naive way:https://www.youtube.com/embed/wHNJspvxj2w?enablejsapi=1&
It takes about 20 seconds to find similar items (fish images in this case) from a pool of one million items. That level of performance is not so impressive, especially when compared to the MatchIt Fast demo. BigQuery is one of the fastest data warehouse services in the industry, so why does the vector search take so long?
This illustrates the second challenge: building a fast and scalable vector search engine isn’t an easy task. The most widely used metrics for calculating the similarity between vectors are L2 distance (Euclidean distance), cosine similarity, and inner product (dot product).
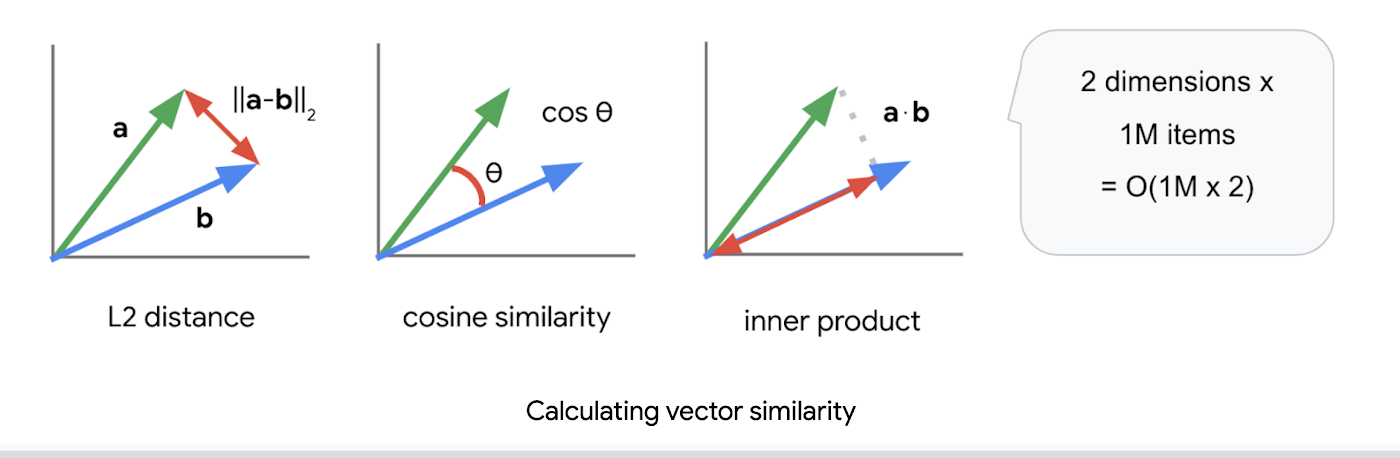
But all require calculations proportional to the number of vectors multiplied by the number of dimensions if you implement them in a naive way. For example, if you compare a vector with 1024 elements to 1M vectors, the number of calculations will be proportional to 1024 x 1M = 1.02B. This is the computation required to look through all the entities for a single search, and the reason why the BigQuery demo above takes so long.
Instead of comparing vectors one by one, you could use the approximate nearest neighbor (ANN) approach to improve search times. Many ANN algorithms use vector quantization (VQ), in which you split the vector space into multiple groups, define “codewords” to represent each group, and search only for those codewords. This VQ technique dramatically enhances query speeds and is the essential part of many ANN algorithms, just like indexing is the essential part of relational databases and full-text search engines.
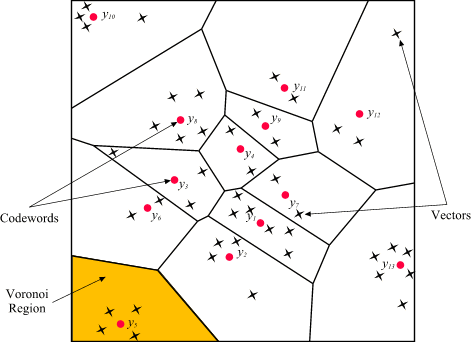
As you may be able to conclude from the diagram above, as the number of groups in the space increases the speed of the search decreases and the accuracy increases. Managing this trade-off — getting higher accuracy at shorter latency — has been a key challenge with ANN algorithms.
Last year, Google Research announced ScaNN, a new solution that provides state-of-the-art results for this challenge. With ScaNN, they introduced a new VQ algorithm called anisotropic vector quantization:
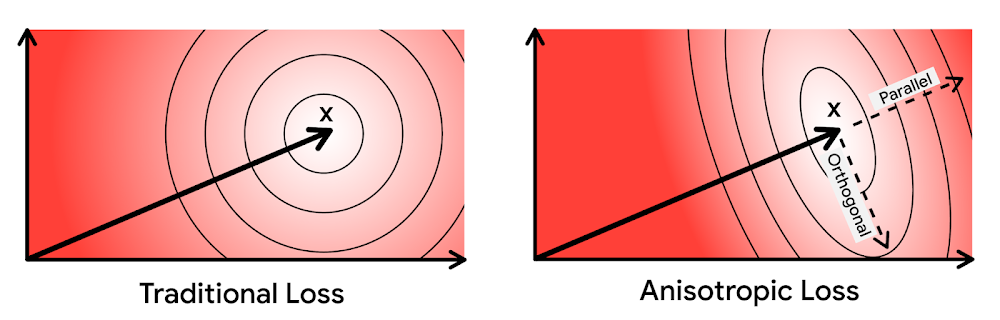
Anisotropic vector quantization uses a new loss function to train a model for VQ for an optimal grouping to capture farther data points (i.e. higher inner product) in a single group. With this idea, the new algorithm gives you higher accuracy at lower latency, as you can see in the benchmark result below (the violet line):
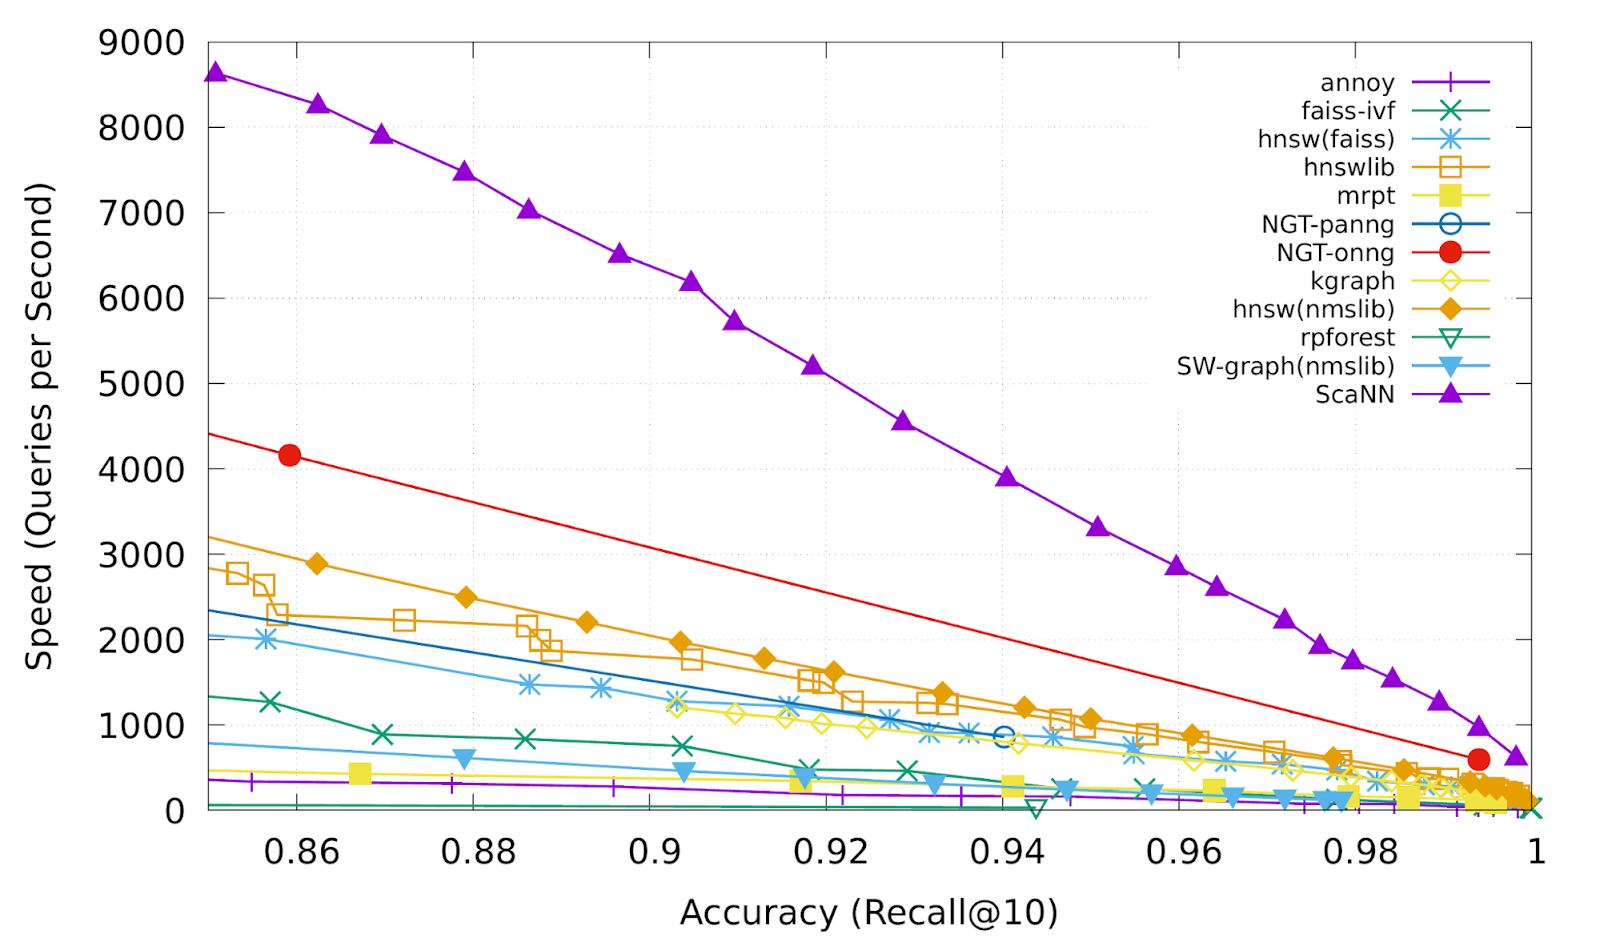
This is the magic ingredient in the user experience you feel when you are using Google Image Search, YouTube, Google Play, and many other services that rely on recommendations and search. In short, Google’s ANN technology enables users to find valuable information in milliseconds, in the vast sea of web content.
How to use Vertex AI Matching Engine
Now you can use the same search technology that powers Google services with your own business data. Vertex AI Matching Engine is the product that shares the same ScaNN based backend with Google services for fast and scalable vector search, and recently it became GA and ready for production use. In addition to ScaNN, Matching Engine gives you additional features as a commercial product, including:
- Scalability and availability: The open source version of ScaNN is a good choice for evaluation purposes, but as with most new and advanced technologies, you can expect challenges when putting it into production on your own. For example, how do you operate it on multiple nodes with high scalability, availability, and maintainability? Matching Engine uses Google’s production backend for ScaNN, which provides auto-scaling and auto-failover with a large worker pool. It is capable of handling tens of thousands of requests per second, and returns search results in less than 10 ms for the 90th percentile with a recall rate of 95 – 98%.
- Fully managed: You don’t have to worry about building and maintaining the search service. Just create or update an index with your vectors, and you will have a production-ready ANN service deployed. No need to think about rebuilding and optimizing indexes, or other maintenance tasks.
- Filtering: Matching Engine provides filtering functionality that enables you to filter search results based on tags you specify on each vector. For example, you can assign “country” and “stocked” tags to each fashion item vector, and specify filters like “(US OR Canada) AND stocked” or “not Japan AND stocked” on your searches.
Let’s see how to use Matching Engine with code examples from the MatchIt Fast demo.
Generating embeddings
Before starting the search, you need to generate embeddings for each item like this one:
{"Id":"b5c65fea9b0b8a57bfa574ea","Embedding": [0.16329009830951691,0.92436742782592773,0.00095699273515492678,0.011479727923870087,0.0089491046965122223,0.019959751516580582,0.031516745686531067,0.0066015380434691906,0.46404418349266052,...
This is an embedding with 1280 dimensions for a single image, generated with a MobileNet v2 model. The MatchIt Fast demo generates embeddings for two million images with the following code:
class Vectorizer:def __init__(self):self._model = tf.keras.Sequential([hub.KerasLayer("https://tfhub.dev/google/imagenet/mobilenet_v2_100_224/feature_vector/5", trainable=False)])self._model.build([None, 224, 224, 3]) # Batch input shape.def vectorize(self, jpeg_file):...snip...embedding = self._model.predict({"inputs": input_tensor})[0].tolist()return embedding
After you generate the embeddings, you store them in a Google Cloud Storage bucket.
Configuring an index
Then, define a JSON file for the index configuration:
{"contentsDeltaUri": "gs://match-it-fast-us-central1/wikimedia_images/index-1","config": {"dimensions": 1280,"approximateNeighborsCount": 150,"distanceMeasureType": "SQUARED_L2_DISTANCE","algorithm_config": {"treeAhConfig": {"leafNodeEmbeddingCount": 1000,"leafNodesToSearchPercent": 5}}}}
You can find a detailed description for each field in the documentation, but here are some important fields:
contentsDeltaUri: the place where you have stored the embeddingsdimensions: how many dimensions in the embeddingsapproximateNeighborsCount: the default number of neighbors to find via approximate searchdistanceMeasureType: how the similarity between embeddings should be measured, either L1, L2, cosine or dot product (this page explains which one to choose for different embeddings)
To create an index on the Matching Engine, run the following gcloud command where the metadata-file option takes the JSON file name defined above.
gcloud --project=gn-match-it-fast beta ai indexes create \--display-name=wikimedia-images \--description="Wikimedia Image Demo" \--metadata-file=metadata/wikimedia_images_index_metadata.json \--region=us-central1
Run the search
Now the Matching Engine is ready to run. The demo processes each search request in the following order:
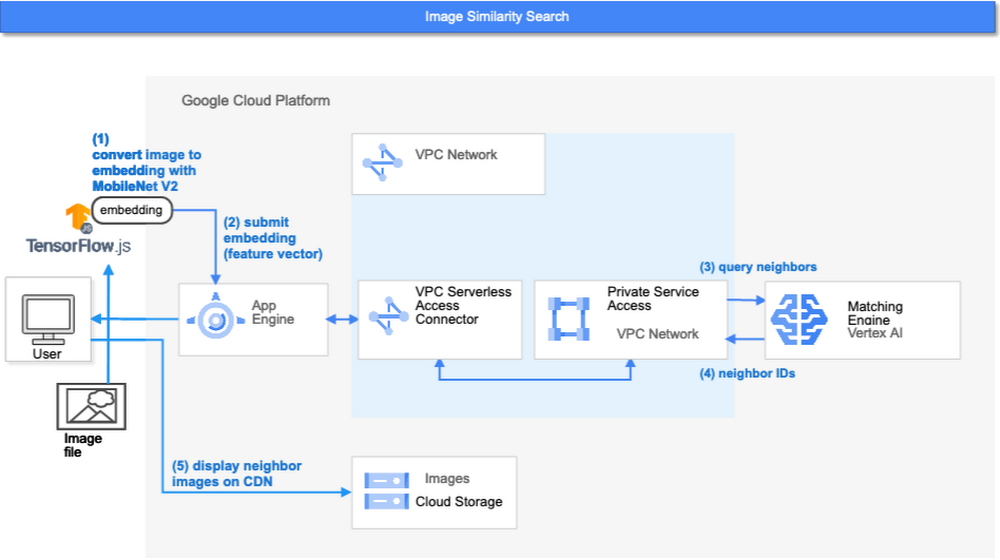
- First, the web UI takes an image (the one chosen or uploaded by the user) and encodes it into an embedding using the TensorFlow.js MobileNet v2 model running inside the browser. Note: this “client-side encoding” is an interesting option for reducing network traffic when you can run the encoding at the client. In many other cases, you would encode contents to embeddings with a server-side prediction service such as Vertex AI Prediction, or just retrieve pre-generated embeddings from a repository like Vertex AI Feature Store.
- The App Engine frontend receives the embedding and submits a query to the Matching Engine. Note that you can also use any other compute services in Google Cloud for submitting queries to Matching Engine, such as Cloud Run, Compute Engine, or Kubernetes Engine, or whatever is most suitable for your applications.
- Matching Engine executes its search. The connection between App Engine and Matching Engine is provided via a VPC private network for optimal latency.
- Matching Engine returns the IDs of similar vectors in its index.
Step 3 is implemented with the following code:
class MatchingQueryClient:...snip...def query_embedding(self, embedding, num_neighbors=30):request = match_service_pb2.MatchRequest()request.deployed_index_id = self._deployed_index_idfor v in embedding:request.float_val.append(v)request.num_neighbors = num_neighborsresponse = self._stub.Match(request)return response
The request to the Matching Engine is sent via gRPC as you can see in the code above. After it gets the request object, it specifies the index id, appends elements of the embedding, specifies the number of neighbors (similar embeddings) to retrieve, and calls the Match function to send the request. The response is received within milliseconds.
Next steps: Making changes for various use cases and better search quality
As we noted earlier, the major challenges in applying vector search on production use cases are:
- Creating vectors that are meaningful for business use cases
- Building a fast and scalable vector search service
From the example above, you can see that Vertex AI Matching Engine solves the second challenge. What about the first one? Matching Engine is a vector search service; it doesn’t include the creating vectors part.
The MatchIt Fast demo uses a simple way of extracting embeddings from images and contents; specifically it uses an existing pre-trained model (either MobileNet v2 or Universal Sentence Encoder). While those are easy to get started with, you may want to explore other options to generate embeddings for other use cases and better search quality, based on your business and user experience requirements.
For example, how do you generate embeddings for product recommendations? The Recommendation Systems section of the Machine Learning Crash Course is a great resource for learning how to use collaborative filtering and DNN models (the two-tower model) to generate embeddings for recommendation. Also, TensorFlow Recommenders provides useful guides and tutorials for the topic, especially on the two-tower model and advanced topics. For integration with Matching Engine, you may also want to check out the Train embeddings by using the two-tower built-in algorithm page.
Another interesting solution is the Swivel model. Swivel is a method for generating item embeddings from an item co-occurrence matrix. For structured data, such as purchase orders, the co-occurrence matrix of items can be computed by counting the number of purchase orders that contain both product A and product B, for all products you want to generate embeddings for. To learn more, take a look at this tutorial on how to use the model with Matching Engine.
If you are looking for more ways to achieve better search quality, consider metric learning, which enables you to train a model for discrimination between entities in the embedding space, not only classification:
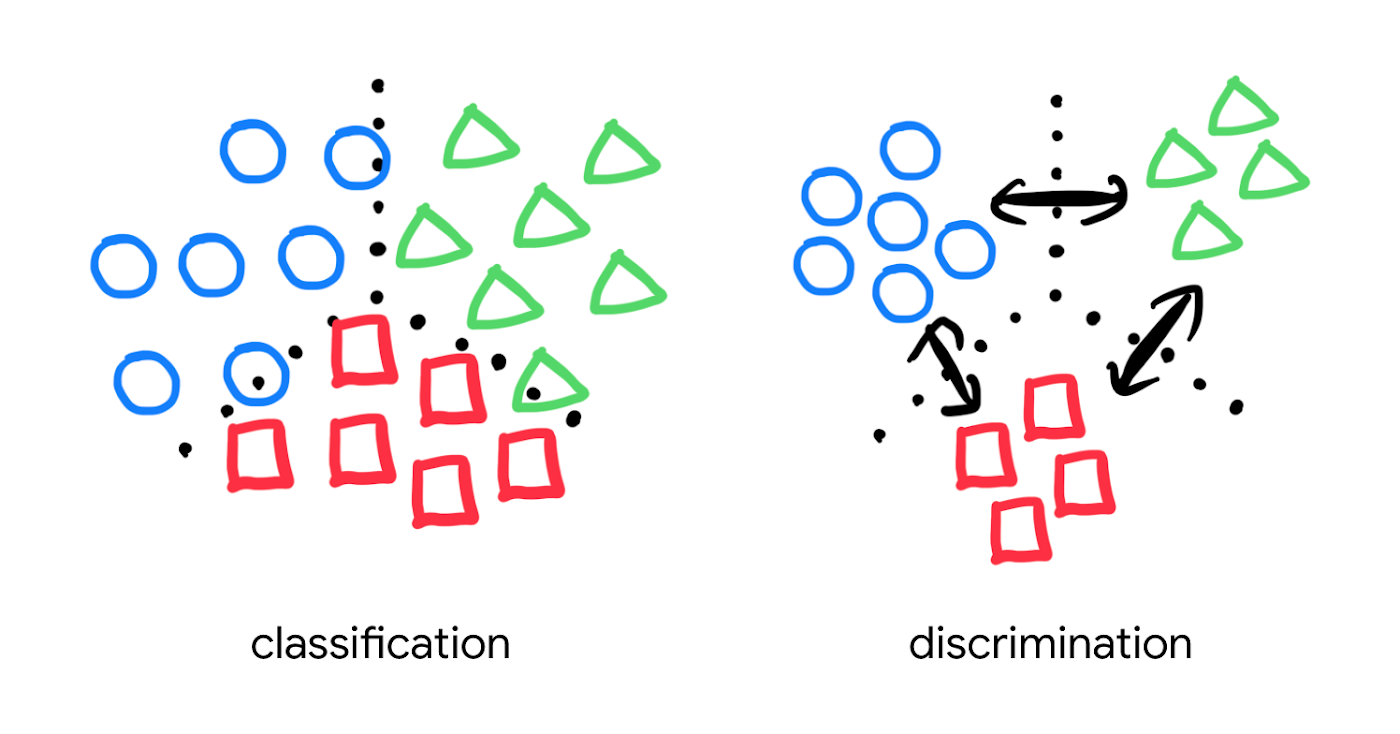
Popular pre-trained models such as the MobileNet v2 can classify each object in an image, but they are not explicitly trained to discriminate the objects from each other with a defined distance metric. With metric learning, you can expect better search quality by designing the embedding space optimized for various business use cases. TensorFlow Similarity could be an option for integrating metric learning with Matching Engine.
Interested? Today, we’re just beginning the migration from traditional search technology to new vector search. Over the next 5 to 10 years, many more best practices and tools will be developed in the industry and community. These tools and best practices will help answer many questions, like… How do you design your own embedding space for a specific business use case? How do you measure search quality? How do you debug and troubleshoot the vector search? How do you build a hybrid setup with existing search engines for meeting sophisticated requirements? There are many new challenges and opportunities ahead for introducing the technology to production. Now’s the time to get started delivering better user experiences and seizing new business opportunities with Matching Engine powered by vector search.
Acknowledgements
We would like to thank Anand Iyer, Phillip Sun, and Jeremy Wortz for their invaluable feedback to this post.
More Relevant Stories for Your Company


Why it’s Easier Than Ever for Developers to Break Into Machine Learning and Data Science
This week we talk about machine learning, its best use cases, and how developers can break into machine learning and data science. Dale Markowitz, Google Developer Advocate, talks about natural language processing as well, explaining that it’s basically the intersection of machine learning and text processing. It can be used
How Real IT Leaders Create a Machine Learning Strategy
Sure, machine learning is becoming a business imperative, but how does it work in practice? That’s the subject of a new step-by-step guide to solving business problems with artificial intelligence and ML, based on insights gathered by IDG Research Services. Its publication comes at a time when technology leaders face

How Kinguin Notched Up Shopping Experience with Google Recommendations AI
Over 2.14 billion people worldwide are expected to buy online this year, according to Statista. Online retail sales will account for 22% of all purchases by 2023. But in a competitive retail landscape, positive interactions can mean the difference between a sale and an abandoned shopping cart. One of the leading global

AirAsia Flies High With Data Analytics and AI
AirAsia’s vision is simple: allow everyone to fly. Founded in 2001, the airline and sister company AirAsia X have grown to service 150+ destinations in 25 markets, using 274 aircraft to operate 11,000+ weekly flights from 23 hubs across the region. While the airline is known as a provider of
