





Tyson Foods’ Story of Unlocking Opportunities by Integrating Real-time Analytics with AI and BI

6474
Of your peers have already read this article.
3:00 Minutes
The most insightful time you'll spend today!
As data environments become more complex, companies are turning to streaming analytics solutions that analyze data as it’s ingested and deliver immediate, high-value insights into what is happening now. These insights enable decision makers to act in real time to take advantage of opportunities or respond to issues as they occur.
While understanding what is happening now has great business value, forward-thinking companies are taking things a step further, using real-time analytics integrated with artificial intelligence (AI) and business intelligence (BI) to answer the question, “what might happen in the future?” Arkansas-based Tyson Foods has embraced AI/BI analytics to enable predictive insights that unlock new opportunities and drive future growth.
Creating a digital twin for connected intelligence company wide
Before using AI/BI, Tyson’s analytics capabilities consisted of traditional BI solutions focused on KPIs and simplifying data so that humans could understand it. Tyson wanted to leverage its data to uncover ways to improve current processes and grow its business. But with BI alone, Tyson struggled to use data to run the simulations and scenarios essential to make educated decisions. To keep growing, it had to embrace the complexity of its data, building ways to analyze it and use it to inform decision making.
Tyson’s on-premises analytics solutions limited its ability to be aggressive and make intelligent, timely, prescriptive decisions. The solution was to create a digital twin to scale optimizations within business processes, moving from local optimizations to system-wide connected optimizations. Doing so meant shifting entirely to cloud computing, with an initial focus on building the ingestion component of the digital twin platform.
Investing in a digital twin enabled Tyson to accelerate new capabilities like supply chain simulation “what-if” scenarios, prescriptive price elasticity recommendations, and improvement of customer intimacy.
Solving the ingestion problem for faster time to insights
Before its migration to Google Cloud, analytics projects that Tyson suffered from uncertainty over how to obtain the data. This problem was prolific and caused project times to be extended for weeks or even months due to the need to write and support one-off data ingestion processes at the front end. This problem also prevented the IT team from delivering analytics solutions fast enough for the business to take full advantage of them.
To solve this analytics problem, the team created Data Ingestion Compute Engine (DICE). DICE is a Google Cloud-hosted, open-source, cloud-native ingestion platform developed to provide configuration-based, no-ops, code-free ingestion from disparate enterprise data systems, both internal and external. It is centered on three high-level goals:
- Accelerate the speed of delivery of IT analytics solutions
- Enable growth of IT capabilities to produce meaningful insight
- Reduce long-term total cost of ownership for ingestion solutions
Creating DICE ingestion platform with Google Cloud services
Teams use DICE to set up secure data ingestion jobs in minutes without having to manage complex connections or write, deploy, and support their own code. DICE enables unbound scale, highly parallel processing, DevSecOps, open source, and the implementation of Lambda Data Architecture.
A DICE job is the logical unit of work in the DICE platform, consisting of immutable and mutable configurations persisted as JSON documents stored in Firestore. The job exists as an instruction set for the DICE data engine, which is Apache Beam running Dataflow to instruct which data to pull, how to pull it, how often to pull it, how to process it, when it changes, and where to direct it.
Two of DICE’s primary layers include the metadata engine and the data engine. The metadata engine is responsible for the creation and management of DICE job configuration and orchestration. It is made up of many microservices that interact with multiple Google Cloud services, including the job configuration creation API, job build configuration helper API, and job execution scheduler API.
The data engine is responsible for the physical ingestion of data, the change detection processing of that data, and the delivery of that data to specified targets. The data engine is Java code that uses the Apache Beam unified programming model and runs in Dataflow. It is comprised of streaming, jobs, and Dataflow flex template batch jobs. Logically, the data engine is segmented across three layers: the inbound processing layer, the DICE file system layer, and the target processing layer, which takes the data from the DICE file system and moves it to targets.
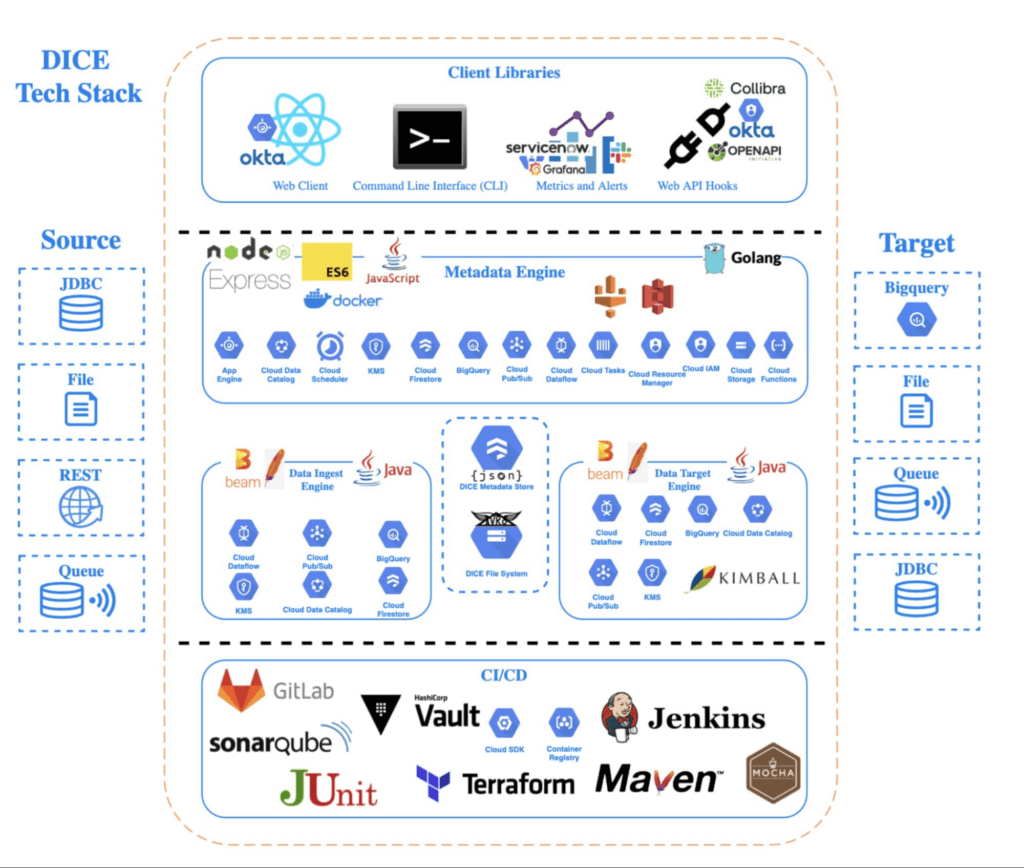
Rolling DICE for thousands of ingestion jobs each day
DICE was first deployed to a production environment in November 2019, and just two years later, it has more than 3,000 data ingestion jobs from more than a hundred disparate data systems, both internal and external to Tyson Foods. Most of these jobs run multiple times a day. On a daily basis the DICE environment sees more than 25,000 Dataflow jobs running and an average of 3.25 terabytes of new data being ingested.
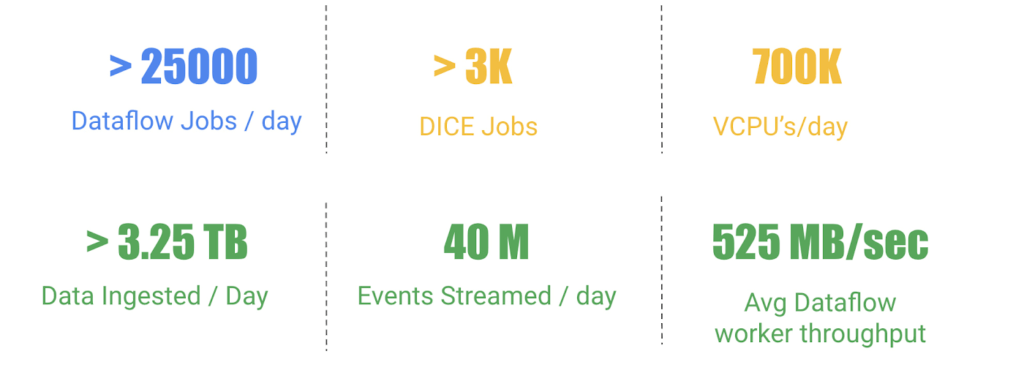
DICE supports ingestion from many different types of technologies, including BigQuery, SQL Server, SAP HANA, Postgres, Oracle, MySQL, Db2, various types of file systems, and FTP servers. Additionally, DICE supports target platform technologies for ingestion jobs that include multiple JDBC targets, multiple file system targets, and BigQuery and queue-based store and forward technologies.
The platform continues to see linear growth of DICE jobs, all while keeping platform costs relatively flat. With increasing demand for the platform, Tyson’s IT team is constantly enhancing DICE to support new sources and targets.
This intelligent platform keeps adding new value and makes it simple for Tyson to take advantage of its data. This innovation is a necessity in this fast-changing world of digital business in which companies must transform a high volume of complex data into actionable insight.
Real-time analytics for on-time delivery: Mercado Libre

3042
Of your peers have already read this article.
1:30 Minutes
The most insightful time you'll spend today!
Iteration and innovation fuel the data-driven culture at Mercado Libre. In our first post, we presented our continuous intelligence approach, which leverages BigQuery and Looker to create a data ecosystem on which people can build their own models and processes.
Using this framework, the Shipping Operations team was able to build a new solution that provided near real-time data monitoring and analytics for our transportation network and enabled data analysts to create, embed, and deliver valuable insights.
The challenge
Shipping operations are critical to success in e-commerce, and Mercado Libre’s process is very complex since our organization spans multiple countries, time zones, and warehouses, and includes both internal and external carriers. In addition, the onset of the pandemic drove exponential order growth, which increased pressure on our shipping team to deliver more while still meeting the 48-hour delivery timelines that customers have come to expect.
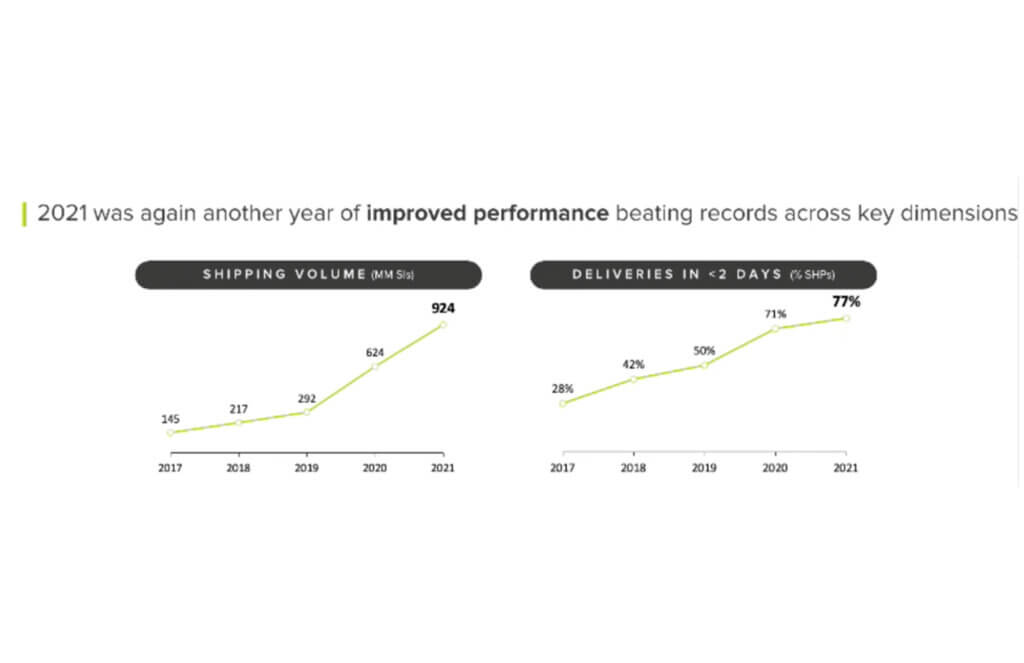
This increased demand led to the expansion of fulfillment centers and cross-docking centers, doubling and tripling the nodes of our network (a.k.a. meli-net) in the leading countries where we operate. We also now have the largest electric vehicle fleet in Latin America and operate domestic flights in Brazil and Mexico.
We previously worked with data coming in from multiple sources, and we used APIs to bring it into different platforms based on the use case. For real-time data consumption and monitoring, we had Kibana, while historical data for business analysis was piped into Teradata. Consequently, the real-time Kibana data and the historical data in Teradata were growing in parallel, without working together. On one hand, we had the operations team using real-time streams of data for monitoring, while on the other, business analysts were building visualizations based on the historical data in our data warehouse.
This approach resulted in a number of problems:
- The operations team lacked visibility and required support to build their visualizations. Specialized BI teams became bottlenecks.
- Maintenance was needed, which led to system downtime.
- Parallel solutions were ungoverned (the ops team used an Elastic database to store and work with attributes and metrics) with unfriendly backups and data bounded for a period of time.
- We couldn’t relate data entities as we do with SQL.
Striking a balance: real-time vs. historical data
We needed to be able to seamlessly navigate between real-time and historical data. To address this need, we decided to migrate the data to BigQuery, knowing we would leverage many use cases at once with Google Cloud.
Once we had our real-time and historical data consolidated within BigQuery, we had the power to make choices about which datasets needed to be made available in near real-time and which didn’t. We evaluated the use of analytics with different time windows tables from the data streams instead of the real-time logs visualization approach. This enabled us to serve near real-time and historical data utilizing the same origin.
We then modeled the data using LookML, Looker’s reusable modeling language based on SQL, and consumed the data through Looker dashboards and Explores. Because Looker queries the database directly, our reporting mirrored the near real-time data stored in BigQuery. Finally, in order to balance near real-time availability with overall consumption costs, we analyzed key use cases on a case-by-case basis to optimize our resource usage.
This solution prevented us from having to maintain two different tools and featured a more scalable architecture. Thanks to the services of GCP and the use of BigQuery, we were able to design a robust data architecture that ensures the availability of data in near real-time.
Streaming data with our own Data Producer Model: from APIs to BigQuery
To make new data streams available, we designed a process which we call the “Data Producer Model” (“Modelo Productor de Datos” or MPD) where functional business teams can serve as data creators in charge of generating data streams and publishing them as related information assets we call “data domains”. Using this process, the new data comes in via JSON format, which is streamed into BigQuery. We then use a 3-tiered transformation process to convert that JSON into a partitioned, columnar structure.
To make these new data sets available in Looker for exploration, we developed a Java utility app to accelerate the development of LookML and make it even more fun for developers to create pipelines.
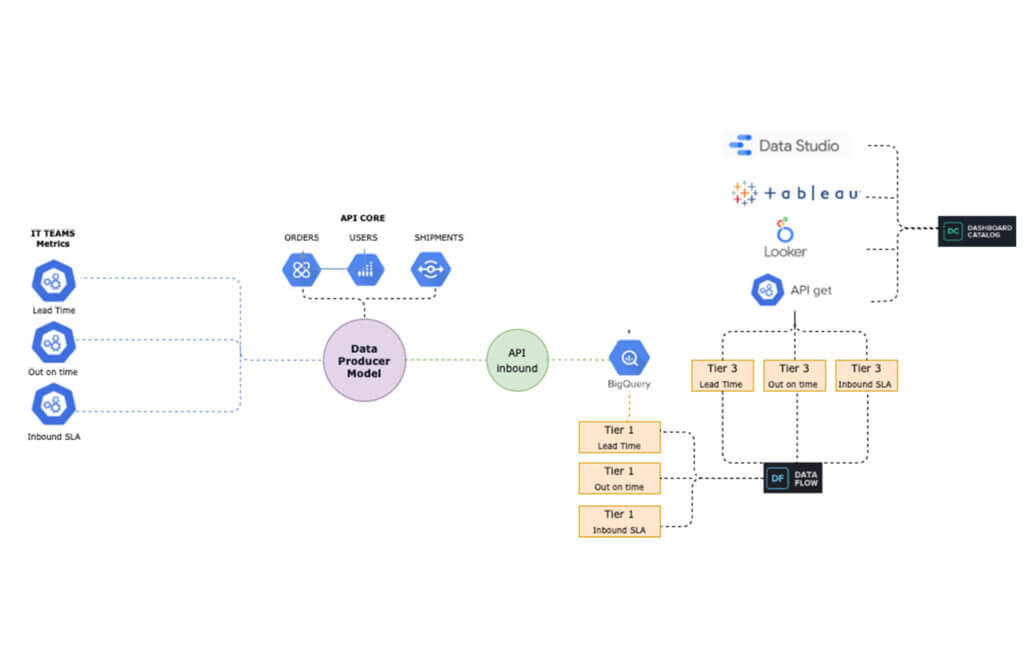
The complete “MPD” solution results in different entities being created in BigQuery with minimal manual intervention. Using this process, we have been able to automate the following:
- The creation of partitioned, columnar tables in BigQuery from JSON samples
- The creation of authorized views in a different GCP BigQuery project (for governance purposes)
- LookML code generation for Looker views
- Job orchestration in a chosen time window
By using this code-based incremental approach with LookML, we were able to incorporate techniques that are traditionally used in DevOps for software development, such as using Lams to validate LookML syntax as a part of the CI process and testing all our definitions and data with Spectacles before they hit production. Applying these principles to our data and business intelligence pipelines has strengthened our continuous intelligence ecosystem. Enabling exploration of that data through Looker and empowering users to easily build their own visualizations has helped us to better engage with stakeholders across the business.
The new data architecture and processes that we have implemented have enabled us to keep up with the growing and ever-changing data from our continuously expanding shipping operations. We have been able to empower a variety of teams to seamlessly develop solutions and manage third party technologies, ensuring that we always know what’s happening – and more critically – enabling us to react in a timely manner when needed.
Outcomes from improving shipping operations:
Today, data is being used to support decision-making in key processes, including:
- Carrier Capacity Optimization
- Outbound Monitoring
- Air Capacity Monitoring
This data-driven approach helps us to better serve you -and everyone- who expects to receive their packages on-time according to our delivery promise. We can proudly say that we have improved both our coverage and speed, delivering 79% of our shipments in less than 48 hours in the first quarter of 2022.
Here is a sneak peek into the data assets that we use to support our day-to-day decision making:
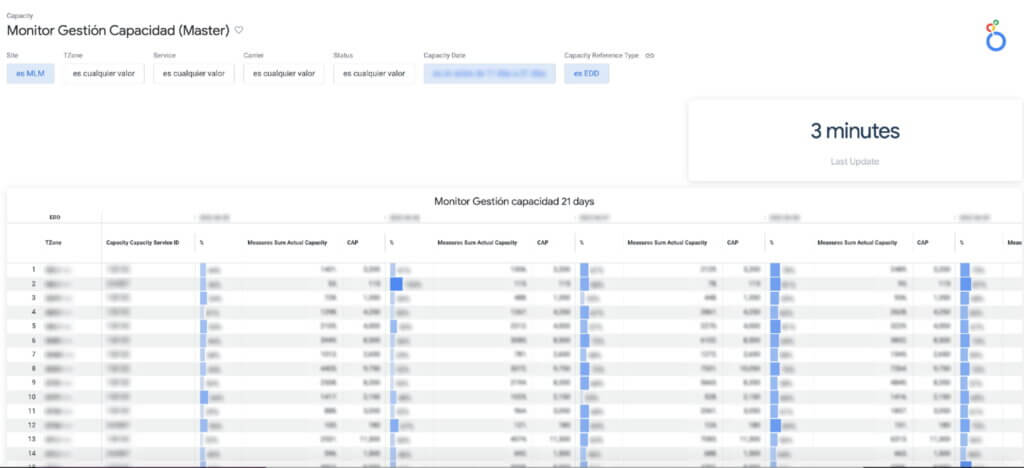
a. Carrier Capacity: Allows us to monitor the percentage of network capacity utilized across every delivery zone and identify where delivery targets are at risk in almost real time.
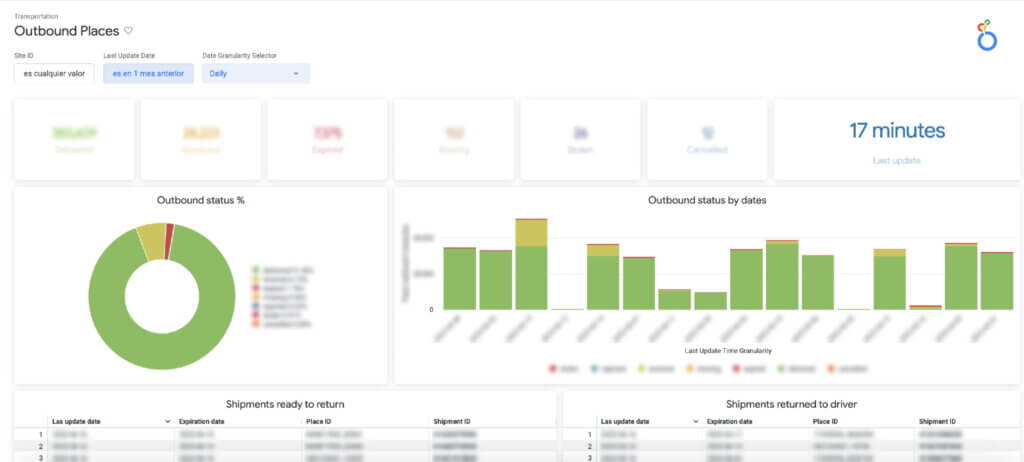
b. Outbound Places Monitoring: Consolidates the number of shipments that are destined for a place (the physical points where a seller picks up a package), enabling us to both identify places with lower delivery efficiency and drill into the status of individual shipments.
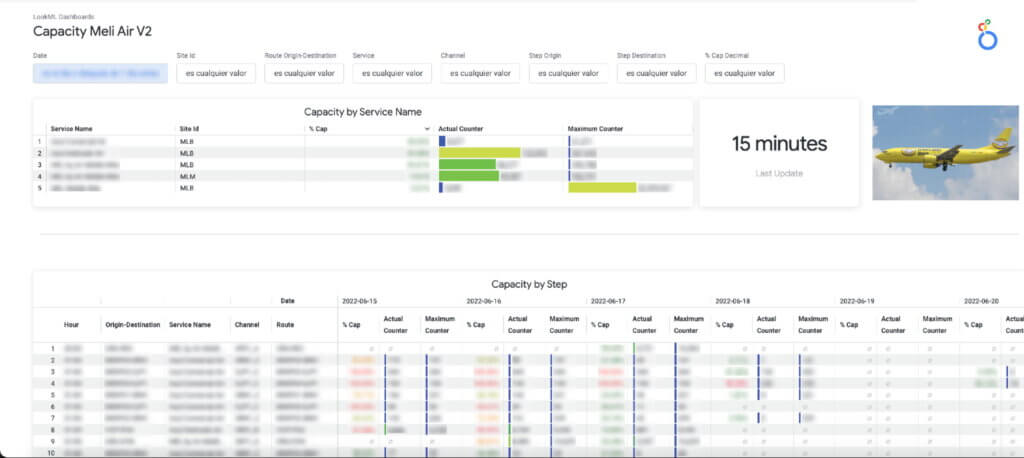
c. The Air Capacity Monitoring: Provides capacity usage monitoring for our aircrafts running each of our shipping routes.
Costs into the equation
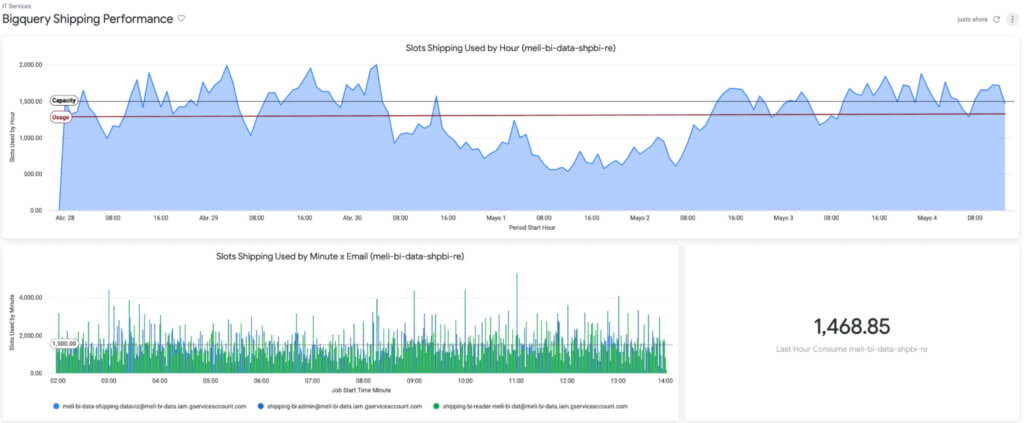
The combination of BigQuery and Looker also showed us something we hadn’t seen before: overall cost and performance of the system. Traditionally, developers maintained focus on metrics like reliability and uptime without factoring in associated costs.
By using BigQuery’s information schema, Looker Blocks, and the export of BigQuery logs, we have been able to closely track data consumption, quickly detect underperforming SQL and errors, and make adjustments to optimize our usage and spend.
Based on that, we know the Looker Shipping Ops dashboards generate a concurrency of more than 150 queries, which we have been able to optimize by taking advantage of BigQuery and Looker caching policies.
The challenges ahead
Using BigQuery and Looker has enabled us to solve numerous data availability and data governance challenges: single point access to near real-time data and to historical information, self-service analytics & exploration for operations and stakeholders across different countries & time zones, horizontal scalability (with no maintenance), and guaranteed reliability and uptime (while accounting for costs), among other benefits.
However, in addition to having the right technology stack and processes in place, we also need to enable every user to make decisions using this governed, trusted data. To continue achieving our business goals, we need to democratize access not just to the data but also to the definitions that give the data meaning. This means incorporating our data definitions with our internal data catalog and serving our LookML definitions to other data visualizations tools like Data Studio, Tableau or even Google Sheets and Slides so that users can work with this data through whatever tools they feel most comfortable using.
If you would like a more indepth look at how we made new data streams available from a process we designed called the “Data Producer Model” (“Modelo Productor de Datos” or MPD) register to attend our webcast on August 31.
While learning and adopting new technologies can be a challenge, we are excited to tackle this next phase, and we expect our users will be too, thanks to a curious and entrepreneurial culture. Are our teams ready to face new changes? Are they able to roll out new processes and designs? We’ll go deep on this in our next post.
Unified, Flexible and Accessible: How Companies’ Data Help Them Achieve More on Google Cloud

4866
Of your peers have already read this article.
1:30 Minutes
The most insightful time you'll spend today!
As the volume of data that people and businesses produce continues to grow exponentially, it goes without saying that data-driven approaches are critical for tech companies and startups across all industries. But our conversations with customers, as well as numerous industry commentaries, reiterate that managing data and extracting value from it remains difficult, especially with scale.
Numerous factors underpin the challenges, including access to and storage of data, inconsistent tools, new and evolving data sources and formats, compliance concerns, and security considerations. To help you identify and solve these challenges, we’ve created a new whitepaper, “The future of data will be unified, flexible, and accessible,” which explores many of the most common reasons our customers tell us they’re choosing Google Cloud to get the most out of their data.
For example, you might need to combine data in legacy systems with new technologies. Does this mean moving all your data to the cloud? Should it be in one cloud or distributed across several? How do you extract real value from all of this data without creating more silos?
You might also be limited to analyzing your data in batch instead of processing it in real-time, adding complexity to your architecture and necessitating expensive maintenance to combat latency. Or you might be struggling with unstructured data, with no scalable way to analyze and manage it. Again, the factors are numerous—but many of them accrue to inadequate access to data, often exacerbated by silos, and insufficient ability to process and understand it.
The modern tech stack should be a streaming stack that scales with your data, provides real-time analytics, incorporates and understands different types of data, and lets you use AI/ML to predictively derive insights and operationalize processes. These requirements mean that to effectively leverage your data assets:
- Data should be unified across your entire company, even across suppliers, partners, and platforms., eliminating organizational and technology silos.
- Unstructured data should be unlocked and leveraged in your analytics strategy.
- The technology stack should be unified and flexible enough to support use cases ranging from analysis of offline data to real-time streaming and application of ML without maintaining multiple bespoke tech stacks.
- The technology stack should be accessible on-demand, with support for different platforms, programming languages, tools, and open standards compatible with your employees’ existing skill sets.
With these requirements met, you’ll be equipped to maximize your data, whether that means discerning and adapting to changing customer expectations or understanding and optimizing how your data engineers and data scientists spend their time. In coming weeks, we’ll explore aspects of the whitepaper in additional blog posts—but if you’re ready to dive in now, and to steer your tech company or startup towards success by making your data better work for you, click here to download your copy, free of charge.
Quantum Metric Increases Business 10-fold

9249
Of your peers have already read this article.
5:30 Minutes
The most insightful time you'll spend today!
At Quantum Metric, we’re in the business of bringing our customers business insights that are based on customer experience data and analytics for mid-market and Fortune 500 companies.
Our software, powered by big data, machine intelligence, and Google Cloud, helps our customers identify, quantify, prioritize and measure opportunities to improve digital experiences.
As companies move to a more agile product lifecycle, including continuous deployment and continuous integration, they’re finding that it’s critical to receive perpetual quantified feedback and insights from their data in real time to understand where the largest opportunities exist.
Each year, billions of customer interactions are captured through browsers or mobile apps on PCs, tablets, and mobile devices. This data, fed into the Quantum Metric platform, can show if a customer had a password problem they couldn’t solve or struggled when trying to purchase something and abandoned their cart.
It also can show if the customer tried in vain to complete an online change to their service provider’s subscription, to reach tech support, or couldn’t find the size or color they were looking for while shopping online.
Most importantly, the Quantum Metric platform quantifies the business value of the issue, helping organizations prioritize where they can make the largest impact to their business.
Success overwhelms our initial architecture
Initially, the Quantum Metric experience analytics software ran on a MySQL open source relational database management system (RDBMS). The MySQL RDBMS worked great for simple queries, when there was a specific question to ask of the data.
Soon, though, we knew we needed to offer more advanced data science capabilities. Our bigger customers wanted to ask questions across very large data sets—days, weeks, months, and years worth of data. They wanted to pose iterative questions using complex filters to answer their most challenging business questions.
With more complex queries across more data, response times from our RDBMS went from 100 to 500 milliseconds to as long as 20 minutes.
That delay was slowing down our ability and time to insights, which also reduced the value we could provide to our customers, since iterative exploration and analysis requires real-time query responses. Because of the need for real-time responses, there were certain questions that we just weren’t able to ask of the data. It became clear that we needed a much more robust data warehouse solution.
There were also operational challenges with MySQL and massive-scale data ingestion. We spent a lot of time into the wee hours of the night and morning handling errors and recovering databases.
We tried to address these challenges by sharding, partitioning, and indexing the data to optimize for the types of questions customers were asking. But the problems were escalating and happening more often, from once a month across the customer base to monthly for at least 20 different customers.
We could tune the platform for today and tomorrow’s workload, with good guesses at where indexes could be used, but we simply couldn’t continue to horizontally scale MySQL in a cost-efficient and operationally efficient manner.
Speed breeds innovation
Once we started exploring options that could better scale with our business, we looked at NoSQL technologies like Cassandra (a partitioned row-store database), MySQL’s Column Store (a columnar store database), and Vertica (a columnar store database)—each with unique ways of handling data storage and accessibility.
But with high volumes of complex queries across large data stores, all of these solutions began to fail, bogged down with multiple, simultaneous users. We could have solved the problems with more raw compute and storage, but it would have been prohibitively expensive to run and require a large team to operate.
We then decided to try BigQuery, and it was transformative.
We connected our front end to BigQuery via APIs. Once data is 15 minutes old, it is automatically extracted, loaded, and transformed (ETL) to BigQuery.
We continuously update the legacy MySQL RDBMS so its data is integrated with BigQuery data when queries require real-time data. Most query response times are within 100-200 milliseconds, matching what we initially experienced with MySQL.
When traffic from our customers scales up, we can now scale on-demand to accommodate it, thanks to BigQuery’s hundreds of thousands of CPUs. Our customers no longer run into slow response times, and we’ve gained confidence that we can offer them—and their users—advanced insights and better experiences without delay.
More importantly, with this scale of query power, we were able to build data science algorithms into the platform, which iteratively query BigQuery based on the results, and help quantify the impact of a specific issue to a specific segment of users. Adding these capabilities was possible because of the massive scale of BigQuery.
In addition to new insights and fast response times, we wanted our customers to be able to ask complex questions using very simple language.
For example: “Show me high-loyalty customers, located in specific geographic areas, who visited the web site at least five times, based on specific campaigns, and never booked a seat on a flight.”
This was exactly the kind of query that was used by a major U.S. airline to understand the multi-million dollar impact of a failure affecting their most valuable customers: their high-loyalty members.
And this was all done while maintaining the highest standard of care of customer data and privacy by default, using multiple layers of encryption of data in transit, at rest, and a unique military-grade encryption approach. This approach encrypts PII, including even session cookies, with a RSA-2048 key available only to a select few and used for use cases such as fraud analysis.
It’s no exaggeration to say that BigQuery has totally transformed our business. It provides the petabyte scale and speed we were missing, in addition to taking care of operational maintenance, a task that was burying our team with MySQL.
We’re now able to support some of the largest companies in the world that require real-time, petabyte-scale analytics. That lets them serve more customers faster with higher quality, and take advantage of BigQuery’s power and scale to innovate.
There are other cloud solutions that can address petabyte analytics, but the most unique value proposition of BigQuery was its on-demand scaling and operational management, with extremely cost-effective pay-as-you-go billing. While today we are at a scale where we have round-the-clock querying needs, our early days had very sporadic query loads where we needed instant scale, then a long lull of nothing. The unique business model of BigQuery’s pay-by-bytes-scanned allowed us to have access to a massive-scale querying platform without breaking the bank.
Using BigQuery powers better customer experience and reduces purchasing friction
Among the many features of Quantum Metric is the ability to replay online customer sessions. In the example below from a mobile e-commerce site, each action is displayed chronologically. Why did this customer’s transaction fail?
Diving deeper, the session replay shows that the user tried to change the item quantity in the checkout cart, which resulted in a failed API call. Powered by BigQuery, Quantum Metric can then show how many other end users had this issue, with a simple click of “Show More Errors Like This.”
With BigQuery’s massive scale, Quantum Metric will then quantify the impact of that issue, so companies can prioritize which issues need attention immediately. If this is the issue that’s impacting the business the most, our customer can use a single click to open a Jira ticket, forwarding the discovery to their product and engineering teams. Those teams can then re-engineer the experience in near-real time, addressing the failed API call and cutting out the frustrating time it takes for engineers to reproduce the issue.
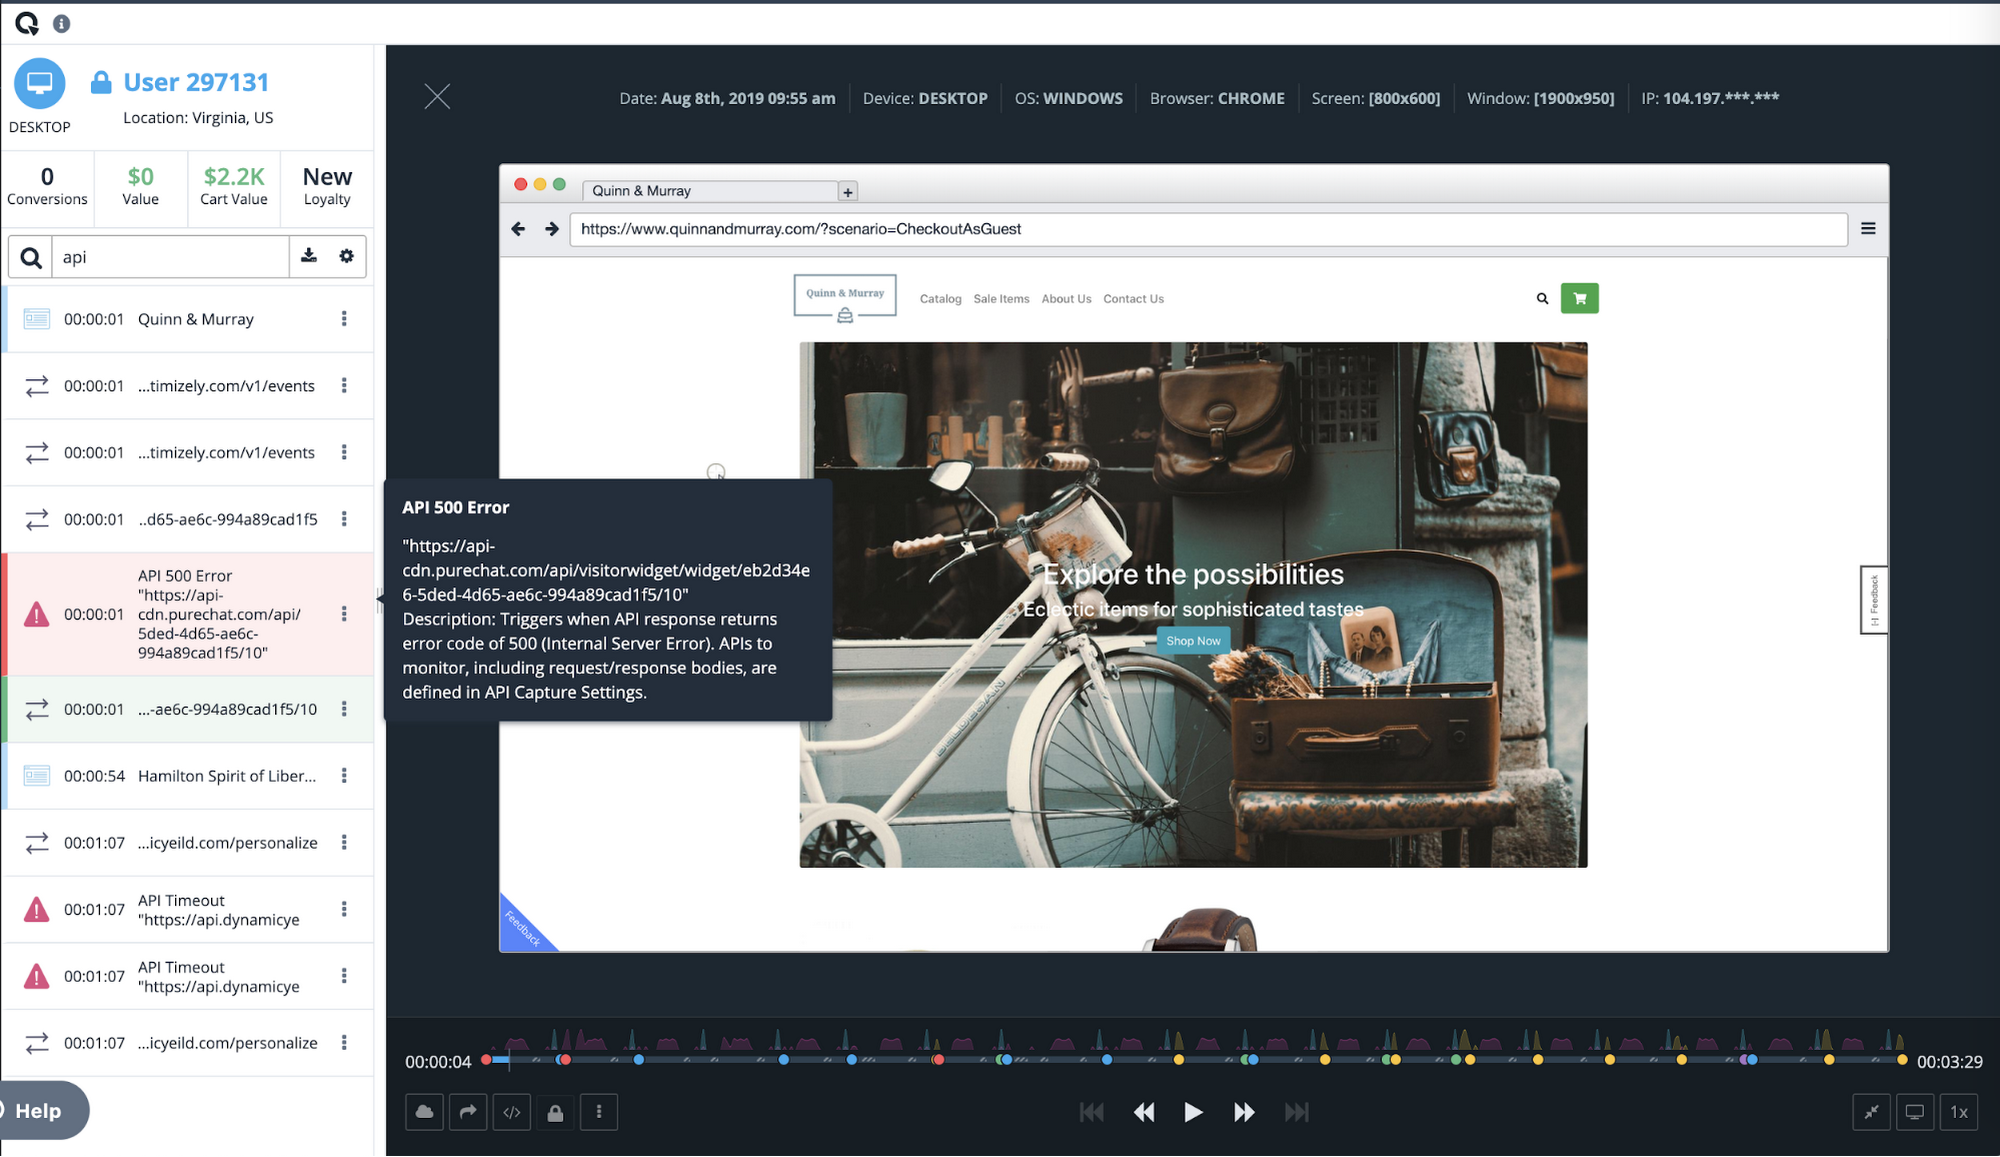
Once we had a powerful back end in BigQuery, we realized that Quantum Metric’s platform could be used to ask complex questions from vast datasets. We built some of the processes that data scientists use to formulate those queries right into our product.
For example, we added one series of processes to our platform to help customers understand whether a suspect issue is really impacting end-user experience. Is it something that should be prioritized and fixed? Does this really affect the user experience? Does it have financial impact? These and other questions can be pre-defined as a complex query in Quantum Metric to let our customer quickly gain insight on how an issue is impacting the business. Customers were blown away when they heard this was possible. It was the holy grail for what they were looking for in data science. It really sets us apart from our competition.
Today, with every company heavily dependent on data, those companies that can uncover and act on insights fastest are the ones that will succeed. BigQuery gives us the data warehouse platform we need to provide our customers with fast, reliable technology tools. It frees us from having to deal with the minutiae of technology infrastructure operations, so we can focus on finding and extracting the magic in customer data. With the power and scale of BigQuery, combined with the real-time capture of every user experience with 100% fidelity, we’re able to offer a self-service analytics platform that provides insights into digital journey friction points and acts as the indisputable arbitrator of truth.
10503
Of your peers have already watched this video.
2:15 Minutes
The most insightful time you'll spend today!
The True Story of How HotStar Broke a World-Record–Thanks to Firebase and Google BigQuery
Hotstar, India’s largest video streaming platform with 150 million monthly active users around the world, provides live-streaming of TV shows, movies, sports, and news on the go.
By using a combination of Firebase products together, Hotstar safely rolled out new features to its watch screen during a major live-streaming event without disrupting users, sacrificing stability, or releasing a new build. They also used Firebase with BigQuery to analyze their event data and reduce app startup time.
“We have an ambitious mission, but our engineering team is only a fraction of the size of most of our competitors. But we are still keeping up, and we are doing it with the help of Firebase,” says Ayushi Gupta, Android Engineer, Hotstar.
Google’s Anti-Pattern Recognition Tool: Streamlining BigQuery Performance

1227
Of your peers have already read this article.
2:30 Minutes
The most insightful time you'll spend today!
Why do we need a BigQuery anti-pattern recognition tool?
BigQuery is a serverless and cost-effective enterprise data warehouse that works across cloud environments and scales with your data. As with any large scale data-intensive platform, following best practices and avoiding inefficient anti-patterns goes a long way in terms of performance and cost savings.
Usually SQL optimization requires a significant time investment from engineers, who must read high-complexity queries, devise a variety of approaches to improve performance and efficiency, and test several optimization techniques. The best place to start is to fix anti-patterns, since this only requires easily applicable changes and provides significant performance improvements.
To facilitate the task of identifying and fixing said anti-pattern, Google Professional Services Organization (PSO) and Global Services Delivery (GSD) have developed a BigQuery anti-pattern recognition tool. This tool automates the process of scanning SQL queries, identifying antipatterns, and providing optimization recommendations.
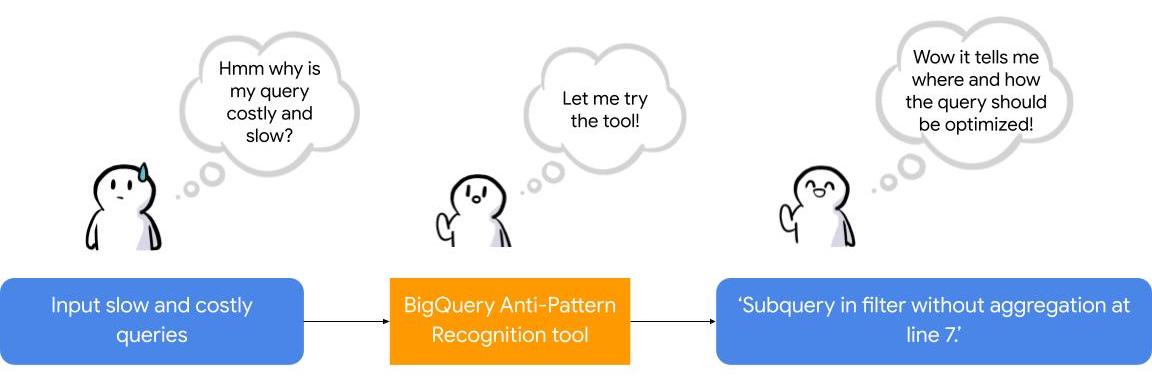
What is the BigQuery anti-pattern recognition tool?
The BigQuery anti-pattern recognition tool let you easily identify performance impacting anti-patterns across a large number of SQL queries in a single go.
It utilizes ZetaSQL to parse BigQuery SQL queries into abstract syntax trees (AST) and then traverses the tree nodes to detect the presence of anti-patterns.
The tool takes a BigQuery SQL query as an input, such as:
SELECT
 t.dim1,
 t.metric1
FROM
 `dataset.table` t
WHERE
 t.id NOT IN (
 SELECT
   id
 FROM
   `dataset.table2`)
And produces the output as:
Subquery in filter without aggregation at line 8.
It examines potential optimizations, including:
- Selecting only the necessary columns
- Handling multiple WITH-clause references
- Addressing subqueries in filters with aggregations
- Optimizing ORDER BY queries with LIMIT
- Enhancing string comparisons
- Improving JOIN patterns
- Avoiding subquery aggregation in the WHERE clause
The solution supports reading from various sources, such as:
- Command line
- Local files
- Cloud Storage files
- Local folders
- Cloud Storage folders
- CSV (with one query per line)
- INFORMATION_SCHEMA
Additionally, the solution provides flexibility in writing output to different destinations, including:
- Printing to the terminal
- Exporting as CSV
Writing to a BigQuery table
Using the BigQuery anti-pattern recognition tool
The BigQuery anti-pattern recognition tool is hosted on GitHub. Below are the Quick Start steps on using the tool via command line for inline queries. You can also leverage Cloud Run to deploy it as a container on cloud.
Prerequisites
- Linux OS
- JDK 11 or above is installed
- Maven
- Docker
- gcloud CLI
Quick start: – steps
1. Clone the repo into your local machine.
git clone git@github.com:GoogleCloudPlatform/bigquery-antipattern-recognition.git
2. Build the tool image inside the `bigquery-antipattern-recognition` folder.
mvn clean package jib:dockerBuild -DskipTests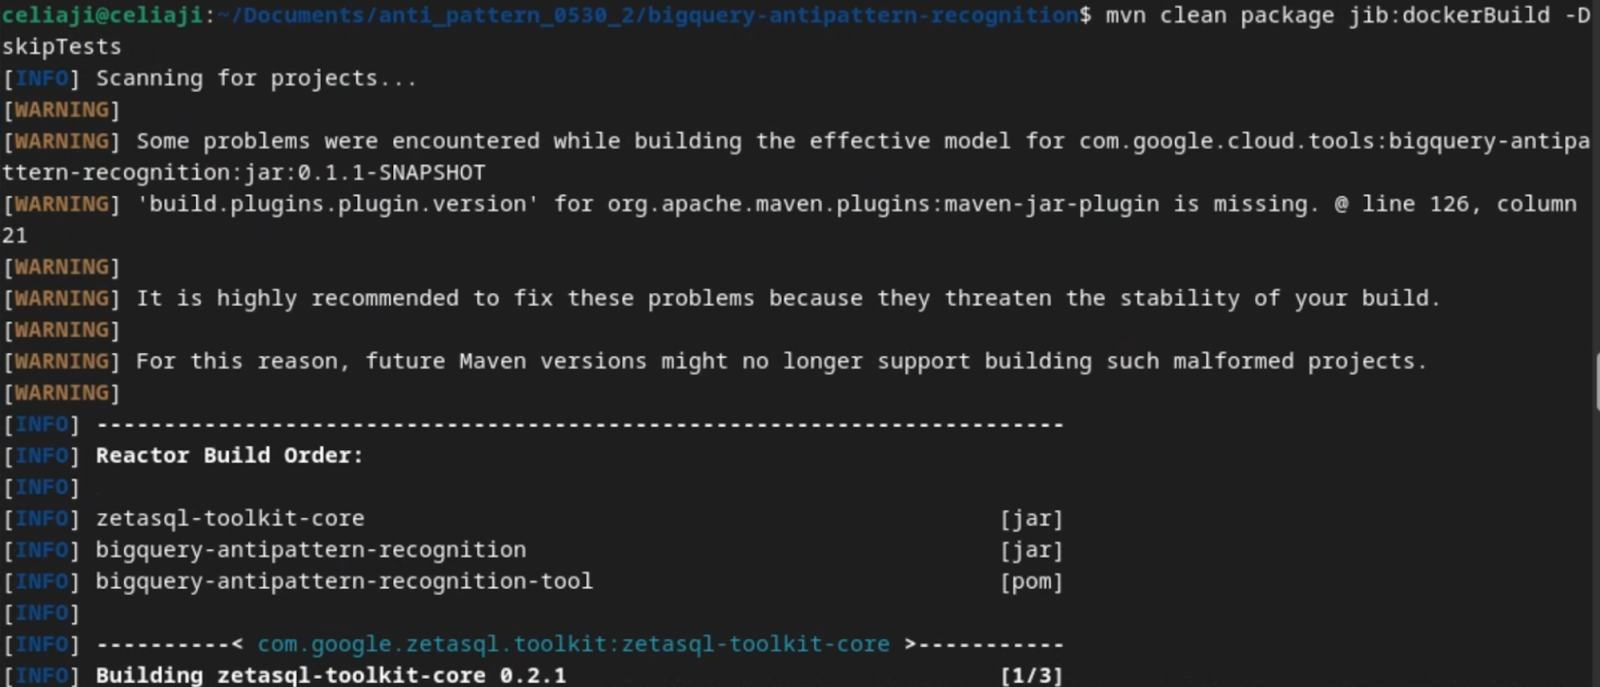
3. Run the tool for a simple inline query.
docker run \
  -i bigquery-antipattern-recognition \
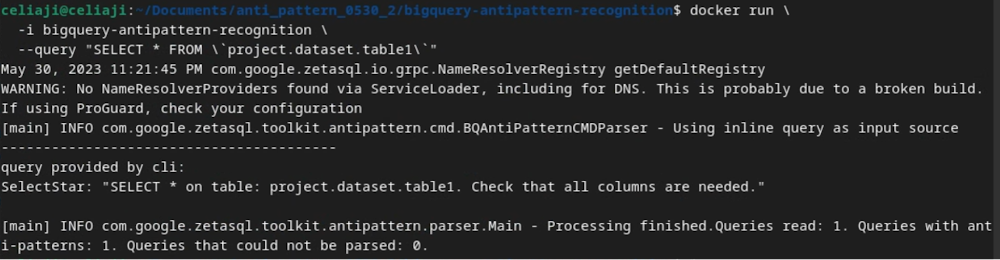
  --query "SELECT * FROM \`project.dataset.table1\`"
4. Below is the output result in the command-line interface:
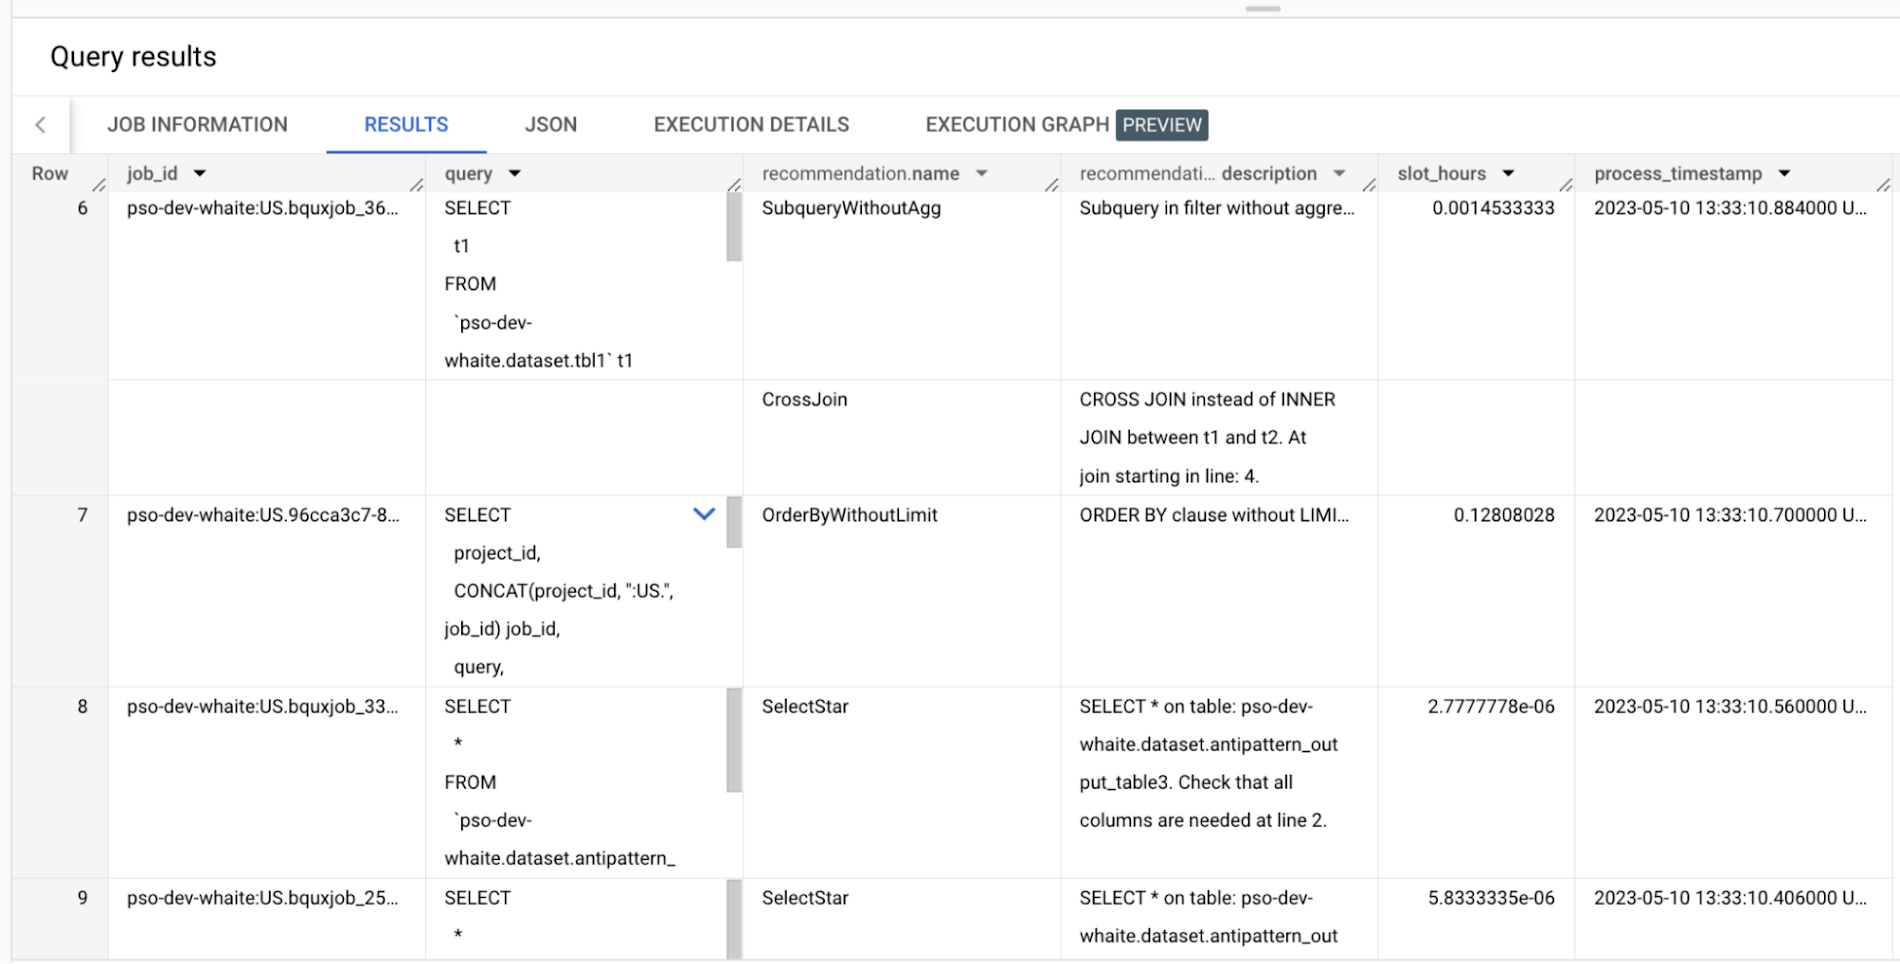
Additionally, the above tool can read queries from Information Schema and load the output recommendations to a BigQuery table.
Below is an example of the BigQuery anti-pattern recognition tool results exported to a BigQuery table.
Getting started
Ready to start optimizing your BigQuery queries and cutting costs? Check out the tool here and contribute to the tool via GitHub.
Have questions or feedback?
We’re actively working on new features to make the tool as useful to our customers. Use it and tell us what you think! For product feedback/technical questions, reach out to us at bq-antipattern-eng@google.com. If you’re already a BigQuery customer and would like a briefing on the tool, please reach out, we’d be happy to talk.
More Relevant Stories for Your Company

Migrate Your Microsoft SQL Server Workloads to Google Cloud
Enterprise database workloads are the backbone of many of your applications and ecosystems. Also, guaranteed availability is critical when choosing a cloud provider. Many enterprises built their mission-critical applications on Microsoft SQL Server 2008, and it’s common still to run into older versions of SQL Server as you’re working toward




The Inside Story of How Home Depot Migrated to Google BigQuery From an On-prem DW Solution
In the media, you will often hear story of how born-in-the-cloud companies manage with massive infrastructure. But it is one thing is to be a startup, and build infrastructure with bespoke requirements. And quite another to have a complex, multinational organization with online, with mobile, with brick-and-mortar presence, and hundreds

Choose the Right Google Database Service With This Chart
A growing number of Indian enterprises are leveraging the Google Cloud to run their database workloads. This is because Google Cloud offers fully managed, scalable database services to support all applications today and tomorrow. In fact, Forrester has named Google as a Leader in The Forrester Wave™: Database-as-a-Service, Q2 2019.

Spot Slow MySQL Queries Fast with Stackdriver Monitoring
When you’re serving customers online, speed is essential for a good experience. As the amount of data in a database grows, queries that used to be fast can slow down. For example, if a query has to scan every row because a table is missing an index, response times that
