





Spot Slow MySQL Queries Fast with Stackdriver Monitoring

4030
Of your peers have already read this article.
4:30 Minutes
The most insightful time you'll spend today!
When you’re serving customers online, speed is essential for a good experience. As the amount of data in a database grows, queries that used to be fast can slow down.
For example, if a query has to scan every row because a table is missing an index, response times that were acceptable with a thousand rows can turn into multiple seconds of waiting once you have a million rows.
If this query is executed every time a user loads your web page, their browsing experience will slow to a crawl, causing user frustration. Slow queries can also impact automated jobs, causing them to time out before completion.
If there are too many of these slow queries executing at once, the database can even run out of connections, causing all new queries, slow or fast, to fail.
The popular open-source databases MySQL and Google Cloud Platform‘s fully managed version, Cloud SQL for MySQL, include a feature to log slow queries, letting you find the cause, then optimize for better performance.
However, developers and database administrators typically only access this slow query log reactively, after users have seen the effects and escalated the performance degradation.
With Stackdriver Logging and Monitoring, you can stay ahead of the curve for database performance with automatic alerts when query latency goes over the threshold, and a monitoring dashboard that lets you quickly pinpoint the specific queries causing the slowdown.
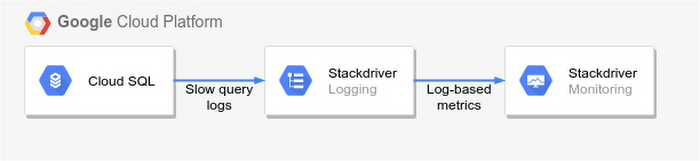
To get started, import MySQL’s slow query log into Stackdriver Logging.
Once the logs are in Stackdriver, it’s straightforward to set up logs-based metrics that can both count the number of slow queries over time, which is useful for setting up appropriate alerts, and also provide breakdowns by slow SQL statement, allowing speedy troubleshooting.
What’s more, this approach works equally well for managed databases in Cloud SQL for MySQL and for self-managed MySQL databases hosted on Compute Engine.
For a step-by-step tutorial to set up slow query monitoring, check out Monitoring slow queries in MySQL with Stackdriver. For more ideas about what else you can accomplish with Stackdriver Logging, check out Design patterns for exporting Stackdriver Logging.
Google Spanner Wins SIGOPS Hall of Fame Award 2022
2918
Of your peers have already read this article.
1:30 Minutes
The most insightful time you'll spend today!
Earlier this month, SIGOPS announced that it had selected the paper, “Spanner: Google’s Globally-Distributed Database” for the 2022 SIGOPS Hall of Fame Award, an honor bestowed on the most influential Operating Systems papers published by the organization.
In giving this award, the award committee stated:
“Spanner showed how to balance the requirements of consistency, availability, and partition tolerance for a globally replicated transactional database system. In doing so, Spanner simplified the implementation of a range of higher level services which could then scale across the planet through a familiar and powerful transactional API. The key insights of leveraging clock synchronization using TrueTime and a dedicated, redundant, high-capacity datacenter WAN distinct from the public Internet as the basis for scaling remain fundamental design patterns today.”
As one of the original authors of the paper, to say that I am humbled by this award is an understatement. It’s also taken me on a trip down memory lane, and gotten me thinking about all the ways — expected and unexpected — that Spanner has influenced not only how Google builds its applications, but also how it’s simplified application design and operations for organizations that aren’t running at hyperscale.
From very early on — think early 2000s — one of Google’s biggest challenges was scaling its software to keep up with the rapid growth of the internet. We needed a database that scaled, that could be built with a small team. Those needs led to Bigtable and the NoSQL movement: a feature-lean database that performed and scaled.
But as Google grew, and entered other lines of business, our priorities evolved. We needed to simplify the jobs of our ever-larger engineering staff and support business-critical services like the AdWords and Payments platforms, as well as then-new consumer products like Gmail. To do that, we knew we had to give our product teams database features like ACID transactions, multi-region consistency, schema-declared invariants, SQL, and more — without compromising on cost or scale. At the time it was an outrageous goal, but with our experience building Bigtable and Megastore, as well as new innovations like TrueTime, we knew it could be done – and it was clear talking to our internal customers that it needed to be done.
Like most good software, our plans for Spanner really came together when we found our first serious customer: AdWords. At the time, Google’s entire advertiser-facing interface was sharded across MySQL instances on specially acquired hardware. Ads had just completed a very challenging resharding project to accommodate Google’s growing business, and was resolute in its desire to never do it again. So the Spanner team and Ads partnered on a project, called F1, to transparently move the entire AdWords stack from MySQL to Spanner.
“Before Spanner, Google’s entire advertiser-facing interface was sharded across MySQL instances on specially acquired hardware.”
By 2012, when we published the Spanner paper, we had just completed the migration of AdWords frontend traffic to the new Spanner backend, and we knew we had the seed of something really interesting. Since then, we have been rapidly improving Spanner in every dimension. Google, like most businesses, needs databases that are fully managed, easy to deploy, highly available, and robust in the face of any workload. Google services set a high bar: Spanner stores a copy of the Internet (actually several, at different stages of the indexing pipeline) and is the bedrock of availability and durability for billions of users that depend on Google in their daily lives.
Then, in 2017, Google Cloud launched Cloud Spanner, a fully managed database service that brought the unique capabilities of Spanner to every organization, allowing them to deliver always-on experiences at any scale from thousands to millions of active users across the world without sacrificing consistency.
That took us down another road: innovating to make it easy for all enterprises to build data-driven applications using Cloud Spanner. This meant adding enterprise features such as CMEK and access approval, fine-grained access control, backup and restore, and point-in-time recovery (PITR). We also added VPC Service Controls support and compliance certifications and necessary approvals so that Spanner can be used for workloads requiring ISO 27001, 27017, 27018, PCI DSS, SOC1|2|3, HIPAA and FedRamp. More recently, we added granular instance sizing, a PostgreSQL interface, and free trial instances to lower the barrier to entry for Spanner, and make it accessible for any developer and for any application, big or small.
Speaking of small, one of the interesting things we discovered along the way is that Spanner isn’t only a great fit for huge mission-critical applications – we also use it internally for smaller applications and internal tools, secure in the knowledge that the data is safe, available, and nowhere near any limits. That’s the thing about infrastructure innovations: at their best, they aren’t only about scale, they’re about extracting complexity from applications and presenting the solution in an easy-to-use package.
As we have incorporated solutions to those problems into Spanner, customers have dramatically simplified their applications. For example, application teams often created a dedicated “storage” tier to provide higher-level features like indexes, transactions, or data synchronization needed to support their business logic. Spanner enables application teams to hollow out or even completely eliminate these tiers for significant cost and maintenance savings. We have also seen big reliability dividends: rather than each application discovering the corner cases of transactions, consistency or high availability architectures one at a time, Spanner’s customers are all able to benefit from a rigorously designed and battle-tested implementation out of the gate.
“At their best, infrastructure innovations aren’t only about scale, they’re about extracting complexity from applications and presenting the solution in an easy-to-use package.”
The tradeoff between the scale limitations of relational databases and the functionality limitations of NoSQL systems is really familiar, and the software world has learned to build great applications within those confines. But we never tire of seeing great applications transform as Spanner melts the distinction away.
Get started with Spanner
It has never been easier to try out Spanner. With a free trial instance, you can try out Spanner at no cost for 90 days. You can even prototype an entire application for free on Google Cloud by using the Spanner free trial along with the free tier offered by other Google Cloud products such as Compute Engine and BigQuery.
Create a 90-day Spanner free trial instance. Try Spanner free.
Take a deep dive into the new trial experience and learn more about Spanner.
Dataplex: Google Cloud’s Intelligent Data Fabric to Manage Data and Analytics at Scale

4854
Of your peers have already read this article.
2:30 Minutes
The most insightful time you'll spend today!
Enterprises are struggling to make high quality data easily discoverable and accessible for analytics, across multiple silos, to a growing number of people and tools within their organization. They are often forced to make tradeoffs—to move and duplicate data across silos to enable diverse analytics use cases or leave their data distributed but limit the agility of decisions.
Today we are excited to announce Dataplex, an intelligent data fabric that provides a way to centrally manage, monitor, and govern your data across data lakes, data warehouses and data marts, and make this data securely accessible to a variety of analytics and data science tools.
Dataplex provides an integrated analytics experience, bringing together the best of Google Cloud and open source tools, so you can rapidly curate, secure, integrate, and analyze data at scale. With built-in data intelligence using Google Artificial Intelligence (AI) and machine learning (ML) capabilities and a flexible consumption model, you can now spend less time wrestling with infrastructure and more time focused on driving business outcomes.
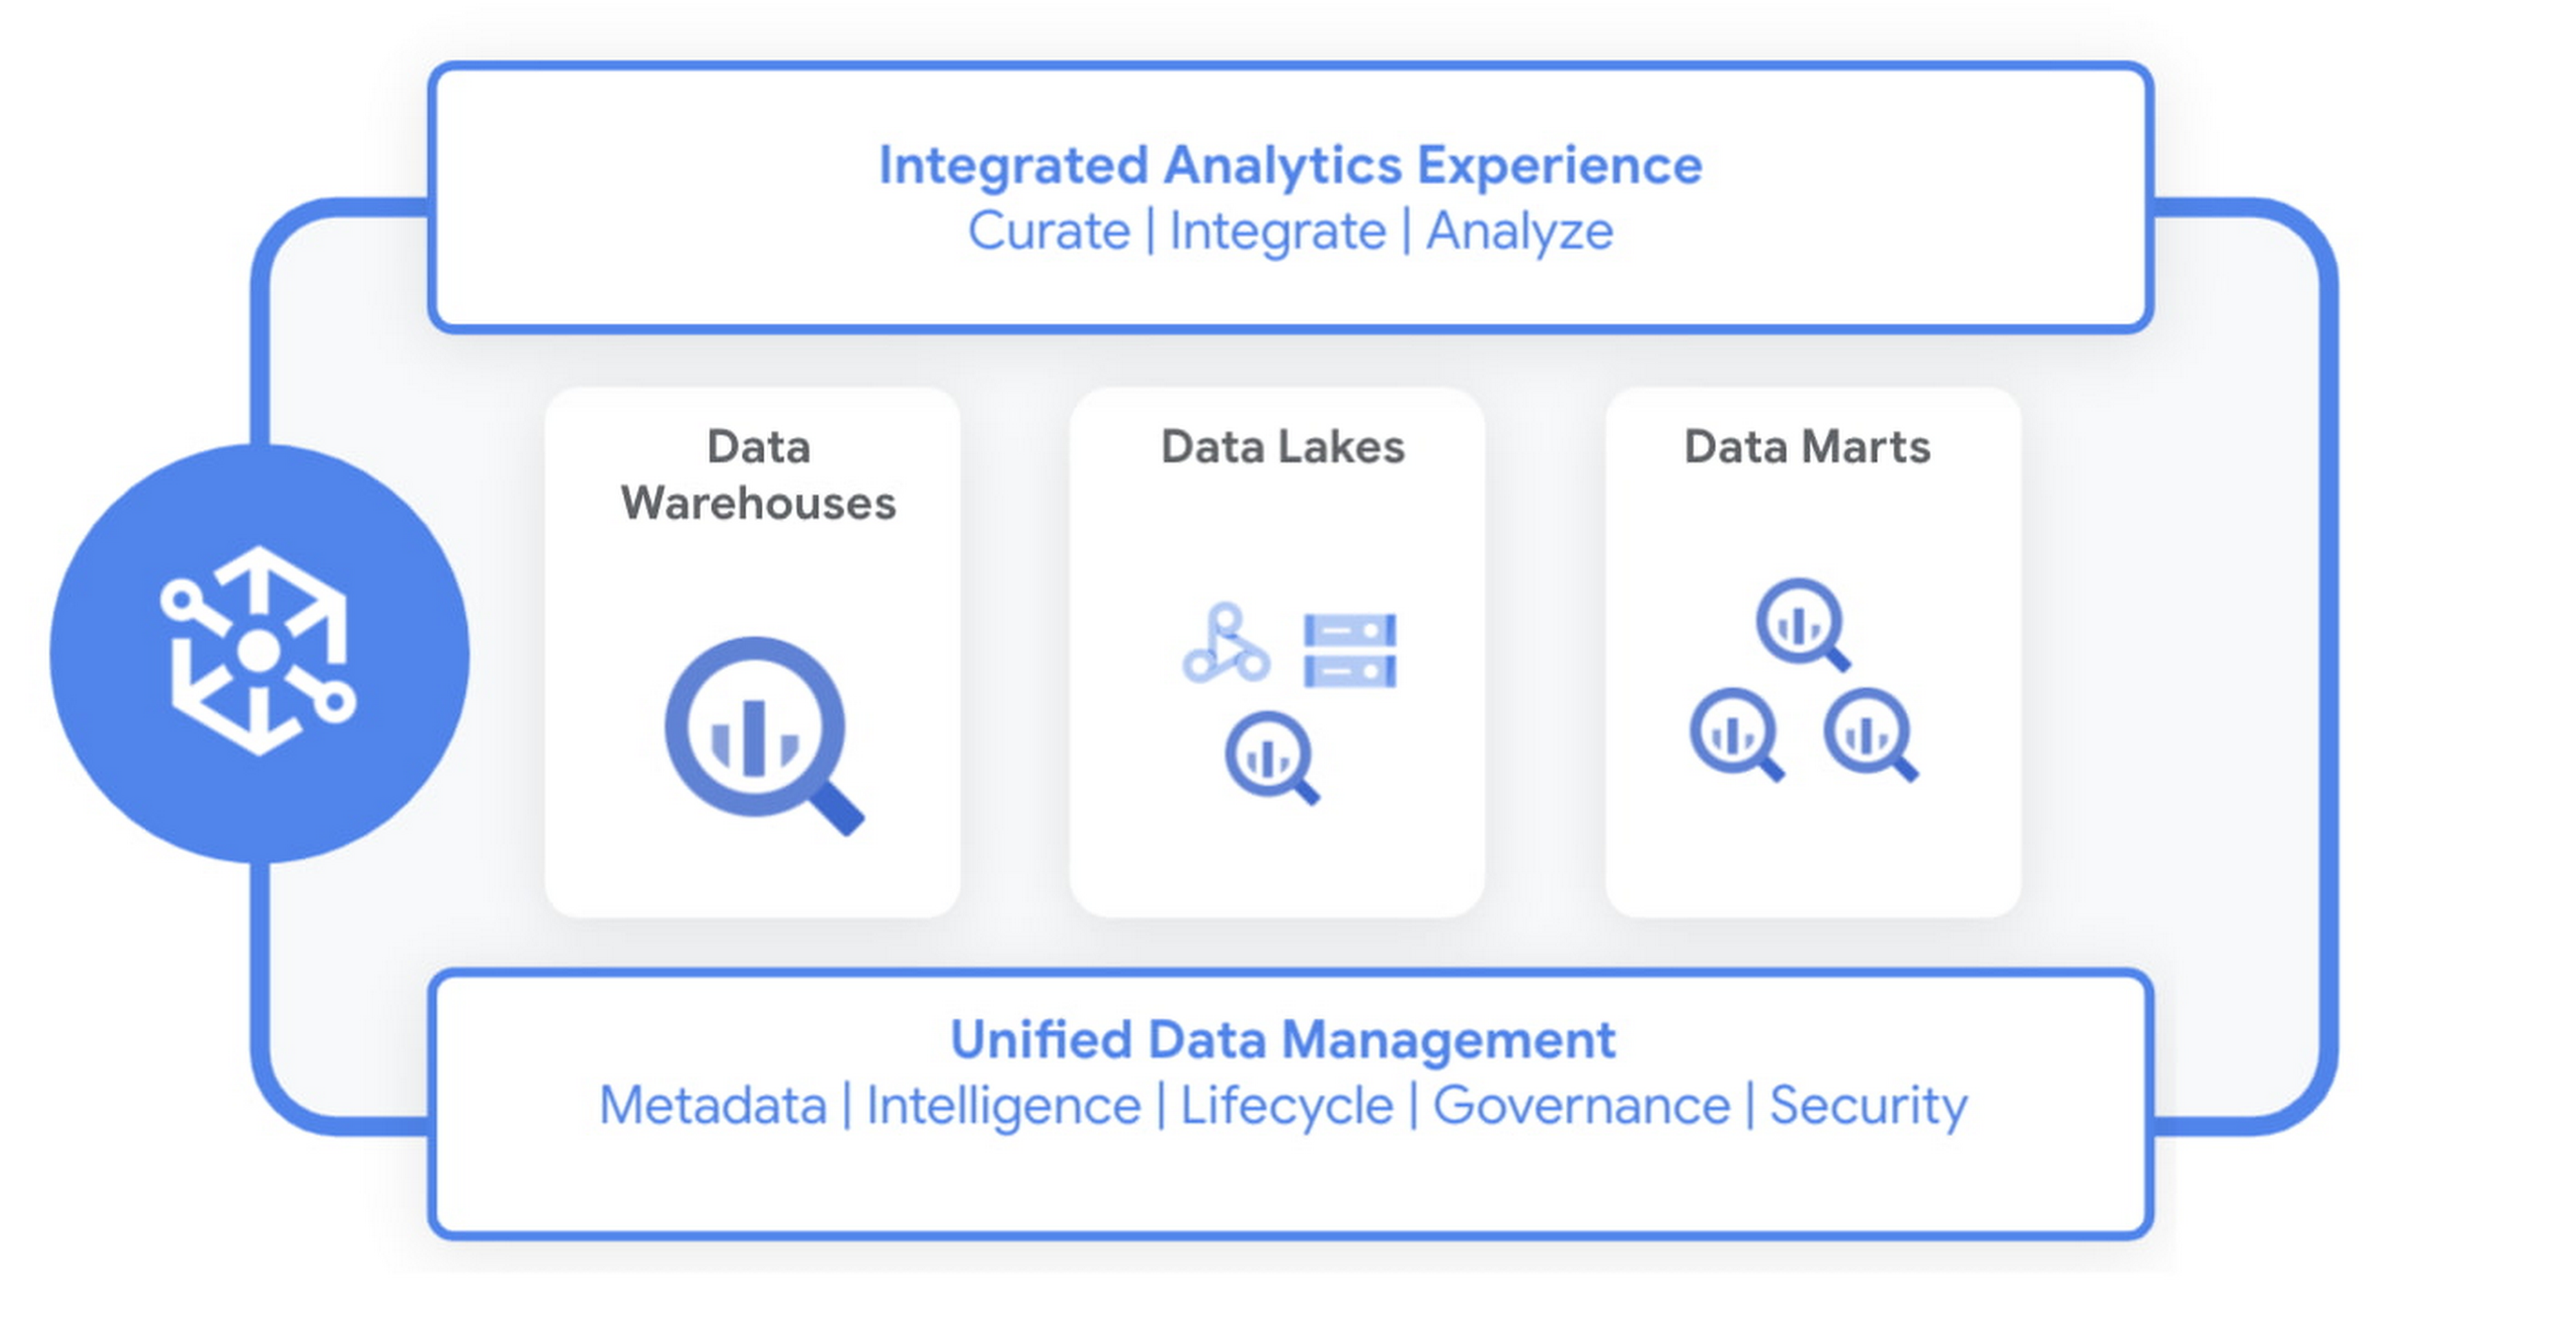
Dataplex enables you to:
- Achieve freedom of choice to store data wherever you want for the right price/performance and choose the best analytics tools for the job, including Google Cloud and open source analytics technologies such as Apache Spark and Presto.
- Enforce consistent controls across your data to ensure unified security and governance
- Take advantage of the built-in data intelligence using Google’s best in class AI/ML capabilities to automate much of the manual toil around data management and get access to higher quality data.
Early customers like Equifax, Loblaw, and ANZ are excited about using Dataplex to address data management complexity.
“Dataplex will greatly simplify the existing analytics workflows within Equifax with its unified data fabric and single interface for policy management and governance across all our analytics data. Its built-in data discovery and data quality features will ensure that our data scientists and analysts always have access to high quality data that they can trust. Dataplex aligns well with our enterprise data strategy and we are excited to partner with Google Cloud on this.”
—Kumar Menon, SVP, Data Fabric & Decision Science Technology, Equifax.
“Loblaw is Canada’s food and pharmacy leader, and we are excited to be an early adopter of Dataplex. We could significantly benefit from Dataplex as it provides a single pane of glass for end-to-end data management and governance. We are particularly interested in improving platform resilience and data quality by detecting anomalies as early as possible in the data pipeline with the help of Dataplex.”
—Elton Martins, Senior Director of Data Insights & Analytics, Loblaw
“We are undergoing a major data transformation at ANZ, bringing together our various data assets and building a cohesive data ecosystem for customer benefit. Dataplex’s vision and capabilities align well with our current data strategy to build a unified data fabric for all our analytics and AI/ML use cases. We are excited to partner with GCP on Dataplex and test the product in private preview.”
—Ashish Shekhar, Head of Technology – Enterprise Analytics & Applied AI, ANZ
Dataplex is built for distributed data. We are starting with data stored in Google Cloud Storage and BigQuery, with support for other data sources coming soon. It provides a workflow-driven experience helping you build an open data platform and make data easily accessible to your end users while ensuring your policies and best practices are consistently enforced.
Organizing and curating your data
One of the core tenets of Dataplex is letting you organize and manage your data in a way that makes sense for your business, without data movement or duplication. For that, we are providing logical constructs like lakes, data zones and assets. Those constructs enable you to abstract away the underlying storage systems and become the foundation for setting policies around data access, security, lifecycle management, and so on.
For example, you can create a lake per department within your organization (Retail, Sales, Finance, etc.) and create data zones that map to data readiness and usage (landing, raw, curated_data_analytics, curated_data_science, etc.).
Once you have your lakes and zones setup, you can now attach data to these zones as assets. You can add data from different types of storage (e.g. GCS Bucket and BigQuery dataset) under the same zone. You can also attach data across multiple projects under the same zone.

You can ingest data into your lakes and zones using the tools of your choice including services such as Dataflow, Data Fusion, Dataproc, Pub/Sub or choose from one of our partner products. Dataplex provides built-in 1-click templates for common data management tasks.
Securing your data
Dataplex enables you to define and enforce consistent policies across your data, irrespective of where it physically resides. Data owners can easily set up policies for specific data domains based on business needs, without thinking about where the data is stored while data stewards get global visibility into governance policies and permissions across their data.
You can apply security and governance policies for your entire lake, a specific zone, or an asset. Dataplex maps the policies to the underlying storage and pushes down permissions to the storage layer to provide end-to-end secure data access. Additionally, you can secure not just data but also related artifacts like notebooks, scripts, and models using the same set of access policies.
Making high quality data available for analytics and data science
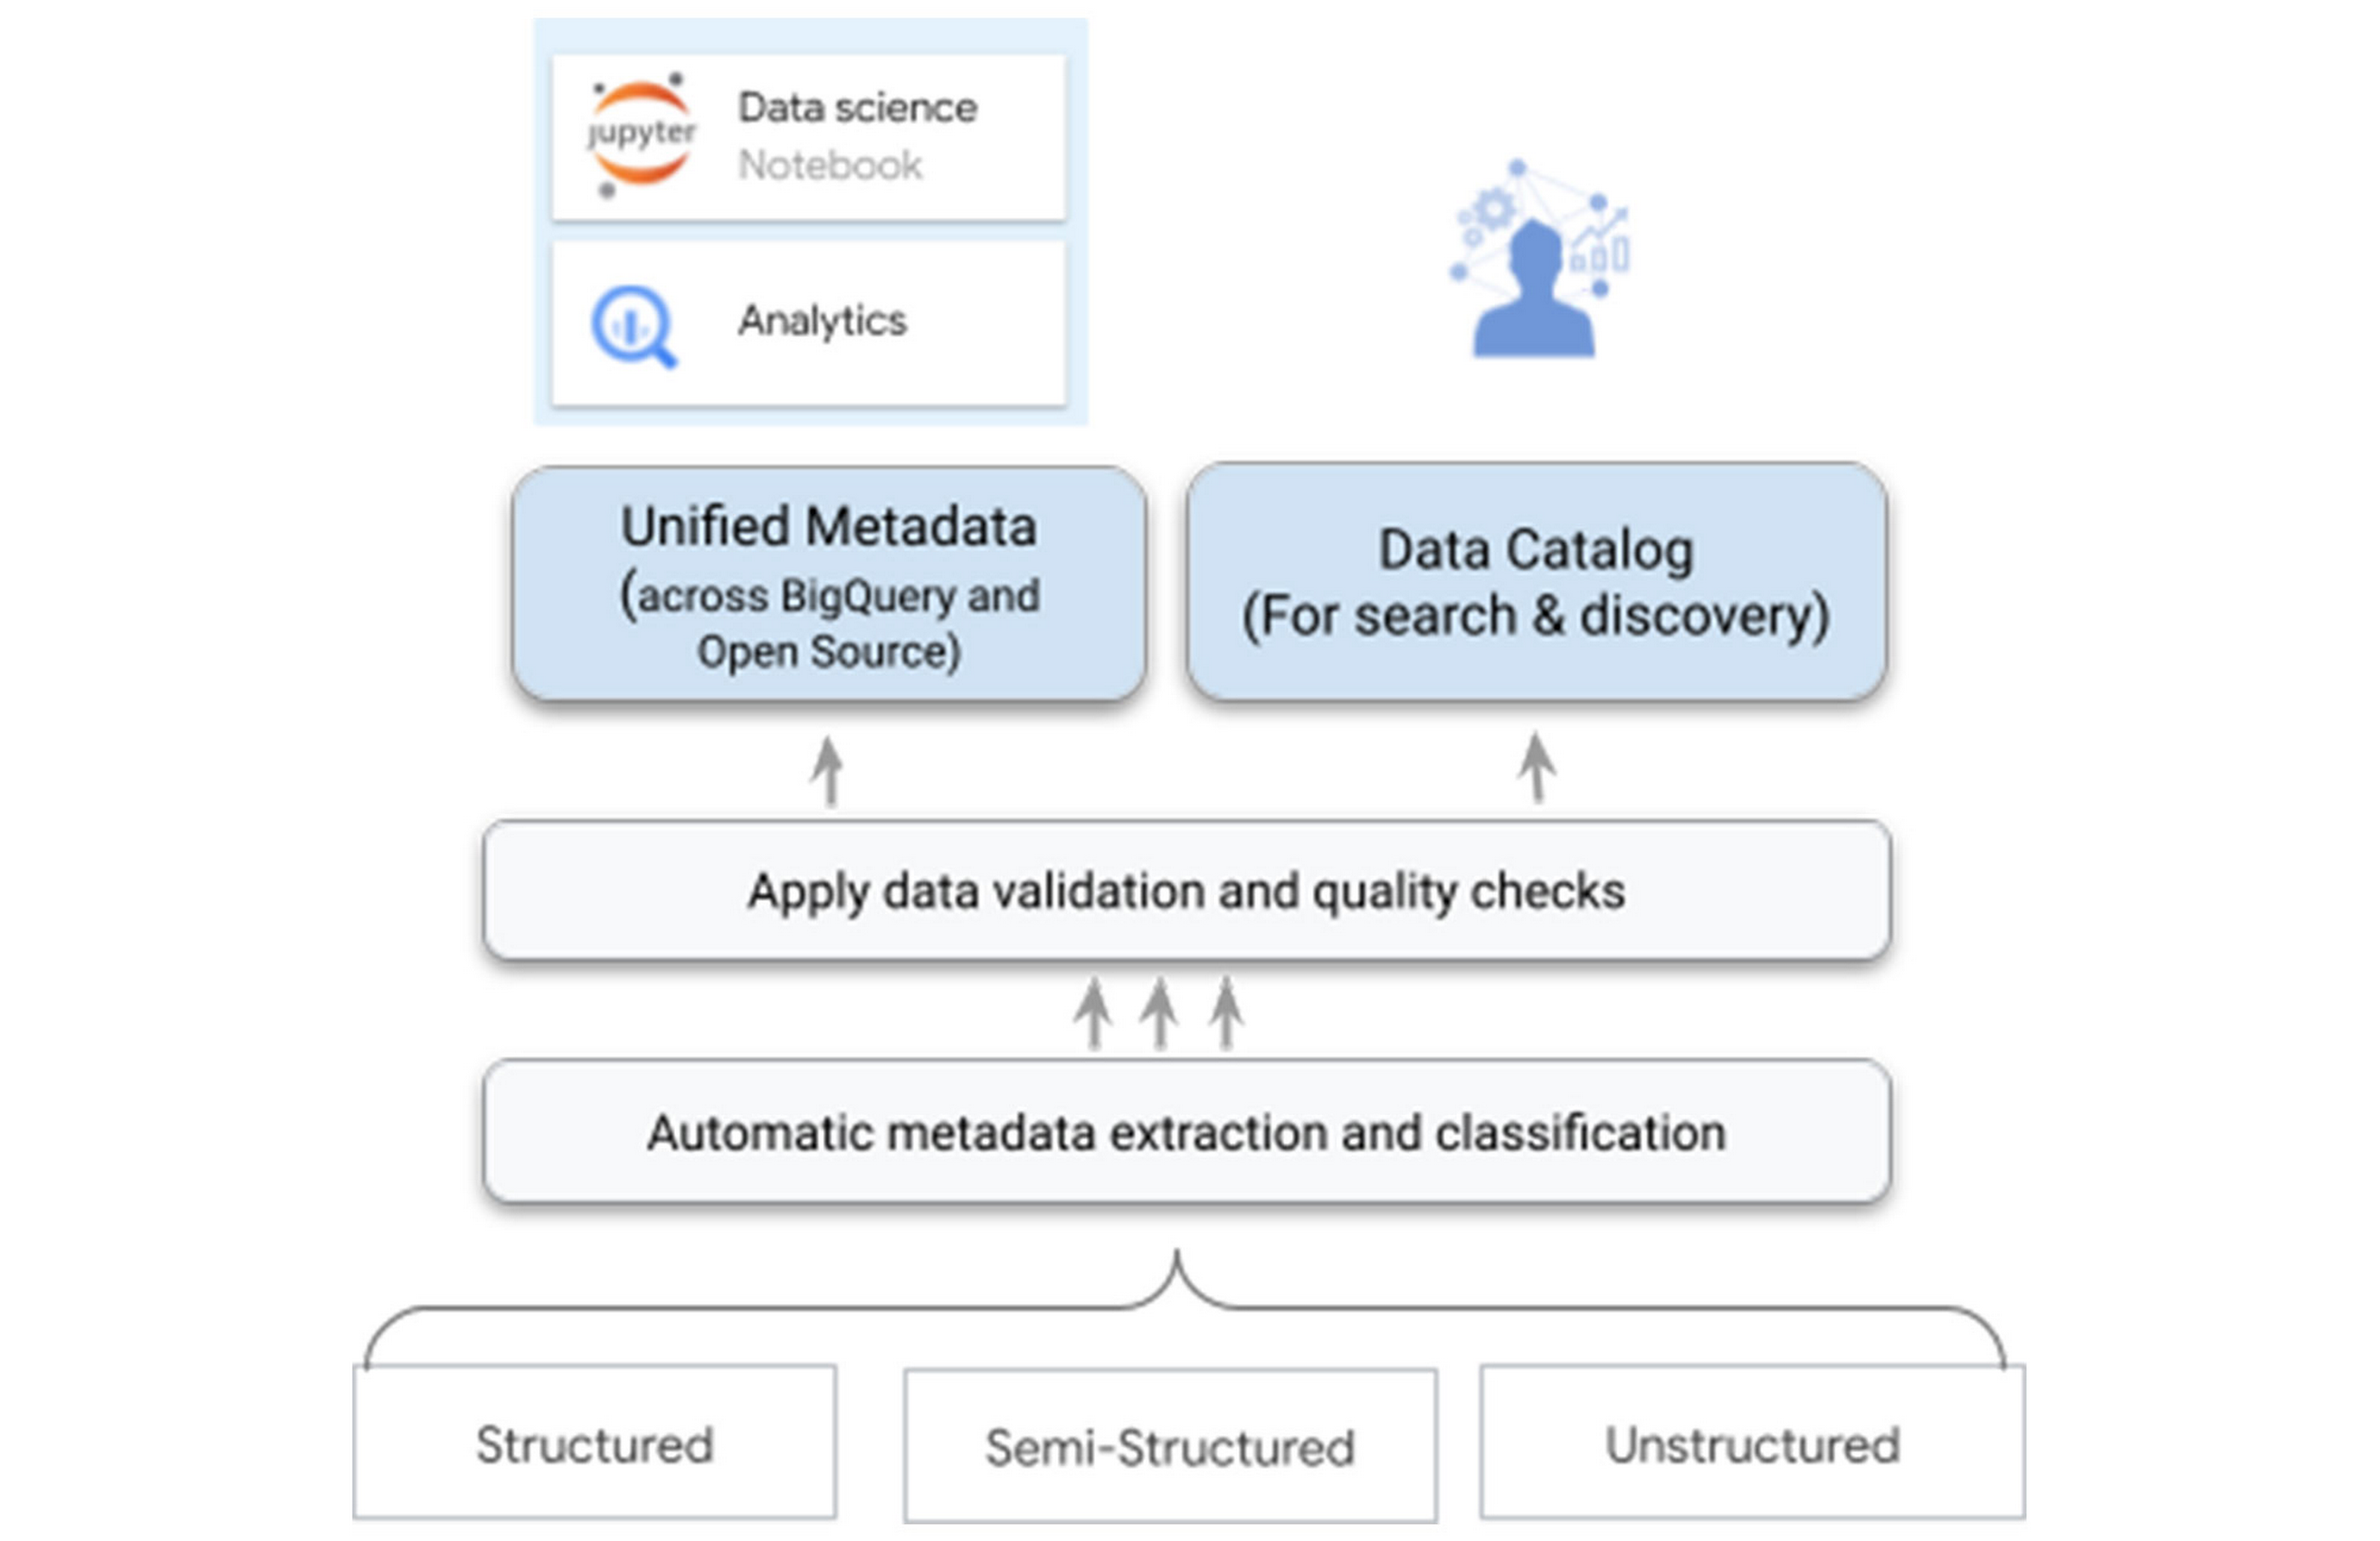
One of the biggest differentiators for Dataplex is our data intelligence capabilities using Google’s best in class AI/ML technologies. As you bring the data under management, Dataplex will automatically harvest the metadata for both structured and unstructured data, with built-in data quality checks. All of the metadata is automatically registered in a unified metastore, and made available for search and discovery. It is also published to Bigquery, Dataproc Metastore, and Data Catalog – ensuring that you have the same consistent data context and access across your tools.
For example, when you write parquet files to a Google Cloud Storage bucket – Dataplex will automatically extract metadata of these files, detect a tabular schema, including hive-style partitions, run data quality checks, and make this data queryable in BigQuery as an external table and from any open source or partner application – with the same consistent security and access policies you defined at the logical data layer.
Your data scientists and analysts now have secured access to this data that meets your quality bar and governance rules via the tools of their choice, without needing any additional processing.
One-click access to collaborative analytics
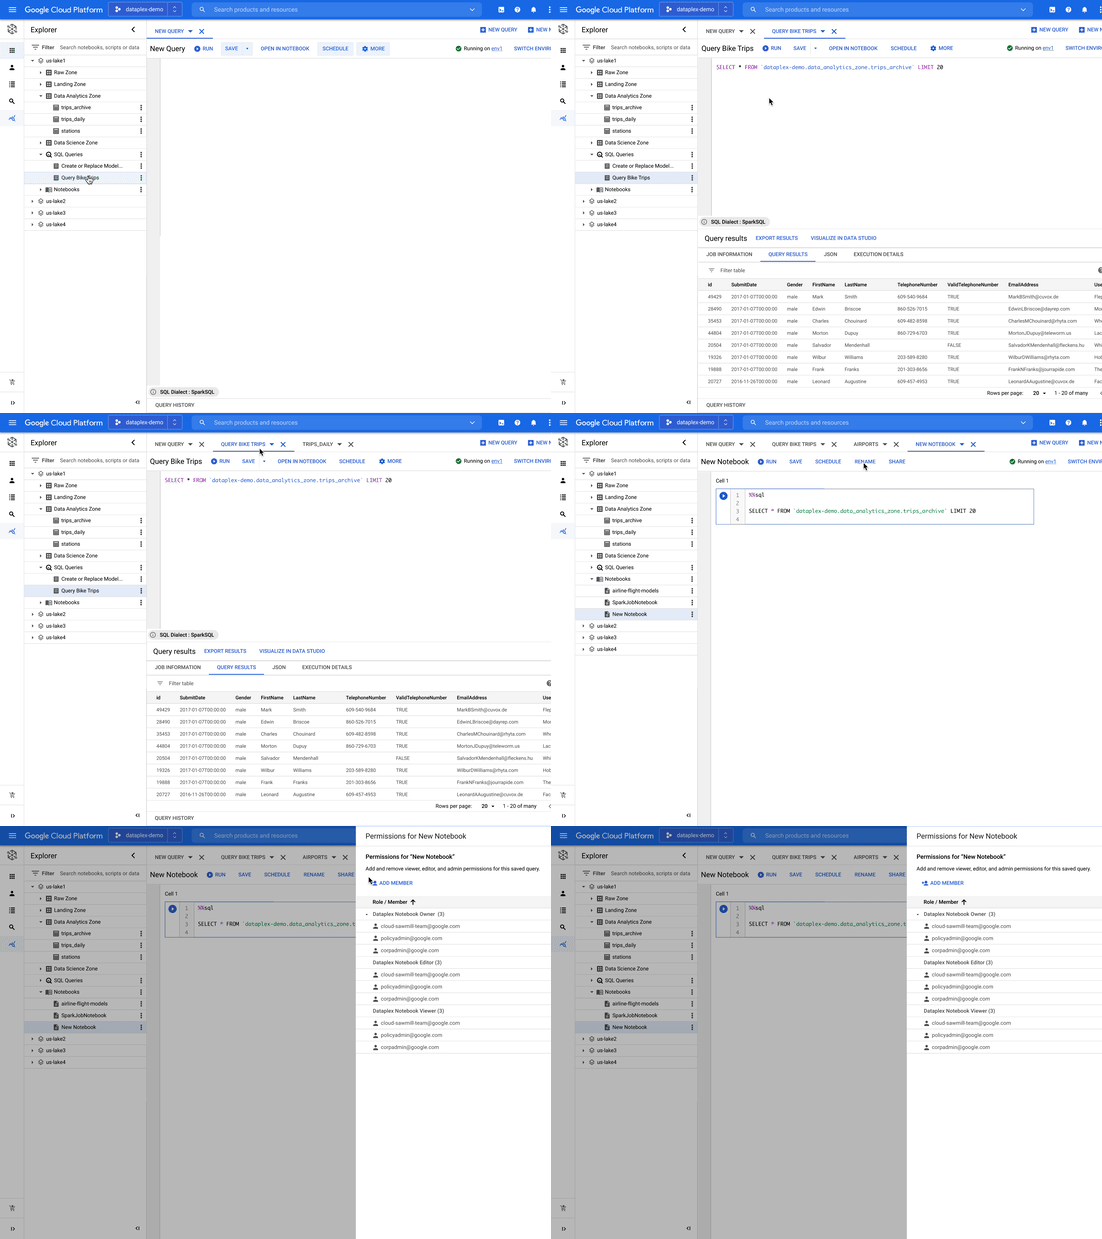
Dataplex provides fully managed, one-click analytics environments enabling you to use the power of Apache Spark and BigQuery with support for other engines coming in the future.
As data administrators, you now have the flexibility to pre-configure these environments with the right cost and financial governance measures without taking on the overhead of managing and maintaining the infrastructure required to power these environments. You can easily configure different environments for different types of workloads and share it with multiple users using their IAM credentials. Dataplex manages the provisioning, monitoring, scaling, and shutdown of these environments.
As data scientists, analysts, and engineers, you now have a turn-key experience to run your analysis using notebooks and a SQL workbench. You can search for notebooks and scripts alongside data, save and share your work with other users, and schedule your notebooks or scripts for recurring workloads – all using the same integrated experience within Dataplex.
Building an open platform with industry leaders
We are partnering with industry leaders such as Accenture, Collibra, Confluent, Informatica, HCL, Starburst, NVIDIA, Trifacta, and others to build an open platform to power analytics at scale. Our partners are excited about the capabilities that Dataplex will provide:
“Collibra is excited to partner with Dataplex to provide data governance and data quality for consistent controls across distributed data. Pairing Collibra’s multi-cloud and hybrid solution with Dataplex allows enterprises to securely open up access to more, higher quality data for users and analytics using a single unified view.”
—Jim Cushman, Chief Product Officer, Collibra
“Dataplex builds on Google Cloud’s commitment to open source by integrating with Apache Kafka®, a leading open source platform for event streaming. We at Confluent, the platform for data in motion that completes Apache Kafka® to be enterprise-ready, are excited to partner with Dataplex to enable customers to bring together distributed, real-time data and build a unified data fabric for end to end analytics.”
—Paul Mac Farland, VP, Head of Customer Solutions and Innovation, Confluent
“We are excited to partner with Google Cloud’s Dataplex team as we look to provide our joint customers an integrated and open data fabric for analytics at scale. Extending Dataplex’s data management and data quality capabilities with Starburst Enterprise will accelerate time to value for enterprises looking to connect distributed data without having to move data.”
—Justin Borgman, CEO and Co-founder, Starburst
Next Steps
Dataplex is now available in preview for a select number of customers. For more information, visit our website or watch the recording. If you would like to sign up, please click here.
How BigQuery’s Unique Features Support Your Data at Petabyte-scale

4784
Of your peers have already read this article.
3:00 Minutes
The most insightful time you'll spend today!
Organizations rely on data warehouses to aggregate data from disparate sources, process it, and make it available for data analysis in support of strategic decision-making. BigQuery is the Google Cloud enterprise data warehouse designed to help organizations to run large scale analytics with ease and quickly unlock actionable insights. You can ingest data into BigQuery either through batch uploading or by streaming data directly to unlock real-time insights. As a fully-managed data warehouse, BigQuery takes care of the infrastructure so you can focus on analyzing your data up to petabyte-scale. BigQuery supports SQL (Structured Query Language), which you’re likely already familiar with if you’ve worked with ANSI-compliant relational databases.
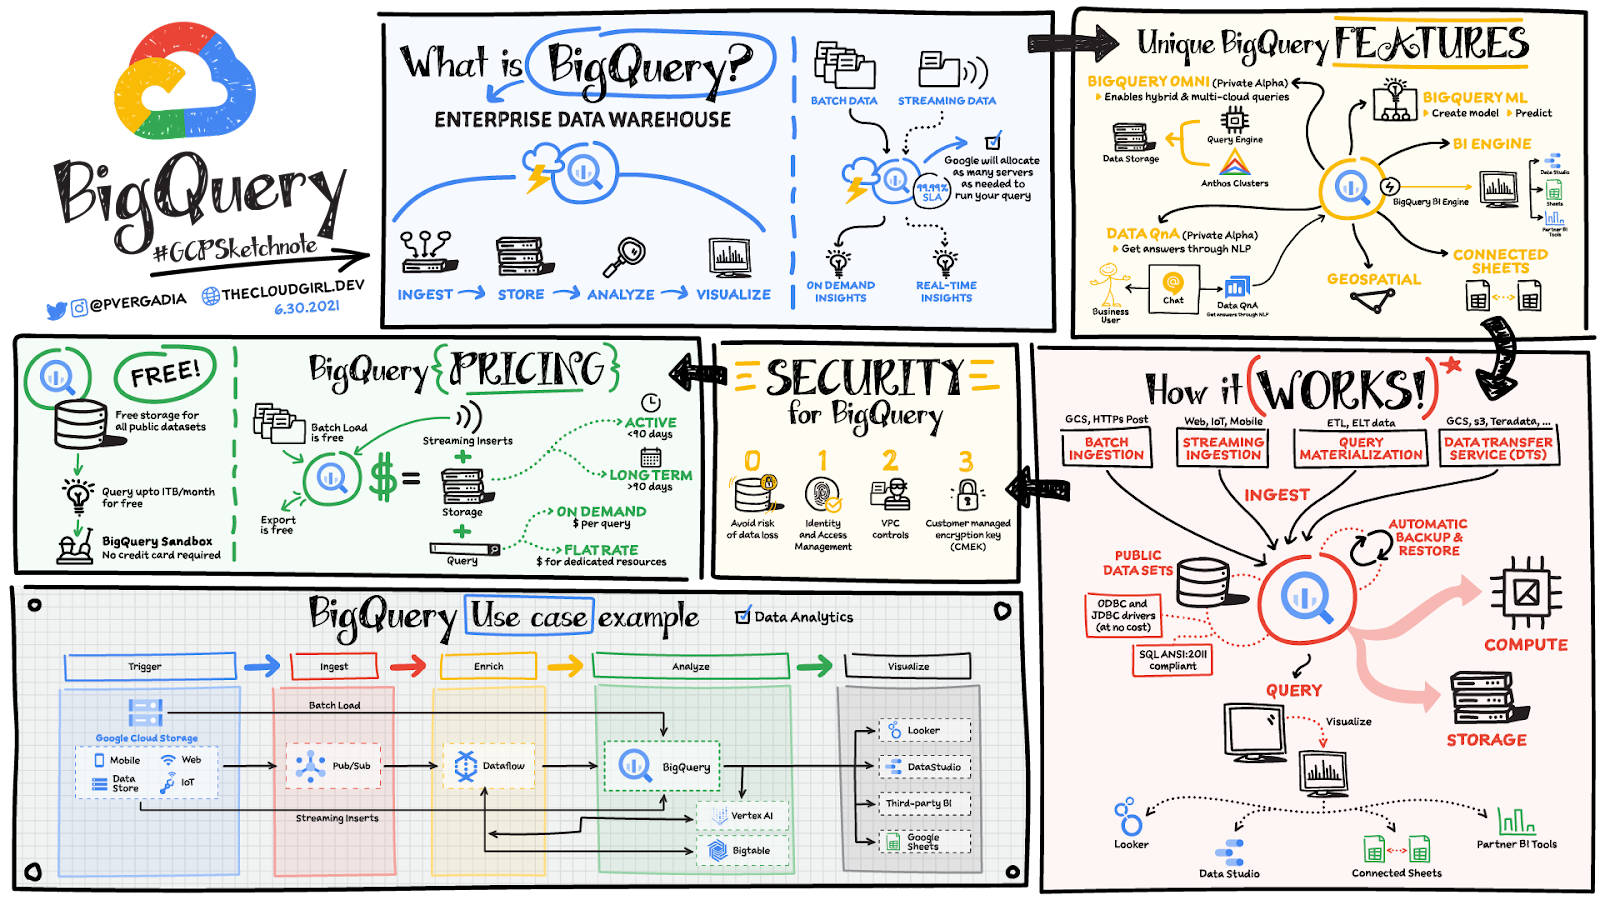
BigQuery unique features
BI Engine – BigQuery BI Engine is a fast, in-memory analysis service that provides subsecond query response times with high concurrency. BI Engine integrates with Google Data Studio and Looker for visualizing query results and enables integration with other popular business intelligence (BI) tools.
BigQuery ML: BigQuery ML is unlocking machine learning for millions of data analysts. It enables data analysts and data scientists to build and operationalize machine learning models directly within BigQuery, using simple SQL.
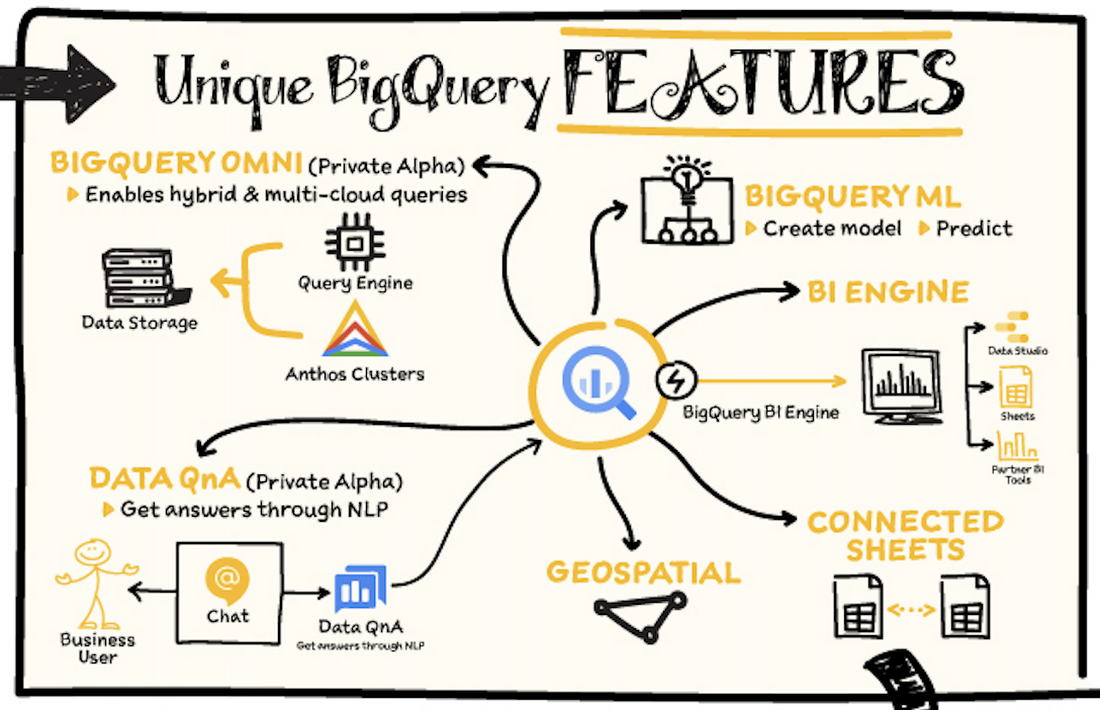
BigQuery Omni – BigQuery Omni is a flexible, multi-cloud analytics solution powered by Anthos that lets you cost-effectively access and securely analyze data across Google Cloud, Amazon Web Services (AWS), and Azure, without leaving the BigQuery user interface (UI). Using standard SQL and familiar BigQuery APIs, you can break down data silos and gain critical business insights from a single pane of glass.
Data QnA: Data QnA enables self-service analytics for business users on BigQuery data as well as federated data from Cloud Storage, Bigtable, Cloud SQL, or Google Drive. It uses Dialogflow and enables users to formulate free-form text analytical questions, with auto-suggested entities while users type a question.
Connected Sheets -The native integration between Sheets and BigQuery makes it possible for all business stakeholders, who are already quite familiar with spreadsheet tools, to get their own up-to-date insights at any time.
Geospatial data – BigQuery offers accurate and scalable geospatial analysis with geography data types. It supports core GIS functions – measurements, transforms, constructors, and more – using standard SQL.
How does it work?
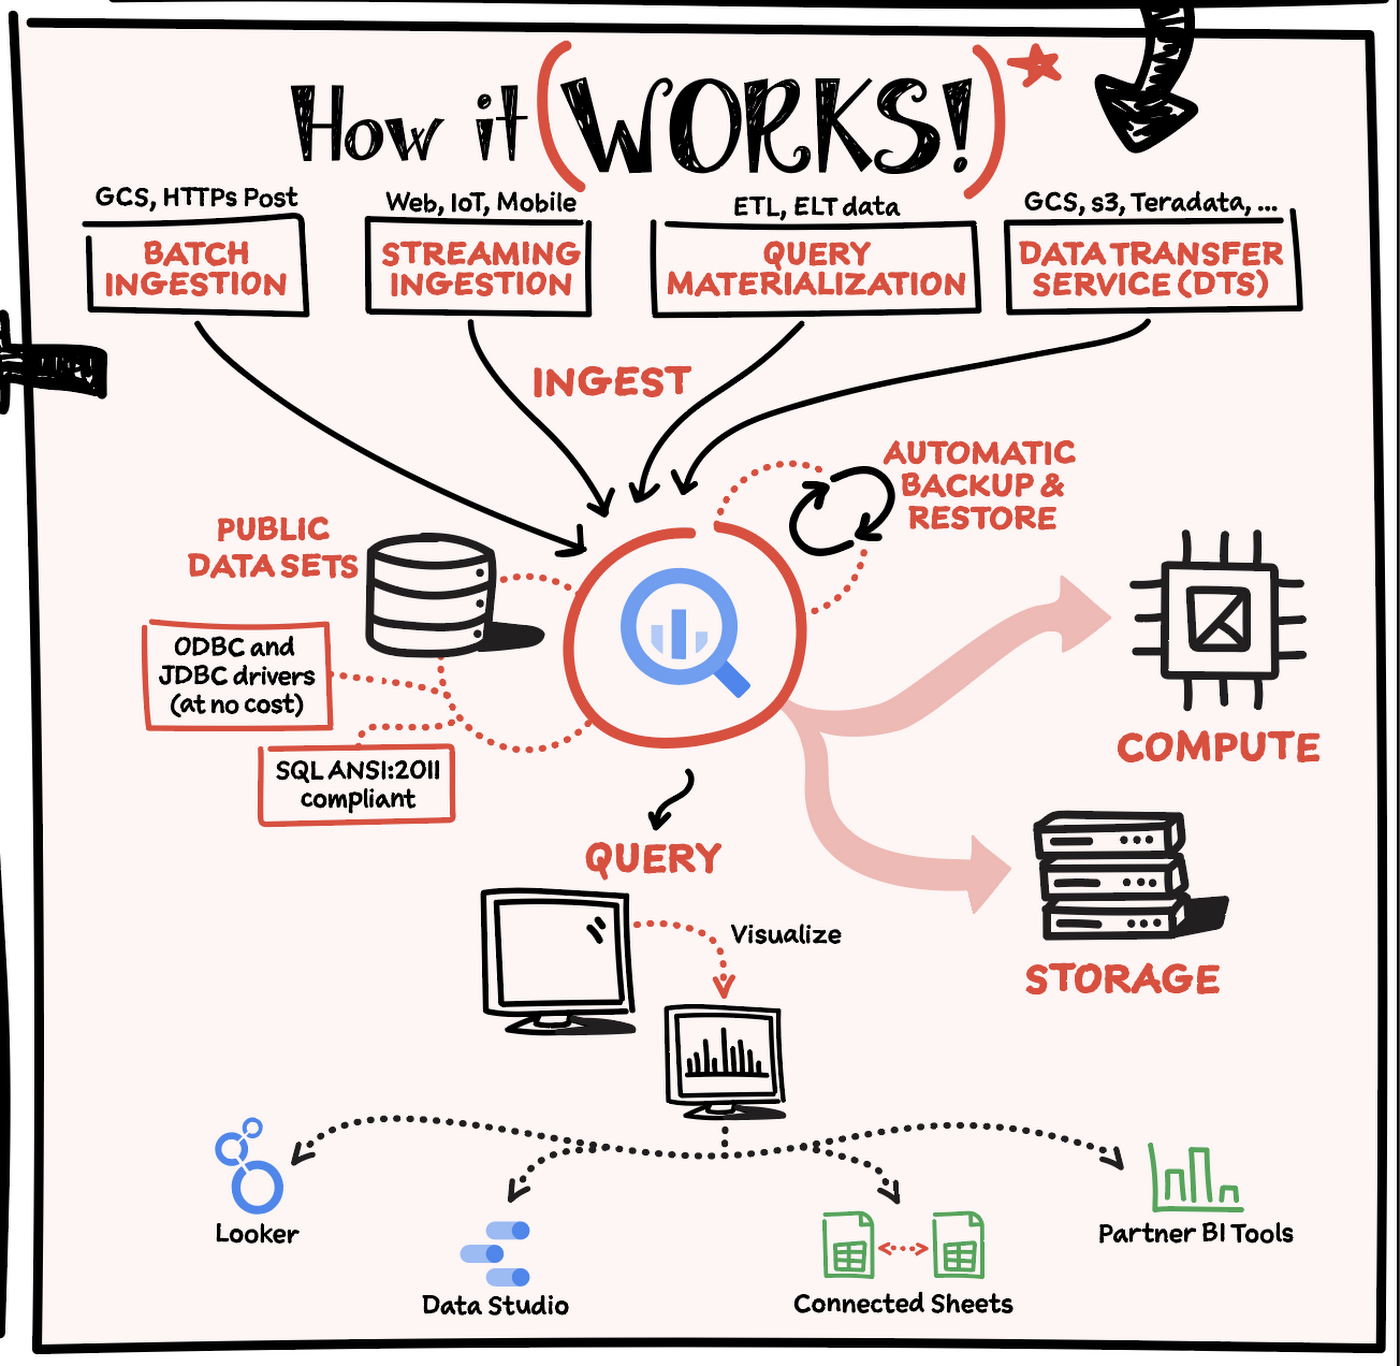
Here’s how it works: You ingest your own data into BigQuery or use data from the public datasets. Storage and compute are decoupled and can scale independently on demand. This offers immense flexibility and cost control for your business as you don’t need to keep expensive compute resources up and running all the time. As a result, BigQuery is much more cost-effective than traditional node-based cloud data warehouse solutions or on-premises systems. BigQuery also provides automatic backup and restore of your data.
You can ingest data into BigQuery in batches or stream real-time data from web, IoT, or mobile devices via Pub/Sub. You can also use Data Transfer Service to ingest data from other clouds, on-premises systems or third-party services. BigQuery also supports ODBC and JDBC drivers to connect with existing tools and infrastructure.
Interacting with BigQuery to load data, run queries, or create ML models can be done in three different ways. You can use the UI in the Cloud Console, the BigQuery command-line tool, or the API via client libraries available in several languages.
When it comes time to visualize your data, BigQuery integrates with Looker as well as several other business intelligence tools across the Google partner ecosystem.
What about security?
BigQuery offers built-in data protection at scale. It provides security and governance tools to efficiently govern data and democratize insights within your organization.
- Within BigQuery, users can assign dataset-level and project-level permissions to help govern data access. Secure data sharing ensures you can collaborate and operate your business with trust.
- Data is automatically encrypted both while in transit and at rest, ensuring that your data is protected from intrusions, theft, and attacks.
- Cloud DLP helps you discover and classify sensitive data assets.
- Cloud IAM provides access control and visibility into security policies.
- Data Catalog helps you discover and manage data.
How much does it cost?
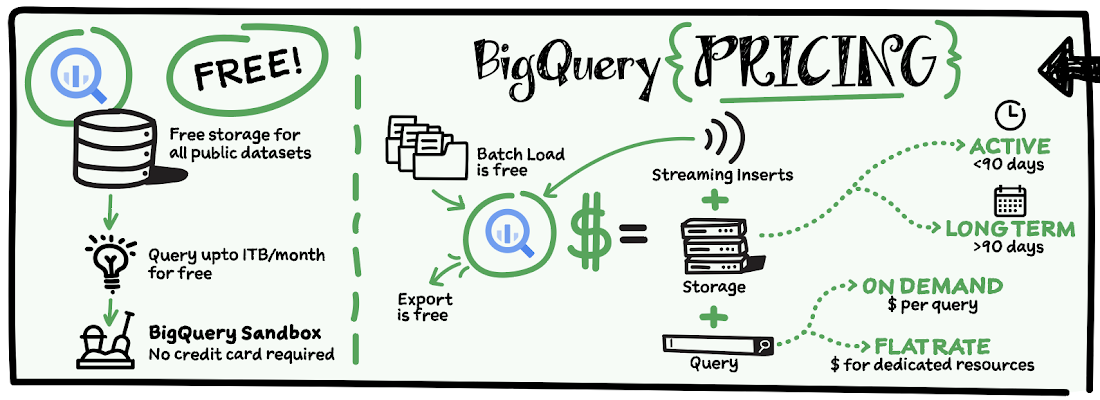
The BigQuery sandbox lets you explore BigQuery capabilities at no cost and confirm that BigQuery fits your needs. With BigQuery you get predictable price-performance: you pay for storing and querying data, and for streaming inserts. Loading and exporting data are free of charge. Storage costs are based on the amount of data stored, and have two rates based on how often the data is changing. Query costs can be either:
- On-demand – you are charged per query by the amount of data processed
- Flat-rate – if you prefer to purchase dedicated resources
You can start with the pay-as-you-go, on-demand option and later move to flat-rate if that better suits your usage. Or, start with flat-rate, get a better understanding of your usage and move to the pay-as-you-go models for additional workloads.
To explore BigQuery and its capabilities a bit more, check out the sandbox; and when you’re ready to modernize your data warehouse with BigQuery then check out the documentation to streamline your migration process here. https://www.youtube.com/embed/So-tVyBQt8E?enablejsapi=1&
For more #GCPSketchnote, follow the GitHub repo. For similar cloud content follow me on Twitter @pvergadia and keep an eye out on thecloudgirl.dev.
Unlock Powerful Insights: Monitor Cloud Expenses with BigQuery’s Data Export

1309
Of your peers have already read this article.
1:30 Minutes
The most insightful time you'll spend today!
TL;DR – Regular file export for Google Cloud billing is going away on May 15th! Try out this interactive tutorial to set up exporting and explore your billing data with BigQuery
You may have seen an email from Google Cloud reminding you to set up billing data export to BigQuery, and letting you know that file export options are going away. More specifically:
Starting May 15, 2023, your daily usage and cost estimates won’t be automatically exported to a Cloud Storage bucket. Your existing Cloud Storage buckets will continue to exist, but no new files will be added on an ongoing basis.
In fact, I even received one of these notifications since I had an old billing account (or two) that still had file export enabled. Even though the file export is going away, exporting your billing data to BigQuery gives you more detail and more capabilities to analyze, so it’s a big upgrade.
Start from the start
While Google Cloud does offer a free trial and free tier of services, it shouldn’t come as a surprise that most cloud services cost money to use. With the unique properties of the cloud, it’s much easier to bill for exact usage of various services, like pay-per-second for virtual machines. However, this can also become an overwhelming amount of information when a large number of services are being used across multiple teams. In order to make sure you understand your billing data, Google Cloud offers that data through direct reporting in the Cloud console, file exports, and exporting to BigQuery.
Most importantly, the file export for Cloud Billing data is going away on May 15th (the file exports for specific reports, like the cost table, aren’t going away). This was an option for billing accounts to generate daily CSV or JSON files into a Cloud Storage bucket so you could download the files and analyze them as needed. While these exports were definitely helpful for looking at your billing data, over time they couldn’t keep up with the complexity and volume of data that comes out of a billing account.
The most important thing to note here is simple: this export option is being deprecated entirely, so if you’re currently using it (and even if you’re not), you should make sure exporting to BigQuery is enabled.
Large data, large queries
Exporting from your billing account into BigQuery has been an option for the past few years, and now more than ever it’s the central option for managing your billing data. Of course, BigQuery is a natural home for large datasets with the scale and granularity of your billing data. In addition to that, exporting to BigQuery also happens more frequently than a daily file export, so you can do cost anomaly detection much faster.
As teams and organizations become larger, it can be increasingly difficult to figure out which groups are responsible for different costs. If your organization is using a chargeback model (where one group pays for all resources and then breaks down cost details for individual teams/groups to be responsible for their usage), then using BigQuery is the best way for you to accurately collect and analyze costs. On top of being able to query directly against your data, BigQuery also makes it much easier to integrate with other tools, like Looker or Looker Studio for visualization.
The actual data being exported to BigQuery are hourly records of every service your billing account is responsible for, along with detailed information like the SKU, what type of unit is being measured, and how many of that unit you’re paying for.
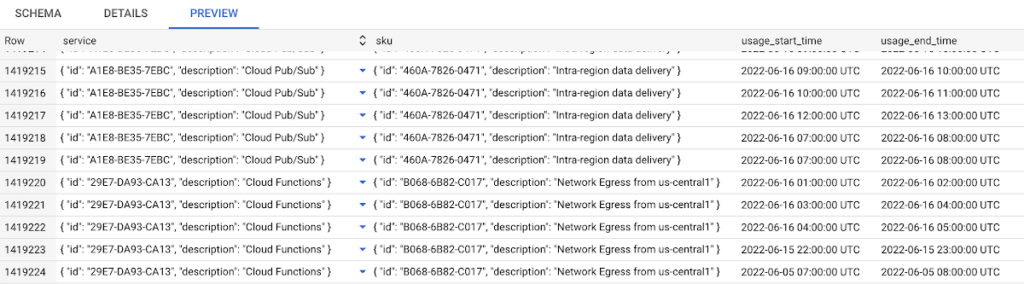
I suspect most folks using the file export (and probably most folks overall) will be fine with the standard export for BigQuery, and can use the detailed cost and pricing options if they need even more details. You can find some more details on all the exports in this blog post.
With the file export going away, it’s also important to mention: exporting your Cloud Billing data to BigQuery starts when you enable it, and doesn’t include older data. So make sure you set yourself up for future success by enabling billing export as soon as possible. Try using our built-in walkthrough to help you enable the export and to get started analyzing the data! You can also read more in the documentation.
How to Enhance Incremental Pipeline Performance while Ingesting Data into BigQuery

6315
Of your peers have already read this article.
3:00 Minutes
The most insightful time you'll spend today!
When you build a data warehouse, the important question is how to ingest data from the source system to the data warehouse. If the table is small you can fully reload a table on a regular basis, however, if the table is large a common technique is to perform incremental table updates. This post demonstrates how you can enhance incremental pipeline performance when you ingest data into BigQuery.
Setting up a standard incremental data ingestion pipeline
We will use the below example to illustrate a common ingestion pipeline that incrementally updates a data warehouse table. Let’s say that you ingest data into BigQuery from a large and frequently updated table in the source system, and you have Staging and Reporting areas (datasets) in BigQuery.

The Reporting area in BigQuery stores the most recent, full data that has been ingested from the source system tables. Usually you create the base table as a full snapshot of the source system table. In our running example, we use BigQuery public data as the source system and create reporting.base_table as shown below. In our example each row is identified by a unique key which consists of two columns: block_hash and log_index.
CREATE TABLE reporting.base_table --156 GB processedPARTITION BY TIMESTAMP_TRUNC(block_timestamp, DAY) ASSELECT log_index, data, topics, block_timestamp, block_hashFROM bigquery-public-data.crypto_ethereum.logsWHERE block_timestamp BETWEEN TIMESTAMP '2020-01-01' AND TIMESTAMP '2020-11-30';
In data warehouses it is common to partition a large base table by a datetime column that has a business meaning. For example, it may be a transaction timestamp, or datetime when some business event happened, etc. The idea is that data analysts who use the data warehouse usually need to analyze only some range of dates and rarely need the full data. In our example, we partition the base table by block_timestamp which comes from the source system.
After ingesting the initial snapshot you need to capture changes that happen in the source system table and update the reporting base table accordingly. This is when the Staging area comes into the picture. The staging table will contain captured data changes that you will merge into the base table. Let’s say that in our source system on a regular basis we have a set of new rows and also some updated records. In our example we mock the staging data as follows: first, we create new data, than we mock the updated records:
CREATE TABLE staging.load_delta AS --5 GB processedSELECT log_index, data, topics, block_timestamp, block_hashFROM bigquery-public-data.crypto_ethereum.logsWHERE block_timestamp BETWEEN TIMESTAMP '2020-12-01' AND TIMESTAMP '2020-12-07';INSERT INTO staging.load_delta --2 GB processedSELECT log_index, CONCAT(data, RAND()), topics, block_timestamp, block_hashFROM bigquery-public-data.crypto_ethereum.logs TABLESAMPLE SYSTEM (5 PERCENT)WHERE block_timestamp BETWEEN TIMESTAMP '2020-10-01' AND TIMESTAMP '2020-11-30';
Next, the pipeline merges the staging data into the base table. It joins two tables by unique key and than updates the changed value or inserts a new row
MERGE INTO reporting.base_table T --161 GB processedUSING staging.load_delta SON T.block_hash = S.block_hashAND T.log_index = S.log_indexWHEN MATCHED THEN UPDATE SETT.data = S.dataWHEN NOT MATCHED THEN INSERT (log_index, data, topics, block_timestamp, block_hash)VALUES (log_index, data, topics, block_timestamp, block_hash);
It is often the case that the staging table contains keys from various partitions but the number of those partitions are relatively small. It holds, for instance, because in the source system the recently added data may get changed due to some initial errors or ongoing processes but older records are rarely updated. However, when the above MERGE gets executed, BigQuery scans all partitions in the base table and processes 161 GB of data. You might add additional join condition on block_timestamp:
MERGE INTO reporting.base_table T --161 GB processedUSING staging.load_delta SON T.block_hash = S.block_hashAND T.log_index = S.log_indexAND T.block_timestamp = S.block_timestampWHEN MATCHED THEN UPDATE SETT.data = S.dataWHEN NOT MATCHED THEN INSERT (log_index, data, topics, block_timestamp, block_hash)VALUES (log_index, data, topics, block_timestamp, block_hash);
But BigQuery would still scan all partitions in the base table because condition T.block_timestamp = S.block_timestamp is a dynamic predicate and BigQuery doesn’t automatically push such predicates down from one table to another in MERGE.
Can you improve the MERGE efficiency by making it scan less data? The answer is Yes.
As described in the MERGE documentation, pruning conditions may be located in a subquery filter, a merge_condition filter, or a search_condition filter. In this post we show how you can leverage the first two. The main idea is to turn a dynamic predicate into a static predicate.
Steps to enhance your ingestion pipeline
The initial step is to compute the range of partitions that will be updated during the MERGE and store it in a variable. As was mentioned above, in data ingestion pipelines, staging tables are usually small so the cost of the computation is relatively low.
DECLARE src_range STRUCT<date_min TIMESTAMP, date_max TIMESTAMP> --115 MB processedDEFAULT(SELECT STRUCT(MIN(block_timestamp) AS date_min,MAX(block_timestamp) AS date_max) FROM staging.load_delta);
Based on your existing ETL/ELT pipeline, you can add the above code as-is to your pipeline or you can compute date_min, data_max as part of some already existing transformation step. Alternatively, date_min, data_max can be computed on the Source System side while capturing the next ingestion data batch.
After computing date_min, date_max you pass those values to the MERGE statement as static predicates. There are several ways to enhance the MERGE and prune partitions in the base table based on precomputed date_min, data_max.
If your initial MERGE statement uses a subquery, you can incorporate a new filter into it:
BEGINDECLARE src_range STRUCT<date_min TIMESTAMP, date_max TIMESTAMP> --115 MB processedDEFAULT(SELECT STRUCT(MIN(block_timestamp) AS date_min,MAX(block_timestamp) AS date_max) FROM staging.load_delta);MERGE INTO reporting.base_table T --41 GB processedUSING (SELECT *FROM staging.load_deltaWHERE block_timestamp BETWEEN src_range.date_min AND src_range.date_max) SON T.block_hash = S.block_hashAND T.log_index = S.log_indexAND T.block_timestamp = S.block_timestampWHEN MATCHED THEN UPDATE SETT.data = S.dataWHEN NOT MATCHED THEN INSERT (log_index, data, topics, block_timestamp, block_hash)VALUES (log_index, data, topics, block_timestamp, block_hash);END;
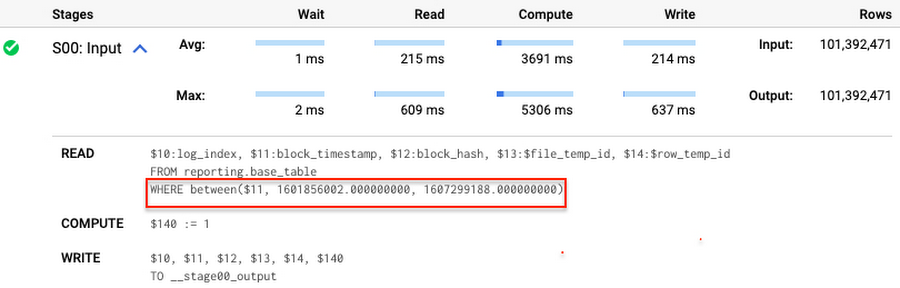
Note that you add the static filter to the staging table and keep T.block_timestamp = S.block_timestamp to convey to BigQuery that it can push that filter to the base table. This MERGE processes 41 GB of data in contrast to the initial 161 GB. You can see in the query plan that BigQuery pushes the partition filter from the staging table to the base table:
This type of optimization, when a pruning condition is pushed from a subquery to a large partitioned or clustered table, is not unique for MERGE. It also works for other types of queries. For instance:
SELECT * -- 41 GB processedFROM reporting.base_table TINNER JOIN staging.load_delta SON T.block_hash = S.block_hashAND T.log_index = S.log_indexAND T.block_timestamp = S.block_timestampWHERE S.block_timestamp BETWEEN TIMESTAMP '2020-10-05' AND TIMESTAMP '2020-12-07'
And you can check the query plan to verify that BigQuery pushed down the partition filter from one table to another.
Moreover, for SELECT statements, BigQuery can automatically infer a filter predicate on a join column and push it down from one table to another if your query meets the following criteria:
- The target table must be clustered or partitioned.
- The result size of the other table, i.e. after applying all filters, must qualify for broadcast join. Namly, the result set must be relatively small, less than ~100MB.
In our running example, reporting.base_table is partitioned by block_timestamp. If you define a selective filter on staging.load_delta and join two tables, you can see an inferred filter on the join key pushed to the target table
SELECT *FROM reporting.base_table TINNER JOIN staging.load_delta SON T.block_timestamp = S.block_timestampWHERE S.block_hash = '0x0c1caa16b34d94843aabfebc0d5a961db358135988f7498a6fdc450ad55f0870'
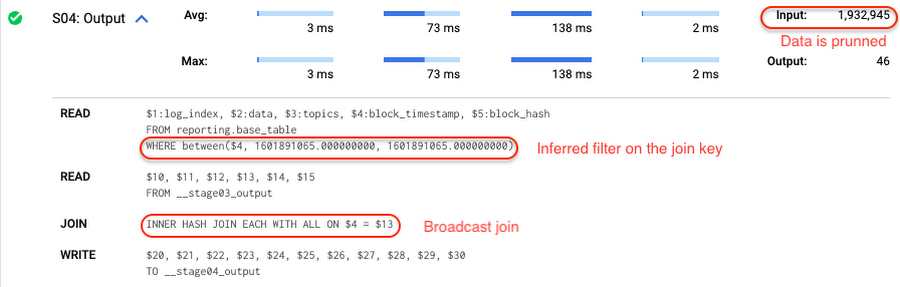
There is no requirement to join tables by partitioning or clustering key to kick off this type of optimization. However, in this case the pruning effect on the target table would be less significant.
But let us get back to the pipeline optimizations. Another way to enhance MERGE is to modify the merge_condition filter by adding static predicate on the base table:
BEGINDECLARE src_range STRUCT<date_min TIMESTAMP, date_max TIMESTAMP> --115 MB processedDEFAULT(SELECT STRUCT(MIN(block_timestamp) AS date_min,MAX(block_timestamp) AS date_max) FROM staging.load_delta);MERGE INTO reporting.base_table T --41 GB processedUSING staging.load_delta SON T.block_hash = S.block_hashAND T.log_index = S.log_indexAND T.block_timestamp BETWEEN src_range.date_min AND src_range.date_maxWHEN MATCHED THEN UPDATE SETT.data = S.dataWHEN NOT MATCHED THEN INSERT (log_index, data, topics, block_timestamp, block_hash)VALUES (log_index, data, topics, block_timestamp, block_hash);END;
To summarize, here are the steps that you can perform to enhance incremental ingestion pipelines in BigQuery. First you compute the range of updated partitions based on the small staging table. Next, you tweak the MERGE statement a bit to let BigQuery know to prune data in the base table.
All the enhanced MERGE statements scanned 41 GB of data, and setting up the src_range variable took 115 MB. Compare it with the initial 161 GB scan. Moreover, given that computing src_range may be incorporated into some existing transformation in your ETL/ELT, it results in a good performance improvement which you can leverage in your pipelines.
In this post we described how to enhance data ingestion pipelines by turning dynamic filter predicates into static predicates and letting BiQuery prune data for us. You can find more tips on BigQuery DML tuning here.
Special thanks to Daniel De Leo, who helped with examples and provided valuable feedback on this content.
More Relevant Stories for Your Company

Meesho’s Zero Downtime Success: Cloud CDN Migration Made Easy
Meesho is an Indian online marketplace that serves millions of customers every day. Recently, the company decided to adopt a multi-cloud strategy, leveraging Google Cloud’s scalable and reliable infrastructure to drive operational efficiency, modernize and scale for growth. To do so, they needed to migrate billions of static files and images
Data Warehouse Migration Challenges and How to Meet Them
In the last blog post, we discussed why legacy data warehouses are not cutting it any more and why organizations are moving their data warehouses to cloud. At GCP, we often hear that customers feel that migration is an uphill battle because the migration strategy was not deliberately considered. Migrating to

Data Culture Integral for Building Data Platforms in EdTech Firms
With a data strategy and data warehouse in place, EdTechs are building a data culture that helps everyone - from educators and administrators, to employees in marketing and accounting - make more informed decisions with their data. So how do you build a data culture in your organization? It starts

5 Best Practices for Cloud Cost Optimization
When customers migrate to Google Cloud Platform (GCP), their first step is often to adopt Compute Engine, which makes it easy to procure and set up virtual machines (VMs) in the cloud that provide large amounts of computing power. Launched in 2012, Compute Engine offers multiple machine types, many innovative features, and is available in
