





Rebel Foods Improves Accuracy of Forecast Time by 60% by Using Google Cloud

5311
Of your peers have already read this article.
1:30 Minutes
The most insightful time you'll spend today!
Google Cloud Results
- Enables accurate allocation of marketing spend to underserved areas
- Supports expansion into international markets
- Helps ensure accurate forecasting of inventory levels
- Improves accuracy of forecasted delivery times by at least 60%
Operating in India since 2011, Rebel Foods has grown from a brick-and-mortar business that provided wraps to customers to a cloud kitchen that delivers cuisine to about one million consumers per month. “We started with the Faasos food brand and now we have scaled up to 10 brands,” says Soumyadeep Barman, Chief Technology Officer at Rebel Foods. “We have doubled our revenue every year from 2014 until now, and we operate kitchens in 15 cities across India. Each kitchen offers at least seven of our brands to customers.”
Barman attributes Rebel Foods’ success to the fact that it is a full stack company. “We procure, we have our own inventory, we prepare the food, we deliver the food to customers, and we make sure customers are delighted every time they order,” he says.
The rapid emergence and adoption of mobile technologies and services in India gave the business its opportunity to expand quickly. “The boom in applications and the web really got going in India in about 2014,” Barman says. “The subsequent emergence of smart devices and mobile applications opened up new markets, including older people who had not really used a computer until then.”
The business released the first iteration of its mobile application in 2013 on servers in an on-premises data center. “However, we experienced breakages because our infrastructure was not scalable or dependable enough, and we decided to move to another solution,” Barman says.
Google Maps Platform delivers opportunity
In 2014, Rebel Foods decided to move to the cloud and selected Google Cloud because of its stability, reliability, and scalability.
The business also wanted to take advantage of the opportunities Google Maps Platform presented to improve the efficiency and effectiveness of its delivery service. With 175 kitchens delivering to about 900 locations across India, Rebel Foods needs to provide estimated delivery times and meet delivery guarantees, while accounting for all the factors that might affect how quickly a rider can reach a customer’s doorstep.
The business turned to Google Maps Platform Premier Partner Searce for support in leveraging Google Maps Platform APIs to deliver a compelling customer experience and improve its efficiency. “Searce helped us determine the Google Maps Platform APIs we should use across our mobile applications and websites, and how many licenses we needed to conduct activities like calculating estimated delivery time and reviewing order heat maps,” Barman says. “Thanks to the firm’s support, Google Maps Platform APIs were a game changer for us.”
Mapping customer locations
Customers accurately pinpoint their location in a map through functionality made available through the Places API and Geocoding API, in conjunction with the JavaScript API. Drivers use the Directions API to identify the quickest route to customers.
Customers can also track the progress of delivery and estimated time of arrival using an Android or iOS application, or the brand websites.
Deploying Google Maps Platform APIs enabled Rebel Foods to improve by up to 60 percent the accuracy of forecasted delivery times. “Rather than tell a customer we can reach them in, say, 45 minutes, based on previous experience and gut feeling, we can retrieve an accurate traffic scenario and calculate delivery times based on traffic congestion levels and likely average speeds,” Barman says
Allocating budget effectively
Google Maps Platform also allows the business to combine mapping of customers to individual kitchens and to how often customers place orders – and for what value. This enabled the business to understand where to allocate budget for local marketing to stimulate demand in underserved areas.
Google Maps Platform technologies complement Rebel Foods’ use of Google Cloud Platform services such as the BigQuery analytics data warehouse to process data used to forecast inventory levels and provide recommendations to customers based on previous usage and behaviors. The business also runs its key applications in Kubernetes Engine to achieve cost-effective scalability, so it can expand to international markets.
“We are targeting growth into a range of international markets in January 2019, including Australia, the Middle East, and Southeast Asia,” Barman says. “With the user data and experience provided by Google Maps Platform in particular, we are poised for success.”
Download the Forrester Study to Explore the Benefits of AI for IT Operations in Cloud Environment

7098
Of your peers have already read this article.
1:30 Minutes
The most insightful time you'll spend today!
Organizations are currently modernizing their businesses in order to meet the increasing complexity of today’s business landscape. In effect, business leaders must evaluate the best way to mitigate the challenges which plague their cloud operations, all while meeting customers’ growing expectations around digital experience (DX) through agility, automation, and proactive incident avoidance.
In this commissioned study, “Modernize With AIOps To Maximize Your Impact”, Forrester Consulting surveyed organizations worldwide to better understand how they’re approaching artificial intelligence for IT operations (AIOps) in their cloud environments, and what kind of benefits they’re seeing.
Within this July 2021 study, you’ll see that AIOps systems and principles are here to help. It covers how AIOps increases efficiency and productivity across day-to-day operations, and how businesses are taking note. In fact, 91% of respondents have implemented AIOps to address at least one cloud operations issue, and expansion is set to skyrocket. Those that wait to act, risk losing out on the efficacy of their cloud investment and falling behind their more efficient competitors.
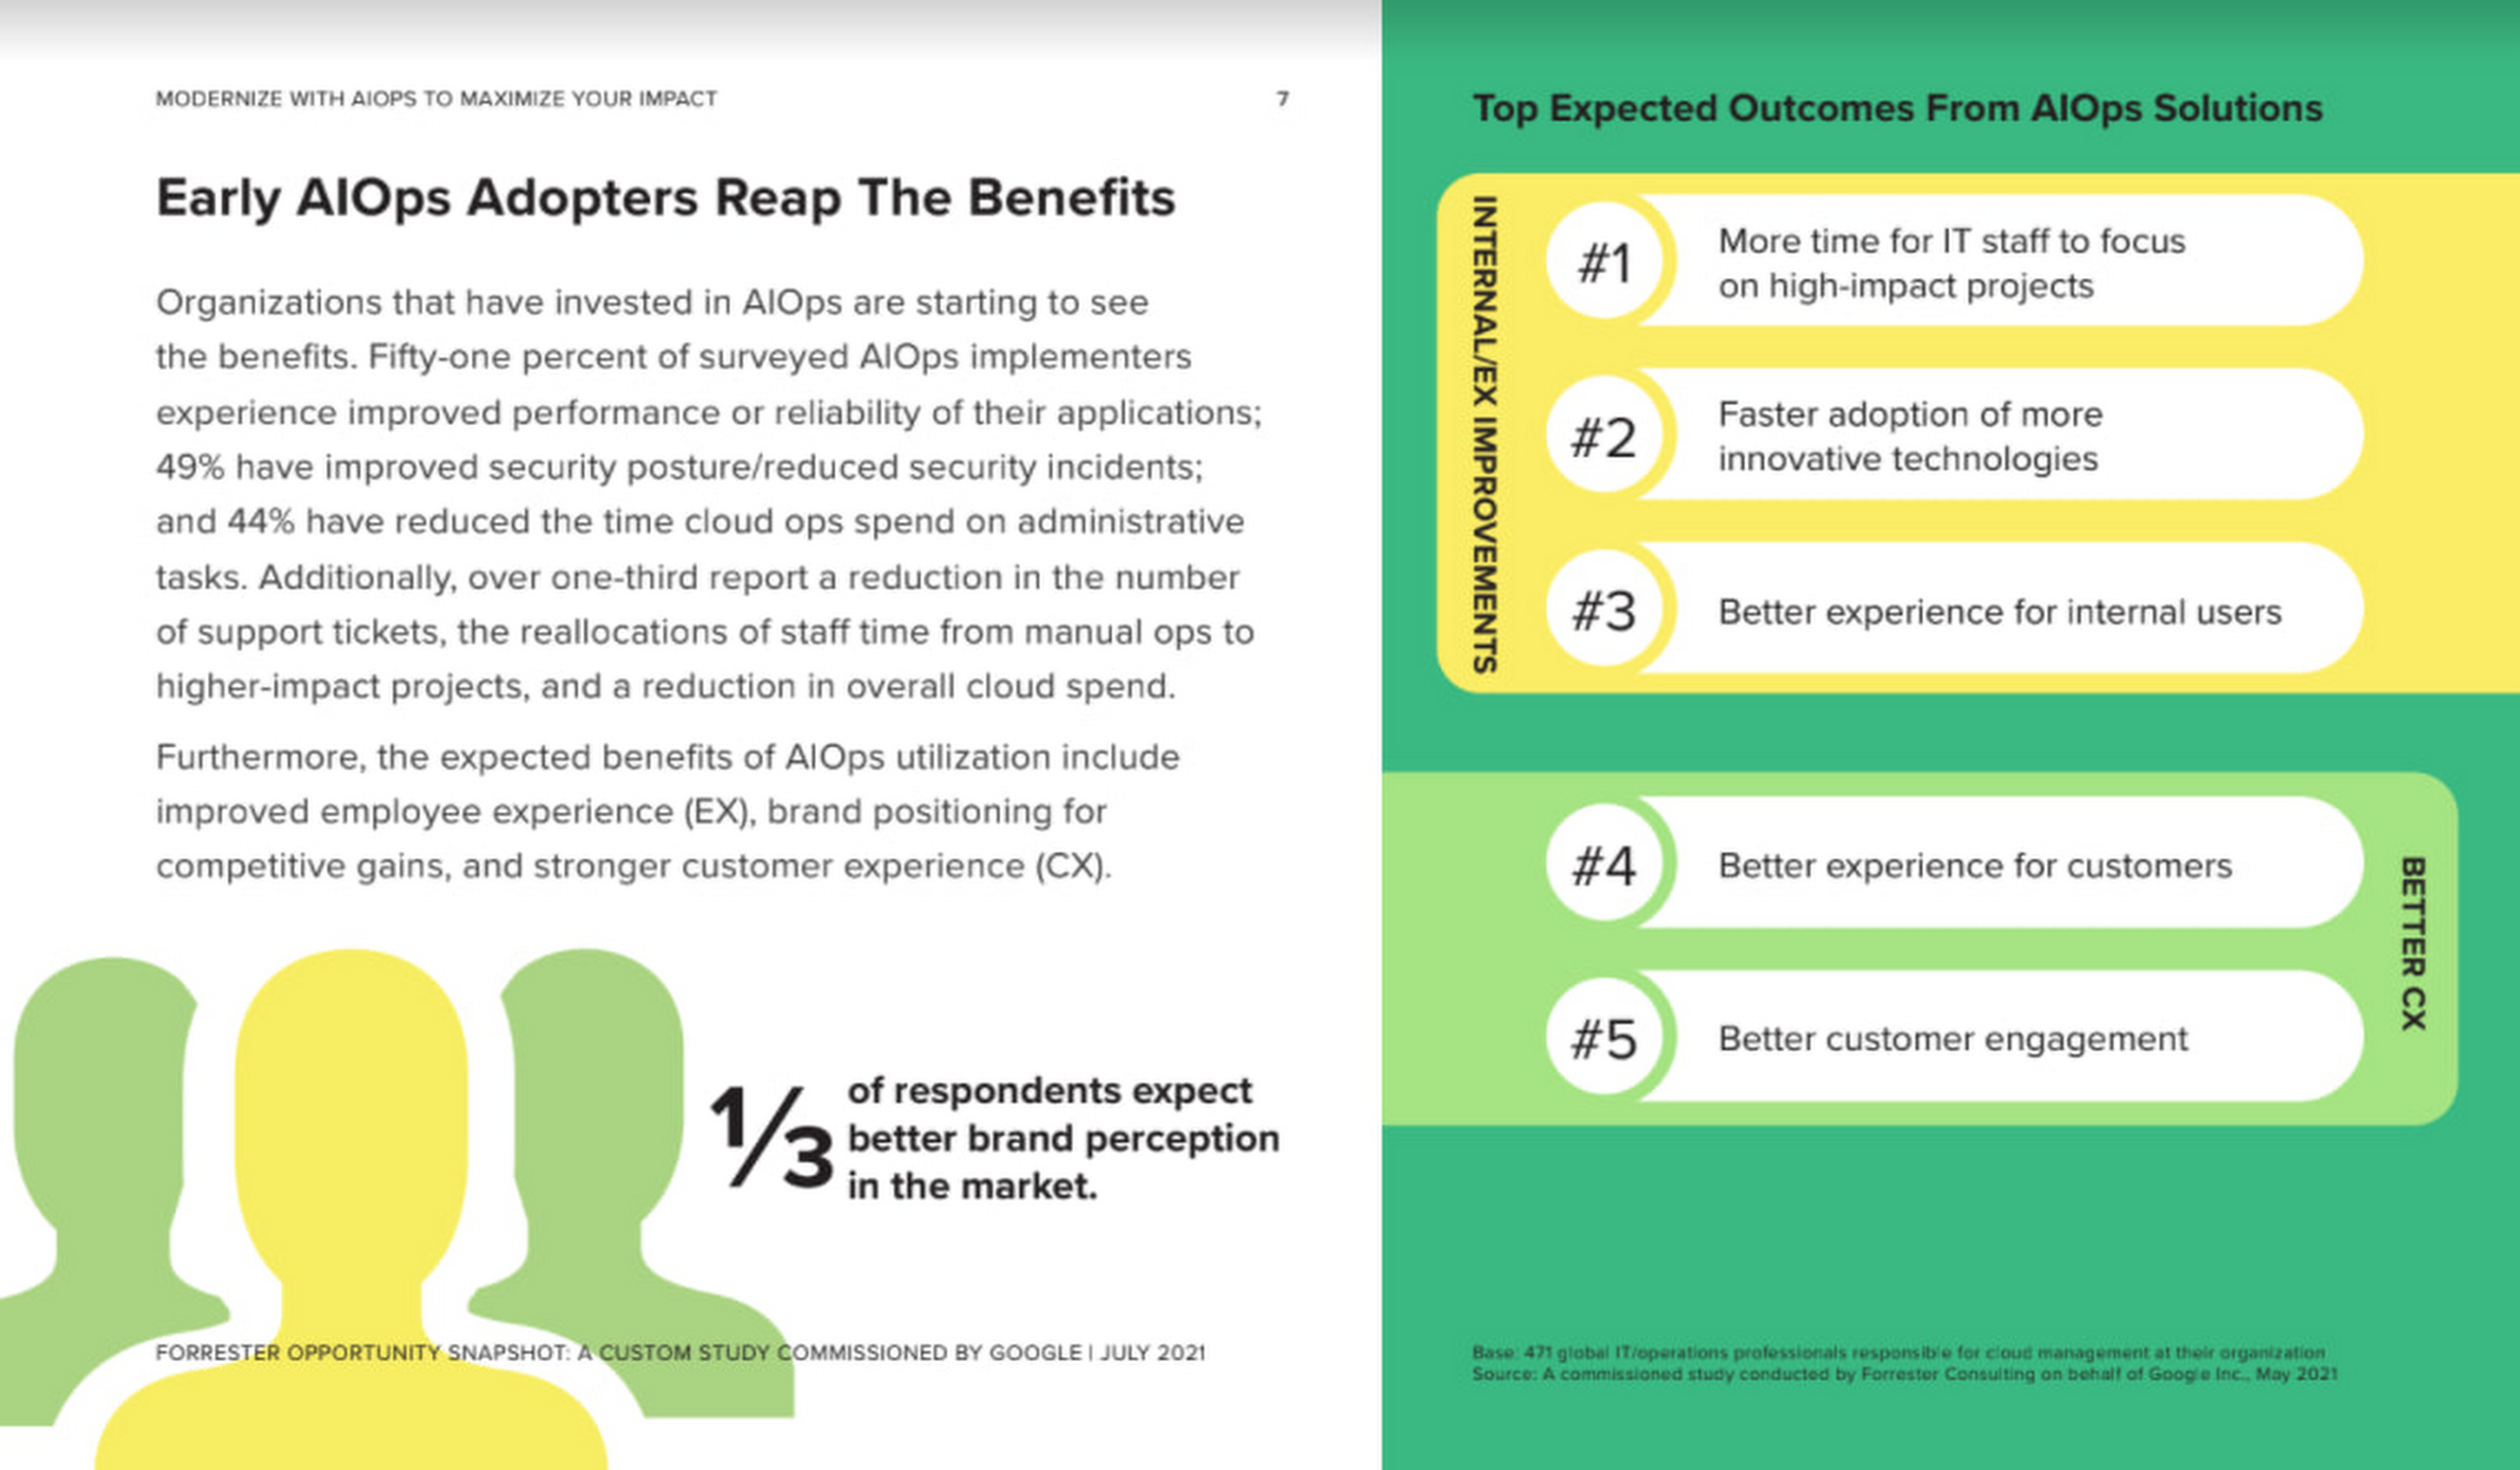
As you can see in the image above, there is a plethora of great information in this complimentary study. So, if you’re looking to enhance your cloud operations and/or adopt AIOps within your organization, be sure to download this free study today.
RAMPing Up Cloud Migration Process

3189
Of your peers have already read this article.
1:30 Minutes
The most insightful time you'll spend today!
As enterprises accelerate their migration to the cloud, they experience more notable mid- and late-phase migration challenges. Specifically, 41% face challenges when optimizing apps in the cloud post-migration, and 38% struggle with performance issues on workloads migrated to the cloud. Further, organizations have also increased reliance on outside consultants and other service providers for early-stage cloud migration tasks to ongoing management post-implementation.1
To help customers through these challenges with a simple, quick path to a successful cloud migration, Google Cloud created our comprehensive Rapid Assessment & Migration Program (RAMP). And we’ve got some exciting developments to share with our customers and partners:
Expanded focus on post-migration TCO/ROI
Given the complex nature of cloud migrations, we are committed to meeting our customers where they’re at in their cloud journeys and partnering with them to achieve their business goals — be it building customer value through innovation, driving cost efficiencies, or increasing competitive differentiation and productivity. RAMP is a holistic framework based on tangible customer TCO and ROI analyses, that supports our customers’ journeys all the way through: from assessing their digital landscapes across multiple sources including on-prem and other clouds, and identifying prioritized target workloads to building a comprehensive migration and modernization plan.
Accelerate positive outcomes with expert partners
Customers can also now expect a more streamlined migration experience through our ecosystem of partners who have completed their cloud migration specialization. Last week, we announced industry-leading updates to our partner funding programs with new assessment and consumption packages that simplify and accelerate our customers’ journey to Google Cloud, at little-to-no cost. These packages offer prescriptive pathways for infrastructure and application modernization initiatives, empowering our partners to support our customers at every stage — from discovery and planning to migration and modernization.
Through our partner ecosystem, our customers can expect:
- Distinct funding packages for assessment, planning, and migration
- Faster approval processes for accelerated deployments
- More partners eligible to participate in RAMP and access these new funding packages
Sustainability through migration
Another major focus area for RAMP is helping enterprises optimize their migration planning and maximize their ROI by including their business and technical considerations early in the process and including any sustainability goals they may have. To aid with their sustainability efforts, we are excited to share that customers can now receive a Digital Sustainability Report along with their IT assessments – enabling sustainability to be built into their migration strategies. The report provides actionable insights to measure and reduce their environmental impact, and is based on some of Google Cloud’s own best practices, having been carbon-neutral for decades and looking to run on carbon-free energy by 2030.
We are committed to solving complex problems for our customers and partners, and these updates are a reflection of the feedback we receive. Simplify your cloud migration strategy today by requesting your free assessment, finding a partner to work with, or talking to your existing partner to get started.
1. Forrester Consulting, State Of Public Cloud Migration; A study commissioned by Google, 2022
Towards The Next Wave of Google Cloud Infrastructure Innovation: New C3 VM and Hyperdisk

2790
Of your peers have already read this article.
3:00 Minutes
The most insightful time you'll spend today!
Meeting the rapidly growing demands of our customers’ high performance computing and data-intensive workloads requires deep innovation — at Google Cloud, we know we can’t rely on ever-faster CPUs alone, like Moore’s Law has enabled in the past. Customers can either optimize their workloads for a given platform, or we can offer them a platform that is optimized for their specific needs. At Google Cloud, we choose the latter.
Today, we have an exciting new release resulting from these efforts: the new C3 machine series powered by the 4th Gen Intel Xeon Scalable processor and Google’s custom Intel Infrastructure Processing Unit (IPU). Along with the recently announced Hyperdisk block storage which offers 80% higher IOPS per vCPU for high-end database management system (DBMS) workloads when compared to other hyperscalers. C3 machine instances can deliver strong performance gains to enable high performance computing and data-intensive workloads. Customers such as Snap, for example, have seen approximately a 20% increase in performance for a key workload over the previous generation C2.
The C3 machine series is just the latest example of this architectural approach. For over two decades, Google has purpose-built and designed some of the world’s most efficient and scalable computing systems to meet the needs of our customers. We built the Tensor Processing Unit (TPU) to power real-time voice search, photo object recognition, and interactive language translation; unveiled Titan, a secure, low-power microcontroller to help ensure that every machine boots from a trusted state; and launched Video Coding Units (VCUs) to enable video distribution that addresses a range of formats and client requirements. We engineer golden paths from silicon to the console, using a combination of purpose-built infrastructure, prescriptive architectures, and an open ecosystem to deliver what we term workload-optimized infrastructure.
Getting to know the C3 machine series
The Compute Engine C3 machine series, now available in Private Preview, is the first VM in the public cloud with the 4th Gen Intel Xeon Scalable processor and with Google’s custom Intel IPU. C3 machine instances use offload hardware for more predictable and efficient compute, high-performance storage, and a programmable packet processing capability for low latency and accelerated, secure networking.
“We are pleased to have co-designed the first ASIC Infrastructure Processing Unit with Google Cloud, which has now launched in the new C3 machine series. A first of its kind in any public cloud, C3 VMs will run workloads on 4th Gen Intel Xeon Scalable processors while they free up programmable packet processing to the IPUs securely at line rates of 200Gb/s. This Intel and Google collaboration enables customers through infrastructure that is more secure, flexible, and performant.” – Nick McKeown, Senior Vice President, Intel Fellow and General Manager of Network and Edge Group
The System on a Chip hardware architecture introduced in C3 VMs can enable better security, isolation, and performance. In the future, this purpose-built architecture will also allow us to offer a richer product portfolio, such as support for native bare-metal instances.
Hyperdisk block storage and 200 Gbps networking
Block storage and VMs go hand in hand. Last month, we announced the Preview release of Hyperdisk, our next-generation block storage. The new architecture decouples compute instance sizing from storage performance to deliver 80% higher IOPS per vCPU than other leading hyperscale cloud provider. And compared with the previous generation C2, C3 VMs with Hyperdisk deliver 4x higher throughput and 10x higher IOPS. Now, you don’t have to choose expensive, larger compute instances just to get the storage performance you need for data workloads such as Hadoop and Microsoft SQL Server.
To enable high performance computing workloads, C3 VMs also feature 200 Gbps low-latency networking powered by our custom IPU, as well as line-rate encryption using the open source PSP protocol.
What our customers and partners are saying

“We were pleased to observe a 20% increase in performance over the current generation C2 VMs from Google Cloud in testing with one of our key workloads. These continued performance improvements enable better end user experience and application cost efficiency.” – Aaron Sheldon, Sr. Software Engineer, Snap Inc.

“Based on the initial performance data, running weather research and forecasting (WRF) on C3 clusters can deliver as much as 10x quicker time to results for about the same computational cost. This will significantly accelerate R&D for our customers in weather, environment, and engineering domains.” — Michael Wilde, CEO, Parallel Works Inc.

“In early testing with our flagship products, including Ansys Fluent, Mechanical and LS-DYNA, on the new Google Cloud C3 VM, we’re seeing up to 3x performance gains over C2 VMs due to higher memory bandwidth and lower network latency.” – Shane Emswiler, Senior Vice President of Products, Ansys
Where we are headed
With the exponential rise in the complexity of cloud infrastructure, we as an industry must turn to automation to manage these platforms efficiently at scale. Along with Infrastructure as Code, custom chips like the Titan, the TPU and the IPU, pave the way for a not-so-distant future where we’ll automate over half of all infrastructure decisions, configuring systems dynamically in response to usage patterns. At Google Cloud, we are committed to continuing our long history of hardware innovation with a focus on workload optimization and automation.
To learn more about C3 VMs and Hyperdisk, check out our session at NEXT ‘22, How Google Cloud optimizes infrastructure for your workloads. To request access to the C3 VMs or Hyperdisk, please reach out to your sales representative or account manager.
10154
Of your peers have already watched this video.
1:00 Minutes
The most insightful time you'll spend today!
Predict User Churn on Gaming Apps with Google Analytics Data using BigQuery ML
User retention can be a major challenge for mobile game developers. According to the Mobile Gaming Industry Analysis in 2019, most mobile games only see a 25% retention rate for users after the first day. To retain a larger percentage of users after their first use of an app, developers can take steps to motivate and incentivize certain users to return. But to do so, developers need to identify the propensity of any specific user returning after the first 24 hours.
In this blog post, we will discuss how you can use BigQuery ML to run propensity models on Google Analytics 4 data from your gaming app to determine the likelihood of specific users returning to your app.
You can also use the same end-to-end solution approach in other types of apps using Google Analytics for Firebase as well as apps and websites using Google Analytics 4. To try out the steps in this blogpost or to implement the solution for your own data, you can use this Jupyter Notebook.
Using this blog post and the accompanying Jupyter Notebook, you’ll learn how to:
- Explore the BigQuery export dataset for Google Analytics 4
- Prepare the training data using demographic and behavioural attributes
- Train propensity models using BigQuery ML
- Evaluate BigQuery ML models
- Make predictions using the BigQuery ML models
- Implement model insights in practical implementations
Google Analytics 4 (GA4) properties unify app and website measurement on a single platform and are now default in Google Analytics. Any business that wants to measure their website, app, or both, can use GA4 for a more complete view of how customers engage with their business. With the launch of Google Analytics 4, BigQuery export of Google Analytics data is now available to all users. If you are already using a Google Analytics 4 property, you can follow this guide to set up exporting your GA data to BigQuery.
Once you have set up the BigQuery export, you can explore the data in BigQuery. Google Analytics 4 uses an event-based measurement model. Each row in the data is an event with additional parameters and properties. The Schema for BigQuery Export can help you to understand the structure of the data.
In this blogpost, we use the public sample export data from an actual mobile game app called “Flood It!” (Android, iOS) to build a churn prediction model. But you can use data from your own app or website.
Here’s what the data looks like. Each row in the dataset is a unique event, which can contain nested fields for event parameters.
SELECT *FROM `firebase-public-project.analytics_153293282.events_*`TABLESAMPLE SYSTEM (1 PERCENT)

This dataset contains 5.7M events from over 15k users.
SELECTCOUNT(DISTINCT user_pseudo_id) as count_distinct_users,COUNT(event_timestamp) as count_eventsFROM`firebase-public-project.analytics_153293282.events_*

Our goal is to use BigQuery ML on the sample app dataset to predict propensity to user churn or not churn based on users’ demographics and activities within the first 24 hours of app installation.

In the following sections, we’ll cover how to:
- Pre-process the raw event data from GA4
- Identify users & the label feature
- Process demographic features
- Process behavioral features
- Train classification model using BigQuery ML
- Evaluate the model using BigQueryML
- Make predictions using BigQuery ML
- Utilize predictions for activation
Pre-process the raw event data
You cannot simply use raw event data to train a machine learning model as it would not be in the right shape and format to use as training data. So in this section, we’ll go through how to pre-process the raw data into an appropriate format to use as training data for classification models.
This is what the training data should look like for our use case at the end of this section:

Notice that in this training data, each row represents a unique user with a distinct user ID (user_pseudo_id).
Identify users & the label feature
We first filtered the dataset to remove users who were unlikely to return the app anyway. We defined these ‘bounced’ users as ones who spent less than 10 mins with the app. Then we labeled all remaining users:
- churned: No event data for the user after 24 hours of first engaging with the app.
- returned: The user has at least one event record after 24 hours of first engaging with the app.
For your use case, you can have a different definition of bounce and churning. Also you can even try to predict something else other than churning, e.g.:
- whether a user is likely to spend money on in-game currency
- likelihood of completing n-number of game levels
- likelihood of spending n amount of time in-game etc.
In such cases, label each record accordingly so that whatever you are trying to predict can be identified from the label column.
From our dataset, we found that ~41% users (5,557) bounced. However, from the remaining users (8,031), ~23% (1,883) churned after 24 hours:
SELECTbounced,churned,COUNT(churned) as count_usersFROMbqmlga4.returningusersGROUP BY 1,2ORDER BY bounced

To create these bounced and churned columns, we used the following snippet of SQL code.
...#churned = 1 if last_touch within 24 hr of app installation, else 0IF (user_last_engagement < TIMESTAMP_ADD(user_first_engagement,INTERVAL 24 HOUR),1,0 ) AS churned,#bounced = 1 if last_touch within 10 min, else 0IF (user_last_engagement <= TIMESTAMP_ADD(user_first_engagement,INTERVAL 10 MINUTE),1,0 ) AS bounced,...
You can view the Jupyter Notebook for the full query used for materializing the bounced and churned labels.
Process demographic features
Next, we added features both for demographic data and for behavioral data spanning across multiple columns. Having a combination of both demographic data and behavioral data helps to create a more predictive model.
We used the following fields for each user as demographic features:
geo.countrydevice.operating_systemdevice.language
A user might have multiple unique values in these fields — for example if a user uses the app from two different devices. To simplify, we used the values from the very first user engagement event.
CREATE OR REPLACE VIEW bqmlga4.user_demographics AS (WITH first_values AS (SELECTuser_pseudo_id,geo.country as country,device.operating_system as operating_system,device.language as language,ROW_NUMBER() OVER (PARTITION BY user_pseudo_id ORDER BY event_timestamp DESC) AS row_numFROM `firebase-public-project.analytics_153293282.events_*`WHERE event_name="user_engagement")SELECT * EXCEPT (row_num)FROM first_valuesWHERE row_num = 1 #first engagement);
Process behavioral features
There is additional demographic information present in the GA4 export dataset, e.g. app_info, device, event_params, geo etc. You may also send demographic information to Google Analytics through each hit via user_properties. Furthermore, if you have first-party data on your own system, you can join that with the GA4 export data based on user_ids.
To extract user behavior from the data, we looked into the user’s activities within the first 24 hours of first user engagement. In addition to the events automatically collected by Google Analytics, there are also the recommended events for games that can be explored to analyze user behavior. For our use case, to predict user churn, we counted the number of times the follow events were collected for a user within 24 hours of first user engagement:
user_engagementlevel_start_quickplaylevel_end_quickplaylevel_complete_quickplaylevel_reset_quickplaypost_scorespend_virtual_currencyad_rewardchallenge_a_friendcompleted_5_levelsuse_extra_steps
The following query shows how these features were calculated:
WITHevents_first24hr AS (SELECTe.*FROM`firebase-public-project.analytics_153293282.events_*` eJOINbqmlga4.returningusers rONe.user_pseudo_id = r.user_pseudo_idWHERETIMESTAMP_MICROS(e.event_timestamp) <= r.ts_24hr_after_first_engagement)SELECTuser_pseudo_id,SUM(IF(event_name = 'user_engagement', 1, 0)) AS cnt_user_engagement,# ... repeated for all behavior data ...SUM(IF(event_name = 'use_extra_steps', 1, 0)) AS cnt_use_extra_steps,FROMevents_first24hrGROUP BY1
View the notebook for the query used to aggregate and extract the behavioral data. You can use different sets of events for your use case. To view the complete list of events, use the following query:
SELECTevent_name,COUNT(event_name) as event_countFROM`firebase-public-project.analytics_153293282.events_*`GROUP BY 1ORDER BYevent_count DESC
After this we combined the features to ensure our training dataset reflects the intended structure. We had the following columns in our table:
- User ID:
user_pseudo_id
- Label:
churned
- Demographic features
countrydevice_osdevice_language
- Behavioral features
cnt_user_engagementcnt_level_start_quickplaycnt_level_end_quickplaycnt_level_complete_quickplaycnt_level_reset_quickplaycnt_post_scorecnt_spend_virtual_currencycnt_ad_rewardcnt_challenge_a_friendcnt_completed_5_levelscnt_use_extra_stepsuser_first_engagement
At this point, the dataset was ready to train the classification machine learning model in BigQuery ML. Once trained, the model will output a propensity score between churn (churned=1) or return (churned=0) indicating the probability of a user churning based on the training data.
Train classification model
When using the CREATE MODEL statement, BigQuery ML automatically splits the data between training and test. Thus the model can be evaluated immediately after training (see the documentation for more information).
For the ML model, we can choose among the following classification algorithms where each type has its own pros and cons:

Often logistic regression is used as a starting point because it is the fastest to train. The query below shows how we trained the logistic regression classification models in BigQuery ML.
CREATE OR REPLACE MODEL bqmlga4.churn_logregTRANSFORM(EXTRACT(MONTH from user_first_engagement) as month,EXTRACT(DAYOFYEAR from user_first_engagement) as julianday,EXTRACT(DAYOFWEEK from user_first_engagement) as dayofweek,EXTRACT(HOUR from user_first_engagement) as hour,* EXCEPT(user_first_engagement, user_pseudo_id))OPTIONS(MODEL_TYPE="LOGISTIC_REG",INPUT_LABEL_COLS=["churned"]) ASSELECT*FROMbqmlga4.train
We extracted month, julianday, and dayofweek from datetimes/timestamps as one simple example of additional feature preprocessing before training. Using TRANSFORM() in your CREATE MODEL query allows the model to remember the extracted values. Thus, when making predictions using the model later on, these values won’t have to be extracted again. View the notebook for the example queries to train other types of models (XGBoost, deep neural network, AutoML Tables).
Evaluate model
Once the model finished training, we ran ML.EVALUATE to generate precision, recall, accuracy and f1_score for the model:
SELECT*FROMML.EVALUATE(MODEL bqmlga4.churn_logreg)

The optional THRESHOLD parameter can be used to modify the default classification threshold of 0.5. For more information on these metrics, you can read through the definitions on precision and recall, accuracy, f1-score, log_loss and roc_auc. Comparing the resulting evaluation metrics can help to decide among multiple models.Furthermore, we used a confusion matrix to inspect how well the model predicted the labels, compared to the actual labels. The confusion matrix is created using the default threshold of 0.5, which you may want to adjust to optimize for recall, precision, or a balance (more information here).
SELECTexpected_label,_0 AS predicted_0,_1 AS predicted_1FROMML.CONFUSION_MATRIX(MODEL bqmlga4.churn_logreg)

This table can be interpreted in the following way:

Make predictions using BigQuery ML
Once the ideal model was available, we ran ML.PREDICT to make predictions. For propensity modeling, the most important output is the probability of a behavior occurring. The following query returns the probability that the user will return after 24 hrs. The higher the probability and closer it is to 1, the more likely the user is predicted to return, and the closer it is to 0, the more likely the user is predicted to churn.
SELECTuser_pseudo_id,returned,predicted_returned,predicted_returned_probs[OFFSET(0)].prob as probability_returnedFROMML.PREDICT(MODEL bqmlga4.churn_logreg,(SELECT * FROM bqmlga4.train)) #can be replaced with a proper test dataset
Utilize predictions for activation
Once the model predictions are available for your users, you can activate this insight in different ways. In our analysis, we used user_pseudo_id as the user identifier. However, ideally, your app should send back the user_id from your app to Google Analytics. In addition to using first-party data for model predictions, this will also let you join back the predictions from the model into your own data.
- You can import the model predictions back into Google Analytics as a user attribute. This can be done using the Data Import feature for Google Analytics 4. Based on the prediction values you can Create and edit audiences and also do Audience targeting. For example, an audience can be users with prediction probability between 0.4 and 0.7, to represent users who are predicted to be “on the fence” between churning and returning.
- For Firebase Apps, you can use the Import segments feature. You can tailor user experience by targeting your identified users through Firebase services such as Remote Config, Cloud Messaging, and In-App Messaging. This will involve importing the segment data from BigQuery into Firebase. After that you can send notifications to the users, configure the app for them, or follow the user journeys across devices.
- Run targeted marketing campaigns via CRMs like Salesforce, e.g. send out reminder emails.
You can find all of the code used in this blogpost in the Github repository:
What’s next?
Continuous model evaluation and re-training
As you collect more data from your users, you may want to regularly evaluate your model on fresh data and re-train the model if you notice that the model quality is decaying.
Continuous evaluation—the process of ensuring a production machine learning model is still performing well on new data—is an essential part in any ML workflow. Performing continuous evaluation can help you catch model drift, a phenomenon that occurs when the data used to train your model no longer reflects the current environment.
To learn more about how to do continuous model evaluation and re-train models, you can read the blogpost: Continuous model evaluation with BigQuery ML, Stored Procedures, and Cloud Scheduler
More resources
If you’d like to learn more about any of the topics covered in this post, check out these resources:
- BigQuery export of Google Analytics data
- BigQuery ML quickstart
- Events automatically collected by Google Analytics 4
- Qwiklabs: Create ML models with BigQuery ML
Or learn more about how you can use BigQuery ML to easily build other machine learning solutions:
- How to build demand forecasting models with BigQuery ML
- How to build a recommendation system on e-commerce data using BigQuery ML
Let us know what you thought of this post, and if you have topics you’d like to see covered in the future! You can find us on Twitter at @polonglin and @_mkazi_.Thanks to reviewers: Abhishek Kashyap, Breen Baker, David Sabater Dinter.
Rethinking retail with Google Cloud Retail Search

2806
Of your peers have already read this article.
3:30 Minutes
The most insightful time you'll spend today!
Cloud Retail Search, part of Discovery Solutions For Retail portfolio, helps retailers significantly improve the shopping experience on their digital platform with ‘Google-quality’ search. Cloud Retail Search offers advanced search capabilities such as better understanding user intent and self-learning ranking models that help retailers unlock the full potential of their online experience.
Google Cloud’s Discovery Solutions For Retail are a set of services that can help retailers improve their digital engagement and are offered as part of our industry solutions.
Executive Summary
Retailers are always working on trying to keep up with the ever changing consumer expectations and trying to forecast the next trend that can impact sales and revenue.
The pandemic brought its own (and largely new) set of challenges which further complicated the issue over the last two years. The retailers were forced to adapt to the new consumer (low physical touch) behavior in which the browsing and product research was largely digital (endless aisle) and accelerated other trends such as buy online and pick up in stores (BOPIS), curbside pick up and pick up lockers. According to a McKinsey Global Survey from early last year, the pandemic has accelerated the pace of digital transformation by several years.
The National Retail Federation (NRF) estimates that retail sales are expected to grow between 6% and 8% in 2022 (slower growth rate than in 2021), as consumers spend more on services instead of goods, deal with inflation and higher food & gas prices due to geopolitical disruptions in the world.
And the competition continues to be fierce as ever. Amazon continues its dominance in the U.S. retail world and new PYMNTS data shows that Amazon’s share of US Ecommerce sales hit an all-time high of 56.7% in 2021.
Customers now have more choices than ever on how they want to engage with the retailers, where they want to spend the money and make their purchase. They also have increased expectations from the retailers around providing a high quality product discovery experience, which is forcing the retailers to invest heavily on improving customer engagement on their digital platforms to boost conversion rate and overall customer loyalty.
This is where Retail Search can help by providing an enhanced search experience that uses Google-quality search models to understand the customer intent and takes into account the retailer’s first party data (such as promotions, available inventory and price) for ranking results.
How is Google Cloud Retail Search Different
The Ecommerce platform on-site search use case is not new and retailers have been trying to solve it effectively for the last two decades. Most retailers recognize that search is a critical service on the platform and have spent countless resources to improve and fine tune it over the years. Yet the challenge remains. According to a Baymard Institute study in late as 2019, 61% of sites still required their users to search by the exact product type jargon the site uses.
However, users now expect the same robust and intuitive search features as is offered by Google.com and other popular web platforms, who seem to have the uncanny ability to intelligently interpret and yield relevant results to complex search queries.
Google’s decades of experience and research in search technology benefits Cloud Retail Search solution and that is what differentiates it from the competition.
- Advanced Query Understanding: Retail Search can provide more relevant results for the same query due to better query understanding features and knowing when to broaden or narrow the query results. While most search engines still rely largely on keyword based or matching tokens results, Retail Search has the advantage of being able to leverage Google search algorithms to return highly relevant results for product listings and category pages.
- Semantic Search: Intent recognition is a key requirement for semantic search and identifying what the customers mean when they enter the query is a key strength of Retail Search. This is critical for retailers since this has a direct impact on Clickthrough rate, Conversion rate and the Bounce Rate.
- Personalized Search Results: Another key differentiator for Retail Search is its ability to leverage user interaction data and ranking models to provide hyper personalized search results. Retailers are able to optimize search performance to deliver desired outcomes: better engagement, revenue, or conversions.
- Self-Learning and Self-Managed Solution: Retail Search models get better over time because of the self-learning capabilities built into the solution. In addition, the service is fully managed, which saves precious resources needed to keep it running and managing its set up.
- Strong Security Controls: The service runs on Google Cloud and follows security best practices to keep our customers’ data secure. Google never shares model weights or customer data across customers using the Retail API or other Discovery Solution products. For more details about this data use, see a description of Retail API data use.
High Level Conceptual View
Here is a simplified high-level view of Retail Search API. Retailers can call the API for the given search query and get back the results which can then be displayed on their digital properties.
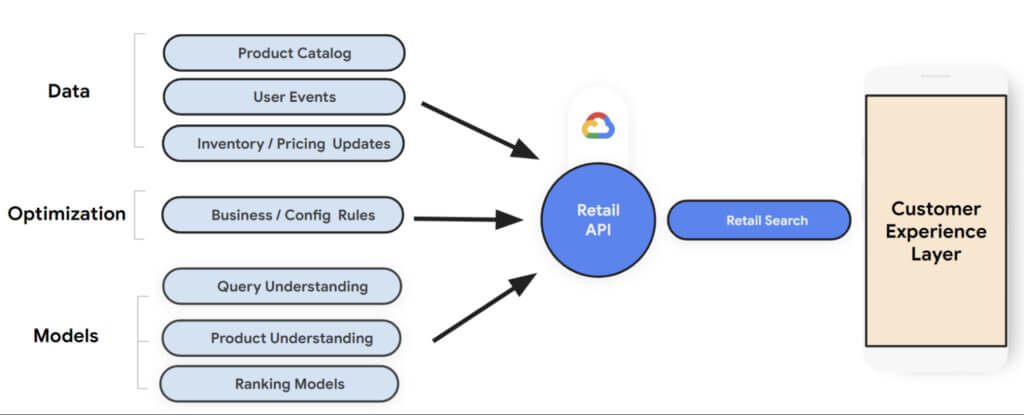
The returned results contains two types of information:
- Search results: Query search results including product listings and category pages based on advanced query understanding and semantic search.
- Dynamic faceted search attributes: Faceted Search is a feature that allows further refinement of the search by providing ways to apply additional filters while returning results.
Retail Search needs the following datasets as input to train its machine learning models for search:
- Product Catalog: Information about the available products including product categories, product description, in-stock availability, and pricing.
- User Events: This is the clickstream data that contains user interaction information such as clicks and purchases.
- Inventory / Pricing Updates: Incremental updates to in-stock availability and pricing as that information is updated.
(Keeping the product catalog up to date and recording user events successfully is crucial for getting high-quality results. Set up Cloud Monitoring alerts to take prompt action in case any issues arise).
Retailers also have the ability to set up business/config rules to customize their search results and optimize for business revenue goals such as Clickthrough rate, Conversion rate, Average size order etc.
How to get started
Retail Search is generally available now and anyone with a Google cloud account can access it. If you don’t already have an account, you can start with a trial account for free here.
Establish a Success Criteria: It’s important to establish a success criteria for measuring the effectiveness of Retail search. Get a consensus on which factor(s) you want to include in scope for measuring the effectiveness of Retail Search. This could include one or two from the following: Search Conversion Rate, Search Average Order Value, Search Revenue Per Visit and Null Search Rate (No Results Found).
- Initial Set Up: Create a Google Cloud Project and set up the Retail API. When you set up the Retail API for a new project, the Google Cloud Console displays the following three panels to help you configure your Retail API project:
- Catalog: displays product catalog and a link to import catalog.
- Event: displays user events and a link to import historical user events.
- Serving configs: contains details on serving configuration and a link to create a new serving configuration.
- Measuring Performance: Retail dashboards provide metrics to help you determine how incorporating the Retail API is affecting the results. You can view summary metrics for your project on the Analytics tab of the Monitoring & Analytics page in Cloud Console.
- Set up A/B Experiments: To measure the performance of Retail Search with another search solution, you can set up A/B tests using a third-party experiment platform such as Google Optimize.
Summary:
As retailers try to navigate through the post-pandemic world where supply chain failures and digital transformation acceleration are major focus areas, they now also have to keep a close eye on the recent geopolitical challenges resulting in rising inflation and costs.
While we can all agree that in-store shopping will continue to be a major source of revenue, it is also important for retailers to tweak the in-store experience for the digital world. Trends such as buy online and pick up in stores (BOPIS), curbside pick up and pick up lockers are here to stay.
Given all the above, consumer engagement and digital experience is more important now than ever before. The cost of search abandonment is way too high and has both short and longer term impact. Retail Search is a great solution to help reduce churn, improve conversion and retention. It provides Google-quality search models to help understand customer intent and the retailers have the ability to set up business/config rules to optimize search results for business revenue goals such as Clickthrough rate, Conversion rate and Average size order.
More Relevant Stories for Your Company

Tencent Africa Cuts Cost and Improves Stability with Google Cloud
As one of Africa’s leading technology companies, Tencent Africa is responsible for WeChat operations on the continent. WeChat Africa has successfully launched a number of features including the WeChat Wallet, a mobile payment service for smartphones, which enables seamless and secure transactions for friends to send money to one another,



How does Google Pick its Data Center ?
Google is well known for its sustainable tech and hardware initiatives. Did you know alongside its environmental friendly designs of its data centers, it takes into account various factors such as redundant power supplies, data replication, network connectivity, etc. Watch the video to learn more.

Go Green with Google’s Latest Tool and Pick the Most Sustainable Cloud Region
As a Google Cloud customer, your carbon footprint is already carbon neutral: Google first achieved carbon neutrality in 2007, and has been purchasing enough solar and wind energy to match 100% of its global electricity consumption since 2017. Now, Google is targeting a new sustainability goal: operating on carbon-free energy (CFE) 24/7,

Marxent Leverages Google Cloud to Elevate Customer Journeys on Retail Apps with 3D Shopping Experiences
As ecommerce for home goods exploded in popularity during COVID, furniture and DIY retailers looked to find new ways to grow online transaction sizes to in-store levels. Shopping for furniture and home improvement projects has always been challenging online. Furniture, kitchen cabinets, fixtures, and appliances become a part of daily
