





10130
Of your peers have already watched this video.
1:00 Minutes
The most insightful time you'll spend today!
Predict User Churn on Gaming Apps with Google Analytics Data using BigQuery ML
User retention can be a major challenge for mobile game developers. According to the Mobile Gaming Industry Analysis in 2019, most mobile games only see a 25% retention rate for users after the first day. To retain a larger percentage of users after their first use of an app, developers can take steps to motivate and incentivize certain users to return. But to do so, developers need to identify the propensity of any specific user returning after the first 24 hours.
In this blog post, we will discuss how you can use BigQuery ML to run propensity models on Google Analytics 4 data from your gaming app to determine the likelihood of specific users returning to your app.
You can also use the same end-to-end solution approach in other types of apps using Google Analytics for Firebase as well as apps and websites using Google Analytics 4. To try out the steps in this blogpost or to implement the solution for your own data, you can use this Jupyter Notebook.
Using this blog post and the accompanying Jupyter Notebook, you’ll learn how to:
- Explore the BigQuery export dataset for Google Analytics 4
- Prepare the training data using demographic and behavioural attributes
- Train propensity models using BigQuery ML
- Evaluate BigQuery ML models
- Make predictions using the BigQuery ML models
- Implement model insights in practical implementations
Google Analytics 4 (GA4) properties unify app and website measurement on a single platform and are now default in Google Analytics. Any business that wants to measure their website, app, or both, can use GA4 for a more complete view of how customers engage with their business. With the launch of Google Analytics 4, BigQuery export of Google Analytics data is now available to all users. If you are already using a Google Analytics 4 property, you can follow this guide to set up exporting your GA data to BigQuery.
Once you have set up the BigQuery export, you can explore the data in BigQuery. Google Analytics 4 uses an event-based measurement model. Each row in the data is an event with additional parameters and properties. The Schema for BigQuery Export can help you to understand the structure of the data.
In this blogpost, we use the public sample export data from an actual mobile game app called “Flood It!” (Android, iOS) to build a churn prediction model. But you can use data from your own app or website.
Here’s what the data looks like. Each row in the dataset is a unique event, which can contain nested fields for event parameters.
SELECT *FROM `firebase-public-project.analytics_153293282.events_*`TABLESAMPLE SYSTEM (1 PERCENT)

This dataset contains 5.7M events from over 15k users.
SELECTCOUNT(DISTINCT user_pseudo_id) as count_distinct_users,COUNT(event_timestamp) as count_eventsFROM`firebase-public-project.analytics_153293282.events_*

Our goal is to use BigQuery ML on the sample app dataset to predict propensity to user churn or not churn based on users’ demographics and activities within the first 24 hours of app installation.

In the following sections, we’ll cover how to:
- Pre-process the raw event data from GA4
- Identify users & the label feature
- Process demographic features
- Process behavioral features
- Train classification model using BigQuery ML
- Evaluate the model using BigQueryML
- Make predictions using BigQuery ML
- Utilize predictions for activation
Pre-process the raw event data
You cannot simply use raw event data to train a machine learning model as it would not be in the right shape and format to use as training data. So in this section, we’ll go through how to pre-process the raw data into an appropriate format to use as training data for classification models.
This is what the training data should look like for our use case at the end of this section:

Notice that in this training data, each row represents a unique user with a distinct user ID (user_pseudo_id).
Identify users & the label feature
We first filtered the dataset to remove users who were unlikely to return the app anyway. We defined these ‘bounced’ users as ones who spent less than 10 mins with the app. Then we labeled all remaining users:
- churned: No event data for the user after 24 hours of first engaging with the app.
- returned: The user has at least one event record after 24 hours of first engaging with the app.
For your use case, you can have a different definition of bounce and churning. Also you can even try to predict something else other than churning, e.g.:
- whether a user is likely to spend money on in-game currency
- likelihood of completing n-number of game levels
- likelihood of spending n amount of time in-game etc.
In such cases, label each record accordingly so that whatever you are trying to predict can be identified from the label column.
From our dataset, we found that ~41% users (5,557) bounced. However, from the remaining users (8,031), ~23% (1,883) churned after 24 hours:
SELECTbounced,churned,COUNT(churned) as count_usersFROMbqmlga4.returningusersGROUP BY 1,2ORDER BY bounced

To create these bounced and churned columns, we used the following snippet of SQL code.
...#churned = 1 if last_touch within 24 hr of app installation, else 0IF (user_last_engagement < TIMESTAMP_ADD(user_first_engagement,INTERVAL 24 HOUR),1,0 ) AS churned,#bounced = 1 if last_touch within 10 min, else 0IF (user_last_engagement <= TIMESTAMP_ADD(user_first_engagement,INTERVAL 10 MINUTE),1,0 ) AS bounced,...
You can view the Jupyter Notebook for the full query used for materializing the bounced and churned labels.
Process demographic features
Next, we added features both for demographic data and for behavioral data spanning across multiple columns. Having a combination of both demographic data and behavioral data helps to create a more predictive model.
We used the following fields for each user as demographic features:
geo.countrydevice.operating_systemdevice.language
A user might have multiple unique values in these fields — for example if a user uses the app from two different devices. To simplify, we used the values from the very first user engagement event.
CREATE OR REPLACE VIEW bqmlga4.user_demographics AS (WITH first_values AS (SELECTuser_pseudo_id,geo.country as country,device.operating_system as operating_system,device.language as language,ROW_NUMBER() OVER (PARTITION BY user_pseudo_id ORDER BY event_timestamp DESC) AS row_numFROM `firebase-public-project.analytics_153293282.events_*`WHERE event_name="user_engagement")SELECT * EXCEPT (row_num)FROM first_valuesWHERE row_num = 1 #first engagement);
Process behavioral features
There is additional demographic information present in the GA4 export dataset, e.g. app_info, device, event_params, geo etc. You may also send demographic information to Google Analytics through each hit via user_properties. Furthermore, if you have first-party data on your own system, you can join that with the GA4 export data based on user_ids.
To extract user behavior from the data, we looked into the user’s activities within the first 24 hours of first user engagement. In addition to the events automatically collected by Google Analytics, there are also the recommended events for games that can be explored to analyze user behavior. For our use case, to predict user churn, we counted the number of times the follow events were collected for a user within 24 hours of first user engagement:
user_engagementlevel_start_quickplaylevel_end_quickplaylevel_complete_quickplaylevel_reset_quickplaypost_scorespend_virtual_currencyad_rewardchallenge_a_friendcompleted_5_levelsuse_extra_steps
The following query shows how these features were calculated:
WITHevents_first24hr AS (SELECTe.*FROM`firebase-public-project.analytics_153293282.events_*` eJOINbqmlga4.returningusers rONe.user_pseudo_id = r.user_pseudo_idWHERETIMESTAMP_MICROS(e.event_timestamp) <= r.ts_24hr_after_first_engagement)SELECTuser_pseudo_id,SUM(IF(event_name = 'user_engagement', 1, 0)) AS cnt_user_engagement,# ... repeated for all behavior data ...SUM(IF(event_name = 'use_extra_steps', 1, 0)) AS cnt_use_extra_steps,FROMevents_first24hrGROUP BY1
View the notebook for the query used to aggregate and extract the behavioral data. You can use different sets of events for your use case. To view the complete list of events, use the following query:
SELECTevent_name,COUNT(event_name) as event_countFROM`firebase-public-project.analytics_153293282.events_*`GROUP BY 1ORDER BYevent_count DESC
After this we combined the features to ensure our training dataset reflects the intended structure. We had the following columns in our table:
- User ID:
user_pseudo_id
- Label:
churned
- Demographic features
countrydevice_osdevice_language
- Behavioral features
cnt_user_engagementcnt_level_start_quickplaycnt_level_end_quickplaycnt_level_complete_quickplaycnt_level_reset_quickplaycnt_post_scorecnt_spend_virtual_currencycnt_ad_rewardcnt_challenge_a_friendcnt_completed_5_levelscnt_use_extra_stepsuser_first_engagement
At this point, the dataset was ready to train the classification machine learning model in BigQuery ML. Once trained, the model will output a propensity score between churn (churned=1) or return (churned=0) indicating the probability of a user churning based on the training data.
Train classification model
When using the CREATE MODEL statement, BigQuery ML automatically splits the data between training and test. Thus the model can be evaluated immediately after training (see the documentation for more information).
For the ML model, we can choose among the following classification algorithms where each type has its own pros and cons:

Often logistic regression is used as a starting point because it is the fastest to train. The query below shows how we trained the logistic regression classification models in BigQuery ML.
CREATE OR REPLACE MODEL bqmlga4.churn_logregTRANSFORM(EXTRACT(MONTH from user_first_engagement) as month,EXTRACT(DAYOFYEAR from user_first_engagement) as julianday,EXTRACT(DAYOFWEEK from user_first_engagement) as dayofweek,EXTRACT(HOUR from user_first_engagement) as hour,* EXCEPT(user_first_engagement, user_pseudo_id))OPTIONS(MODEL_TYPE="LOGISTIC_REG",INPUT_LABEL_COLS=["churned"]) ASSELECT*FROMbqmlga4.train
We extracted month, julianday, and dayofweek from datetimes/timestamps as one simple example of additional feature preprocessing before training. Using TRANSFORM() in your CREATE MODEL query allows the model to remember the extracted values. Thus, when making predictions using the model later on, these values won’t have to be extracted again. View the notebook for the example queries to train other types of models (XGBoost, deep neural network, AutoML Tables).
Evaluate model
Once the model finished training, we ran ML.EVALUATE to generate precision, recall, accuracy and f1_score for the model:
SELECT*FROMML.EVALUATE(MODEL bqmlga4.churn_logreg)

The optional THRESHOLD parameter can be used to modify the default classification threshold of 0.5. For more information on these metrics, you can read through the definitions on precision and recall, accuracy, f1-score, log_loss and roc_auc. Comparing the resulting evaluation metrics can help to decide among multiple models.Furthermore, we used a confusion matrix to inspect how well the model predicted the labels, compared to the actual labels. The confusion matrix is created using the default threshold of 0.5, which you may want to adjust to optimize for recall, precision, or a balance (more information here).
SELECTexpected_label,_0 AS predicted_0,_1 AS predicted_1FROMML.CONFUSION_MATRIX(MODEL bqmlga4.churn_logreg)

This table can be interpreted in the following way:

Make predictions using BigQuery ML
Once the ideal model was available, we ran ML.PREDICT to make predictions. For propensity modeling, the most important output is the probability of a behavior occurring. The following query returns the probability that the user will return after 24 hrs. The higher the probability and closer it is to 1, the more likely the user is predicted to return, and the closer it is to 0, the more likely the user is predicted to churn.
SELECTuser_pseudo_id,returned,predicted_returned,predicted_returned_probs[OFFSET(0)].prob as probability_returnedFROMML.PREDICT(MODEL bqmlga4.churn_logreg,(SELECT * FROM bqmlga4.train)) #can be replaced with a proper test dataset
Utilize predictions for activation
Once the model predictions are available for your users, you can activate this insight in different ways. In our analysis, we used user_pseudo_id as the user identifier. However, ideally, your app should send back the user_id from your app to Google Analytics. In addition to using first-party data for model predictions, this will also let you join back the predictions from the model into your own data.
- You can import the model predictions back into Google Analytics as a user attribute. This can be done using the Data Import feature for Google Analytics 4. Based on the prediction values you can Create and edit audiences and also do Audience targeting. For example, an audience can be users with prediction probability between 0.4 and 0.7, to represent users who are predicted to be “on the fence” between churning and returning.
- For Firebase Apps, you can use the Import segments feature. You can tailor user experience by targeting your identified users through Firebase services such as Remote Config, Cloud Messaging, and In-App Messaging. This will involve importing the segment data from BigQuery into Firebase. After that you can send notifications to the users, configure the app for them, or follow the user journeys across devices.
- Run targeted marketing campaigns via CRMs like Salesforce, e.g. send out reminder emails.
You can find all of the code used in this blogpost in the Github repository:
What’s next?
Continuous model evaluation and re-training
As you collect more data from your users, you may want to regularly evaluate your model on fresh data and re-train the model if you notice that the model quality is decaying.
Continuous evaluation—the process of ensuring a production machine learning model is still performing well on new data—is an essential part in any ML workflow. Performing continuous evaluation can help you catch model drift, a phenomenon that occurs when the data used to train your model no longer reflects the current environment.
To learn more about how to do continuous model evaluation and re-train models, you can read the blogpost: Continuous model evaluation with BigQuery ML, Stored Procedures, and Cloud Scheduler
More resources
If you’d like to learn more about any of the topics covered in this post, check out these resources:
- BigQuery export of Google Analytics data
- BigQuery ML quickstart
- Events automatically collected by Google Analytics 4
- Qwiklabs: Create ML models with BigQuery ML
Or learn more about how you can use BigQuery ML to easily build other machine learning solutions:
- How to build demand forecasting models with BigQuery ML
- How to build a recommendation system on e-commerce data using BigQuery ML
Let us know what you thought of this post, and if you have topics you’d like to see covered in the future! You can find us on Twitter at @polonglin and @_mkazi_.Thanks to reviewers: Abhishek Kashyap, Breen Baker, David Sabater Dinter.
3622
Of your peers have already watched this video.
1:30 Minutes
The most insightful time you'll spend today!
How McKesson Gains Insights by Running SAP on Google Cloud
McKesson, a 185-yeal old, $200 billion, Fortune 6 pharmaceuticals and health information technology company, with over 80,000 employees migrated their SAP solution to Google Cloud for advanced healthcare analytics.
With changing consumer expectations, the company needed to change its architecture to be able to better serve its customers. And the old on-premise infrastructure was hindering the company from being able to meet those expectations.
Watch this video as Andrew Zitney, SVP and CTO at McKesson, explains how SAP on GCP helps the 180-year old company modernize and meet the changing expectations.
How Ather Energy is leveraging the Cloud to build and scale smart mobility solutions for India

8355
Of your peers have already read this article.
8:30 Minutes
The most insightful time you'll spend today!
In 2013, long before the world was discussing clean energy and sustainable practices, two IIT Madras graduates — Swapnil Jain and Tarun Mehta — had an idea to develop India’s first-ever electrical scooter.
This was at a time when auto manufacturers were still focusing on fossil-fuel-driven vehicles and ‘eco-friendly’ mobility solutions were more a trendy alternative catering to a niche market.
The duo founded Ather Energy in 2013 and launched their first fully-electric scooter, the Ather S340, in Bengaluru in 2016. Since then, the company has released several new models into the market and is planning to expand to eight more cities by the end of the year.
To support the smooth running of their vehicles, lower costs, improve time to market, and create great customer experience, Ather turned to Google Cloud.
Read the Full Story on YourStory
How Can Brands Evolve in Post-pandemic Era amid Changing Consumer Behavior Patterns

3647
Of your peers have already read this article.
1:30 Minutes
The most insightful time you'll spend today!
2020 saw an unprecedented change in consumer behaviour around the world, with shoppers finding new ways of discovering, evaluating and buying products. This has created fresh expectations for both brands and retailers to drive consumer closeness, embrace the digital moment and transform their operations to be more agile and sustainable. These themes have been top of mind in my conversations with our CPG customers, and set the tone at Google Cloud Summit for Retail and Consumer Goods, which concluded this week. I couldn’t be more proud of our team and thankful for our customers that supported us by participating in our sessions and attending the event.
I joined Google Cloud in January 2021 after a long career in the CPG industry, and as I shared in my CPG keynote at the summit, I am thrilled to be helping bring the power of Google to drive industry innovation in CPG. At Google we call this ‘new normal’ the transformation cloud era, where we’re working with customers who want to not just save money on storage or compute, but to use cloud and digital technologies to drive agility across their business. I also call it the era of ‘consumer switching’, because Covid-19 has accelerated the likelihood of consumers to switch brands or the way they shop. Some of these changes are still happening; over 40% shoppers in a recent Google survey reported that in March 2021 they changed brands or shopped online for something they were previously buying in store.
At Google, we have an amazing team of strategists who have been researching, observing, and analyzing the many facets of consumer behavior over the last few years. In the opening keynote at the Summit Capturing the Hearts and Minds of Today’s Consumers, Google’s Human Truths Team kicked off the Retail & Consumer Goods summit by sharing some of their consumer insights, including what behavior patterns they think will “stick” as we move into a post-pandemic world. I think these insights are especially relevant for brands, as they speak to some of our latest findings on the CPG shopper’s mindset.
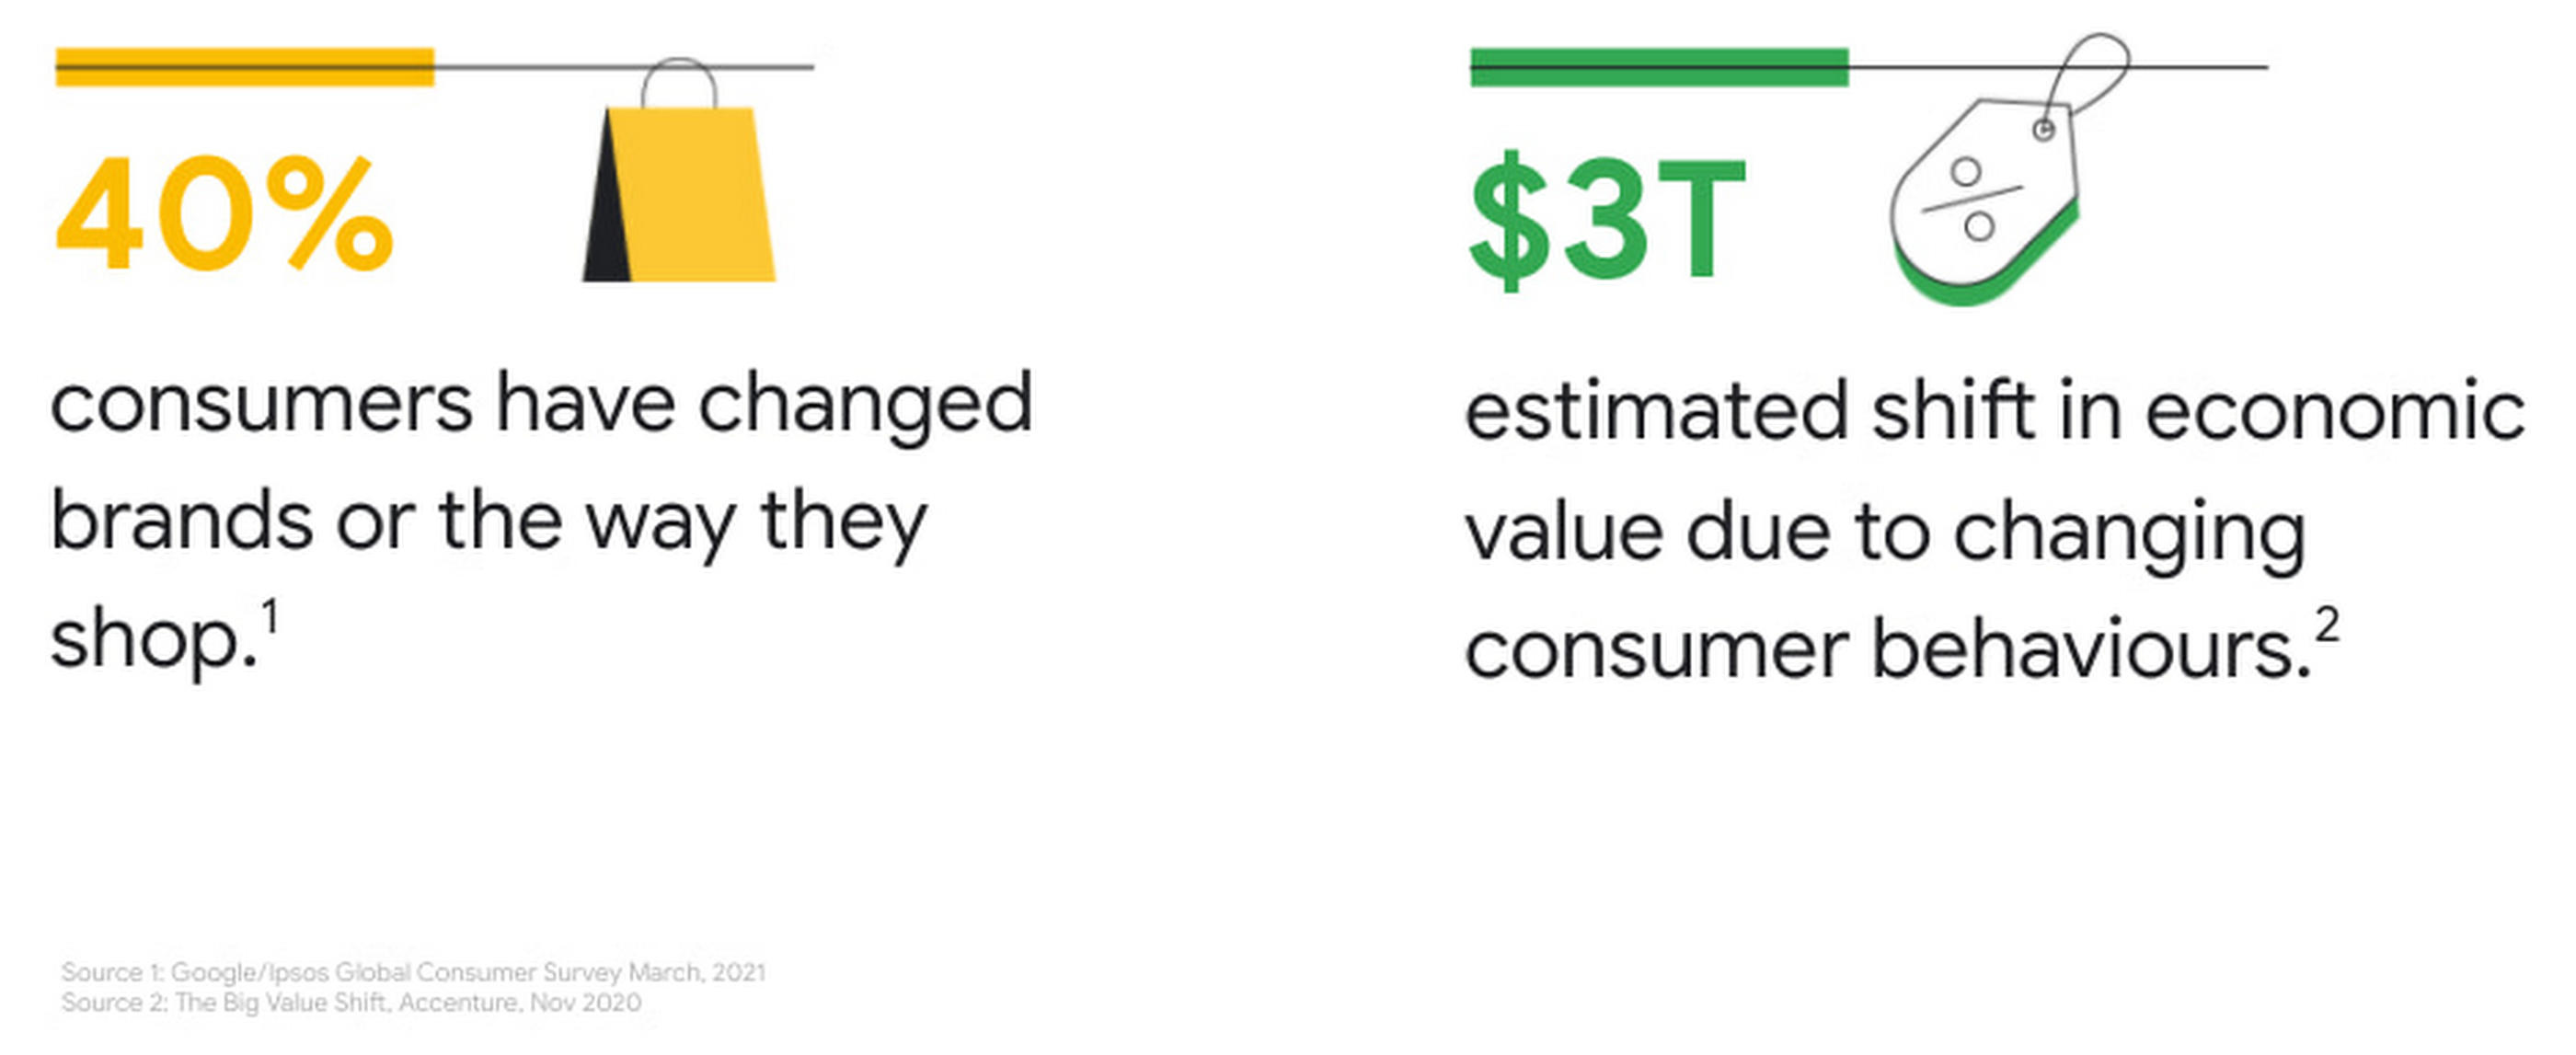
Accenture estimates that there could be a 3 trillion dollar shift in value between companies as a result of consumers shifting brands and behaviours. While it is not known who the winners of the shift will be, one thing is certain – those who will be able to leverage data and analytics fastest will benefit the most from these times of rapid change. I shared some of the implications for the CPG industry in my keynote How to grow brands in times of rapid change along with the three key areas in which Google cloud is helping CPG companies drive brand success:
- Unlocking consumer growth with data powered insights
- Transforming go-to-market in the omnichannel ecosystem
- Driving connected, efficient, and sustainable operations
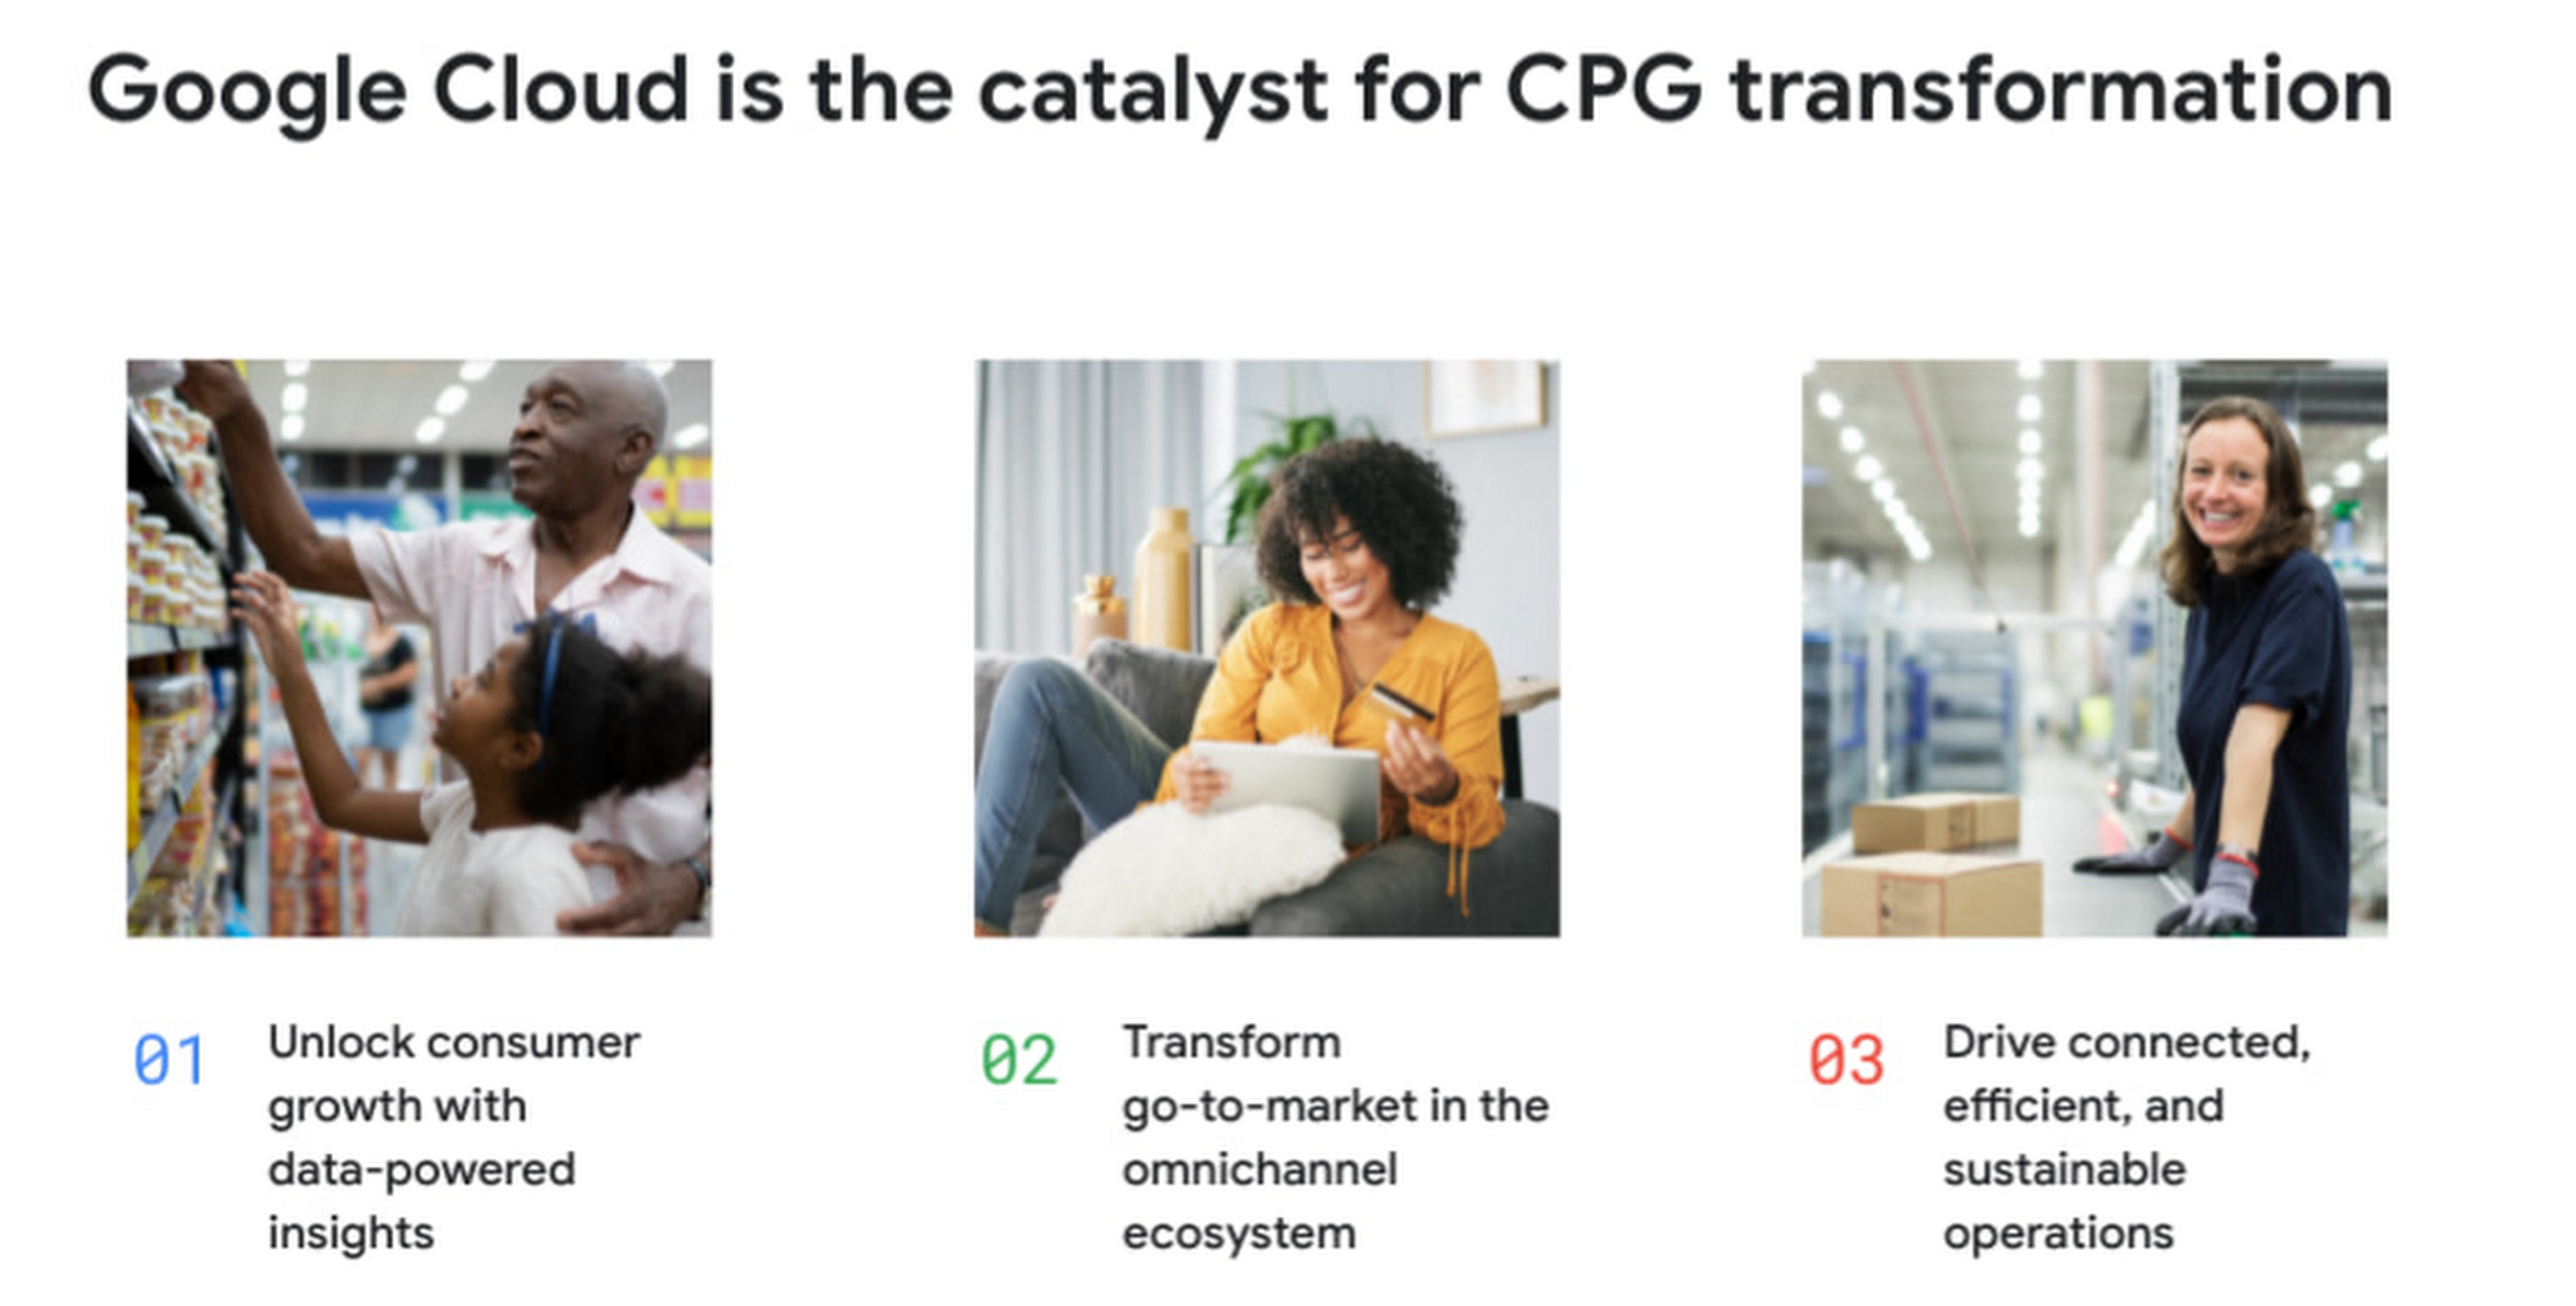
Let’s take a quick look at each of them:
Unlocking consumer growth with data-powered insights
The digital marketing ecosystem is transforming for a privacy centric world, and brands are seeing a direct impact in marketing effectiveness. As the CPG industry becomes more consumer-centric and shifts more toward direct-to-consumer (D2C) business models, acquiring and activating consented first-party consumer data presents a clear opportunity to capitalize on new consumer demands.
As a result, CPGs are turning to consumer data platforms (CDPs) to help them unify, manage, enrich, and secure all of their disparate data from different marketing tools, website analytics, email campaigns, loyalty programs, and more. Google Cloud and our ecosystem of partners can help CPGs build a privacy-centric CDP which brings together all their customer and marketing data into a modern data warehouse, with built-in predictive data visualization tools and models. With a CDP built on Google Cloud, you can integrate data from Google Marketing Platform to drive predictive marketing and media effectiveness. And with pre-built connectors you can also easily integrate non-Google media and data from other enterprise platforms like SAP and Oracle to leverage consumer data for more integrated decision making. Democratize access to data across the organization with our Business Intelligence tool Looker to enable faster decisions in real-time from marketing to supply chain to product innovation.
At the Retail & CPG Summit we shared how retailers and brands can drive consumer closeness in a privacy-centric world featuring Procter & Gamble’s experience building and activating consumer data in a privacy-safe way to serve consumers better and maximize marketing effectiveness and drive growth across their business. And in a demo, Constellation Brands shared how they’re leveraging real-time data from several commercial sources using Looker to unpack insights and develop action plans.
Transforming go-to-market in the omnichannel ecosystem
Amidst COVID-19 restrictions and rolling lockdowns, ecommerce activity has surged past a point of no return. Direct to consumer (D2C) or digitally native brands were able to minimize consumers switching during the pandemic by offering a great online experience. While in-person shopping remains important, consumers are expecting more digital and omnichannel experiences and many will continue to explore new brands and purchase online. CPGs that want to maintain their market leadership can no longer afford to ignore the key role omnichannel capabilities will play in capturing the attention of both retailers and consumers. Even if D2C sales are not a big portion of your business, you will benefit from first-party data that can help you drive insights and product innovation.
CPG brands want to transform their older, clunky ordering processes into modern digital shopping experiences. Re-platforming legacy solutions on Google Cloud not only accelerates application innovation, but also makes it easier to quickly launch new features and products. At Google Cloud we have transformed ecommerce for large D2C brands and traditional retailers, so we know what a best in class D2C experience looks like. And we can bring it to your brands. We already help some of the biggest brands in retail modernize ecommerce and enhance product discovery with solutions like Visual Search and Recommendations AI. All of these can help you build a best in class omni channel presence for your brands.
We had several sessions on improving your omni channel experience, including
Why search abandonment is the metric that matters featuring Macy’s and Conversational Commerce with Google with Albertsons, where we shared how Google’s conversational experiences can help consumers message businesses from wherever they are, and whenever they need them.
Driving connected, efficient, and sustainable operations
The superpowers of AI/ML are not just for marketing. Did you know that research from MIT and Google Cloud has found companies that use AI/ML can drive 2x more data-driven decisions, 5x faster decision making, and 3x faster execution? By connecting your operations in real time with demand signals like search, trends, weather, mobility and supercharging this data with AI and ML, you can make smarter and quicker business decisions. For example, you can use search trends to drive demand forecasting and ramp up manufacturing for popular products.
Google Cloud can help you modernize legacy business applications by migrating them to the cloud and using AI/ML and smart analytics to drive business outcomes. Take SAP for example – a Forrester study found that modernizing SAP with Google not only resulted in 56% more efficient IT teams – it also generated 160% 3-year ROI.
SAP data on Google Cloud breaks down silos across SAP, marketing, manufacturing systems, and external data sources for next-level intelligent operations. For example, with SAP and Google Cloud, you can combine product, media, CRM, digital commerce and site data from SAP and non-SAP sources to uncover stronger consumer insights and fuel product discovery along the path to purchase. You can merge SAP product and sales data with consumer, market data and Google geo trends to drive targeted promotion outcomes, maximizing the ROI of promotional dollars across retail channels. You can also integrate supply chain and manufacturing data from SAP systems with consumer, marketing and Google geo market data to improve demand forecasting and optimize supply chain logistics. The possibilities are endless. This is why we describe SAP modernization as The Gift That Keeps On Giving. Check out the session on SAP from the Summit and hear from Rodan + Fields on their experience of modernizing SAP on Google Cloud.
Another solution that excites me is Vertex AI, which transforms the demand forecasting process. Traditional demand forecasting accuracy is a challenge for most CPGs. Current forecasting methods do not take into account granular factors that impact demand, like local weather, demographics, or unforeseen events. With our recently launched Vertex Forecast, Google is making it much easier to start using cutting-edge machine learning models for demand forecasting. In our session Demand Forecasting: Time for Intelligence, Not Intuition featuring American Eagle Outfitters, we share how you can adopt a data science approach to demand forecasting that’s customized to your unique needs.
CPG organizations come to Google for help solving their toughest problems, whether it be driving new consumer growth, unlocking new routes to market, or building connected, sustainable operations. And we bring the best of Google: innovation, culture, infrastructure, AI/ML, and a deep understanding of consumer behaviour to help them build best-in-class brands.
I’d like to end with a topic that’s very close to my heart. This is around Solving for Sustainability in Retail and Consumer Goods. Our research shows that 62% of shoppers cared about at least one sustainability aspect when purchasing online in 2020. In addition, the events of the past year have triggered consumers to re-evaluate their relationships with brands and prioritize those that are more sustainable in the context of the pandemic. Watch this session to learn more about how retailers and consumer goods companies can leverage technology, data, and machine learning to help make sustainability a core part of the recovery.
All our session content is available on demand. Ready to learn more about how we’re helping CPG brands and manufacturers drive results? Learn more about Google Cloud’s consumer packaged good solutions and reach out to your Google Cloud sales executive to set up a deeper conversation on how we can help you grow your brands today and in the future.
Beany’s Cloud-Based Accounting Solutions Transform Small Business Finance

1804
Of your peers have already read this article.
2:30 Minutes
The most insightful time you'll spend today!
Many people start a small business that aligns with their passions, but soon discover the day-to-day running of a business is very different than anticipated. Dealing with accounting, finance, and other daily activities can quickly overwhelm even the most promising of new businesses.
Recognizing the unique challenges facing small businesses, we founded Beany. With our personalized accounting platform, small business owners can relax knowing that we will look after all their compliance and advisory needs. Business owners who use Beany also benefit because they end up freeing more time to focus on what they enjoy and do best—likely the main reasons they started their business in the first place. We prepare financial statements, minimize tax and keep an eye that our clients are paying the right amount at the right time. We also advise on business purchase and sale, valuations and forecasting for banks. In fact, we do everything that a business owner needs from their accountant, including a help desk filled with domain experts to provide free & unlimited advice and support.
As we expand our team, we’ll continue to introduce new solutions, services, and integrations that make it even easier for small businesses to prioritize business planning, balance budgets, and keep up with ever-changing tax laws. We also plan to launch Beany in new markets and extend our global footprint beyond New Zealand, Australia, and the UK.
Migrating and scaling Beany
Beany was initially developed and hosted on a virtual private server (VPS) with limited capabilities. As our subscriber base grew, we realized we needed a more scalable, secure solution to eliminate downtime and deliver a reliable customer experience. We also understood it would be challenging for our small engineering team to cost-effectively test and deploy new features without a more agile development environment.
With that in mind, we chose the secure-by-design infrastructure of Google Cloud to power Beany and help us scale our innovative accounting platform. We now use Compute Engine to cost-effectively create virtual machines (VMs) that automatically select optimal amounts of processing and memory.
In addition, we encrypt, store, and archive everything on highly secure Cloud Storage, leveraging a combination of solid-state drives (SSDs) and hard disk drives (HDDs) for hot, nearline, and coldline data. With Cloud Storage, we can replicate data between regions in under 15 minutes to enable rapid recovery and business continuity. This has been really useful moving images to data centers on the other side of the planet quickly as we primarily operate out of Sydney and London.
We also connect, create, and collaborate on Google Workspace using Google Gmail, Docs, Calendar, and Meet. Beany smoothly integrates with Google Sheets to provide live reporting from our application direct to our sales, marketing and support staff. It also makes sharing account data with our accounting clients easy and secure.
Analyzing financial data with Google Cloud AI and machine learning
Joining the Google for Startups Cloud Program gave us immediate access to Google Cloud credits which we use to cost-effectively trial and deploy additional Google Cloud solutions. We continue to evaluate Cloud Code which will help our developers more efficiently create, deploy, and integrate applications directly on Google Cloud. We’re also exploring how Google Cloud AI and machine learning products such as Vertex AI and AutoML can further revolutionize accounting with advanced financial analyses and end-to-end automation of business processes.
We can’t wait to see what we accomplish next as we grow our team and introduce new services and solutions that enable small businesses to streamline operations, lower costs, and increase profits. It’s exciting to help small business owners manage accounting and financial planning so they can spend more time doing what they love and realize their business vision.

Beany team members
If you want to learn more about how Google Cloud can help your startup, visit our page here to get more information about our program, and sign up for our communications to get a look at our community activities, digital events, special offers, and more.
3181
Of your peers have already watched this video.
12:00 Minutes
The most insightful time you'll spend today!
Google’s Tau VMs Help Nylas Reach New Heights!
Nylas is a leading provider of scalable and secure communications data platform that powers business process and productivity automation and drive digital engagement for its customers that are fast-growing start-ups as well as large enterprises. The company approached Google Cloud with a complex challenge involving its legacy architecture that gave rise to cost and scalability issues. Nylas processed 30 terrabytes of data, billions of messages and hundreds of millions of APIs per day! Moreover, to serve Nylas’ large enterprise customer in the Financial Services industry with stringent security needs and data storage infrastructure requirements to avoid in-memory hacks, they rewrote the entire infrastructure in Go and Kubernetes on top of Google.
Watch the video to learn how Google Cloud has been the best distributed technology and a true partner for Nylas, helping them achieve 40 percent in savings by moving to Tau VMs!
More Relevant Stories for Your Company

Google Cloud Migration Speeds Up The New York Times’ Journey to New Normal
Like virtually every business across the globe, The New York Times had to quickly adapt to the challenges of the coronavirus pandemic last year. Fortunately, our data system with Google Cloud positioned us to perform quickly and efficiently in the new normal. How we use data We have an end-to-end type of

Takeaways from the Google Cloud Public Sector Summit on Prioritizing Tech Investments
Editor’s note: Today’s post highlights five takeaways from our session at the first ever Google Cloud Public Sector Summit. To watch the full session, check out All the Right Moves: Prioritizing Investments in Technology. Now more than ever, government agencies need to invest in digital services to fulfill their missions and better



Pharma Firm Drives 80% Improvement in Speed with SAP on Google Cloud
FFF Enterprises is a leading supplier of critical-care biopharmaceuticals, plasma products, and vaccines. Their passion for patient safety and product efficacy drives their mission of Helping Healthcare Care. For FFF Enterprises if they have to focus on ERP infrastructure, that takes away from getting products to patents. Learn why FFF

Frost & Sullivan: State of Digital Transformation in India
Digital transformation is about how digital technologies can connect people and processes to solve challenges that traditional methodologies could not. While this transformation is imperative for businesses of all sizes, the Frost & Sullivan Enterprise Cloud Maturity Index (ECMI) assessment indicates that around 85% of CXOs want to digitally transform
