





Principles to Make Organizations Data Engineering Driven

4850
Of your peers have already read this article.
4:00 Minutes
The most insightful time you'll spend today!
In the “What type of data processing organisation” paper, we examined that you can build a data culture whether your organization consists mostly of data analysts, or data engineers, or data scientists. However, the path and technologies to become a data-driven innovator are different and success comes from implementing the right tech in a way that matches a company’s culture. In this blog we will expand the data engineering driven organizations and provide how it can be built from the first principles.
Not all organizations are alike. All companies have similar functions (sales, engineering, marketing), but not all functions have the same influence on the overall business decisions. Some companies are more engineering-driven, others are sales-driven, others are marketing-driven. In practice, all companies are a mixture of all these functions. In the same way, the data strategy can be more focused on data analysts, and others on data engineering. Culture is a combination of several factors, business requirements, organizational culture, and skills within the organization.
Traditionally organizations that focused on engineering mainly came from technology driven digital backgrounds. They built their own frameworks or used programming frameworks to build repeatable data pipelines. Some of this is due to the way the data is received, the shape the data is received and the speed of the data arrival as well. If your data allows it, your organization can be more focused on data analysis, and not so much on data engineering. If you can apply an Extract-Load-Transform approach (ELT) rather than the classic Extract-Transform-Load (ETL), then you can focus on data analysis and might not need extensive data engineering capability. For example, data that can be loaded directly into the data warehouse allows data analysts to also do data engineering work and apply transformations to the data.
This does not happen so often though. Sometimes your data is messy, inconsistent, bulky, and encoded in legacy file formats or as part of legacy databases or systems, with a little potential to be actionable by data analysts.
Or maybe you need to process data in streaming, applying complex event processing to obtain competitive insights in near real time. The value of data decays exponentially with time. Most companies can process data by the next day in batch mode. However, not so many are probably obtaining such knowledge the next second data is produced.
In these situations, you need the talent to unveil the insights hidden in that amalgam of data, either messy or fast changing (or both!). And almost as importantly, you need the right tools and systems to enable that talent too.
What are those right tools? Cloud provides the scalability and flexibility for data workloads that are required in such complex situations. Long gone are the times when data teams had to beg for the resources that were required to have an impact in the business. Data processing systems are no longer scarce, so your data strategy should not generate that scarcity artificially.
In this article, we explain how to leverage Google Cloud to enable data teams to do complex processing of data, in batch and streaming. By doing so, your data engineering and science teams can have an impact when (in seconds) after the input data is generated.
Data engineering driven organizations
When the complexity of your data transformation needs is high, data engineers have a central role in the data strategy of your company, leading to data engineering driven organization. In this type of organization, data architectures are organized in three layers: business data owners, data engineers, and data consumers.
Data engineers are at the crossroads between data owners and data consumers, with clear responsibilities:
- Transporting data, enriching data whilst building integrations between analytical systems and operational systems ( as in the real time use cases)
- Parsing and transforming messy data coming from business units into meaningful and clean data, with documented metadata
- Applying DataOps, that is, functional knowledge of the business plus software engineering methodologies applied to the data lifecycle
- Deployment of models and other artifacts analyzing or consuming data
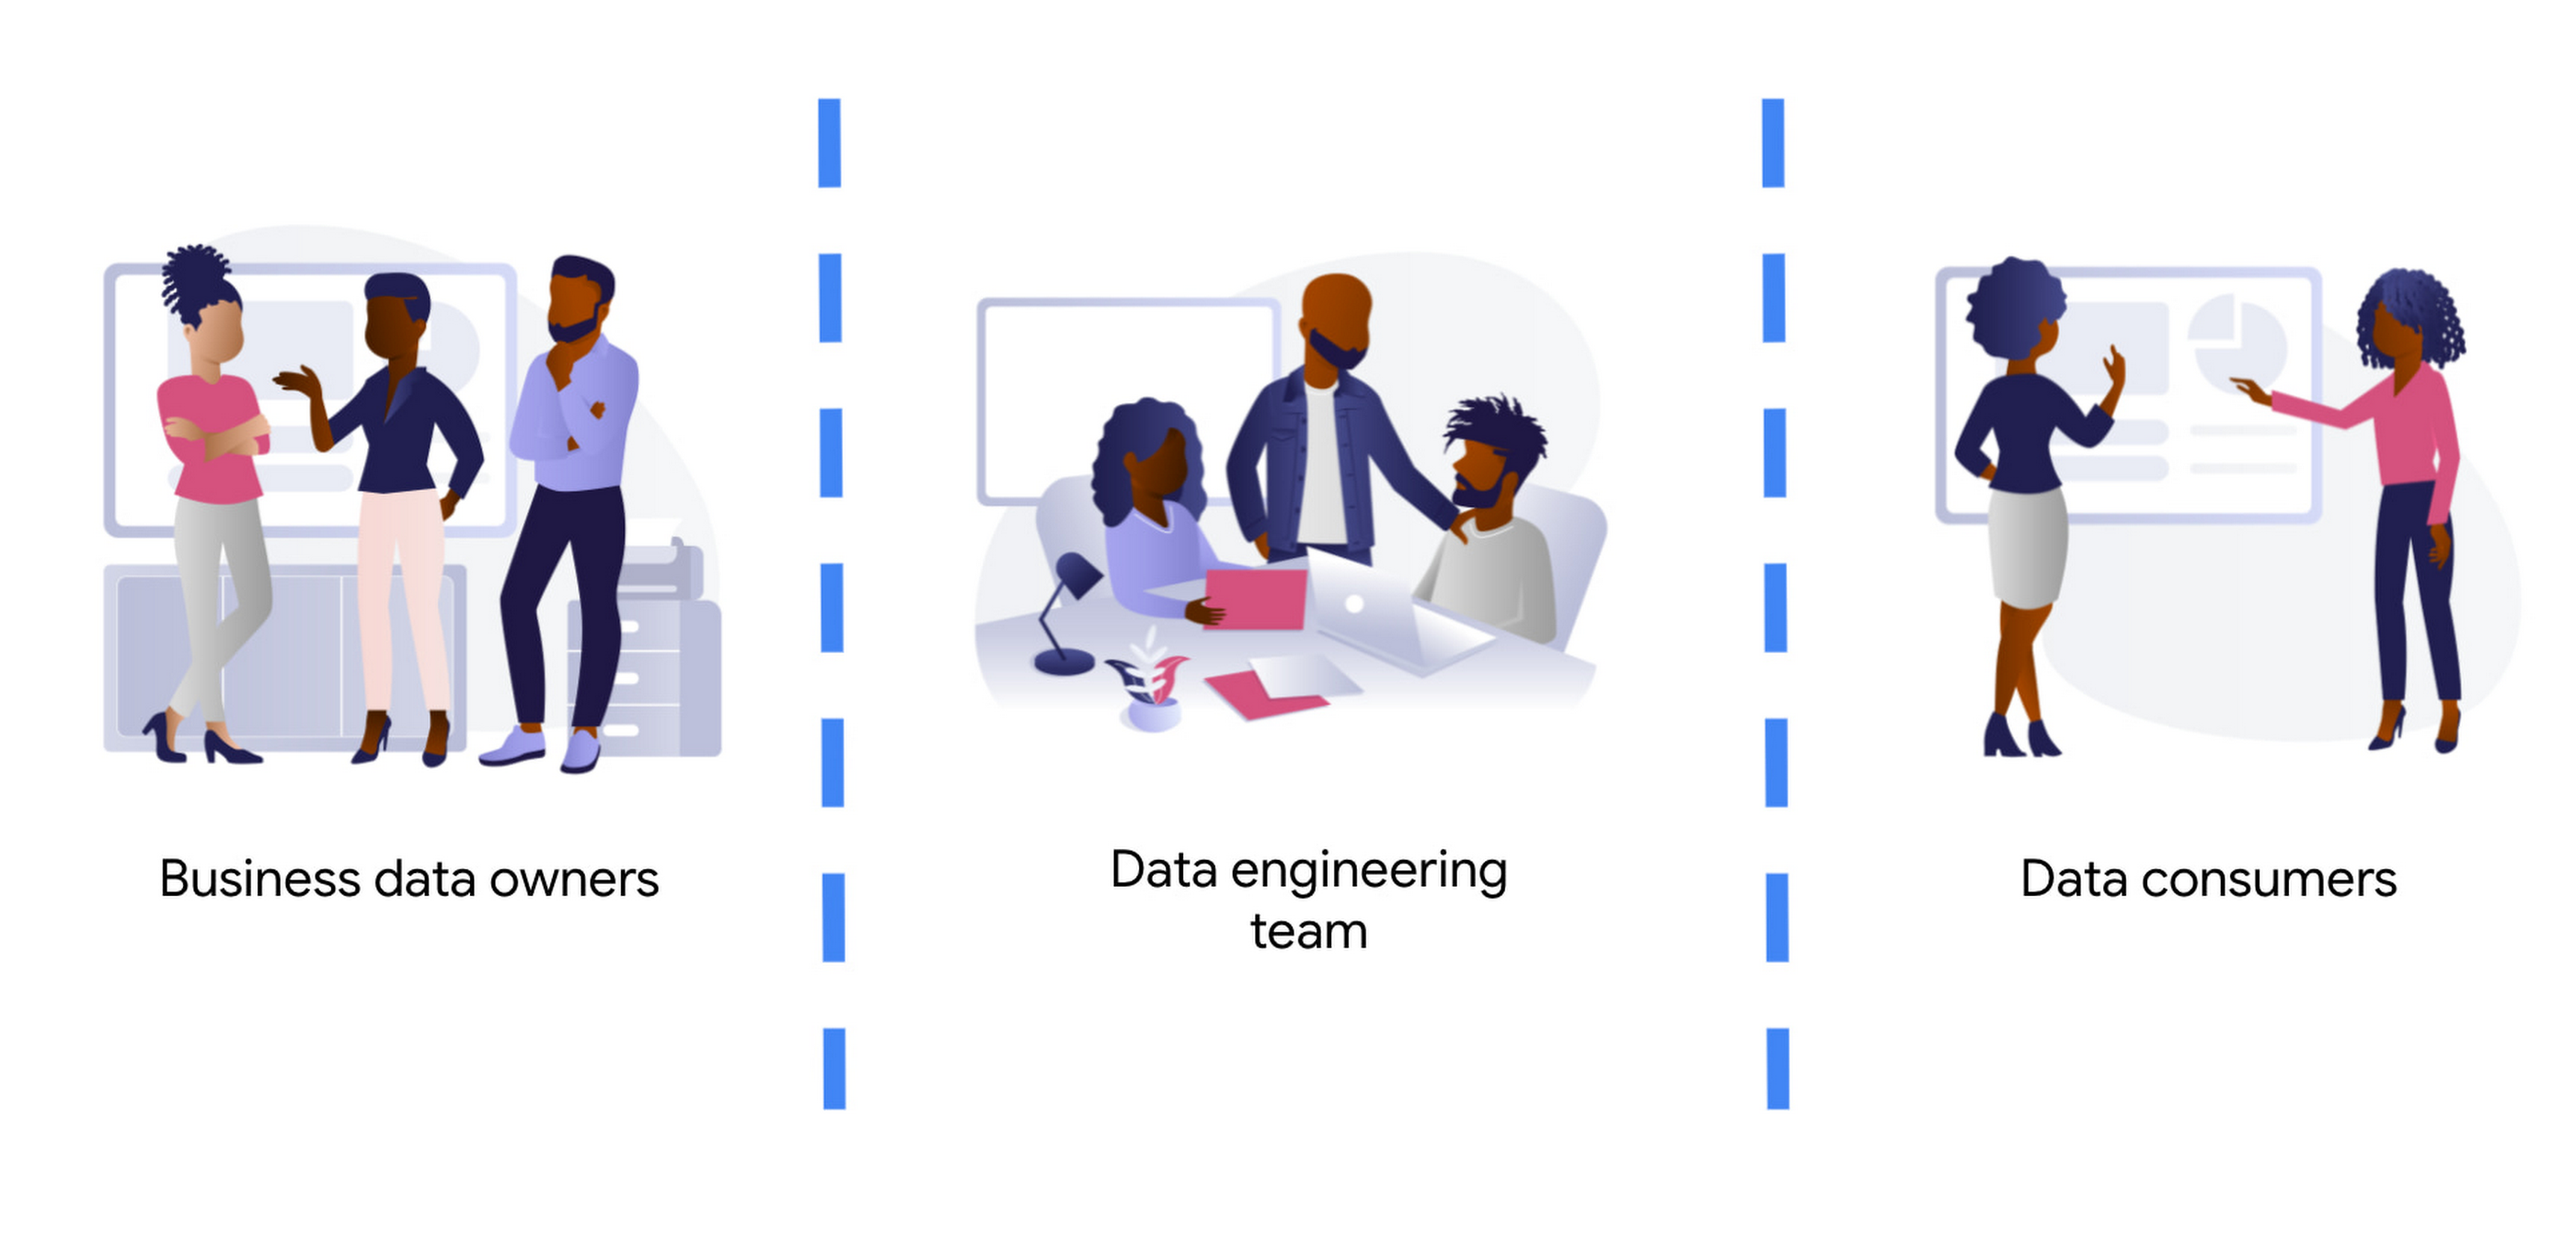
Business data owners are cross-functional domain-oriented teams. These teams know the business in detail, and are the source of data that feeds the data architecture. Sometimes these business units may also have some data-specific roles, such as data analysts, data engineers, or data scientists, to work as interfaces with the rest of the layers. For instance, these teams may design a business data owner, that is the point of contact of a business unit in everything that is related to the data produced by the unit.
At the other end of the architecture, we find the data consumers. Again, also cross-functional, but more focused on extracting insights from the different data available in the architecture. Here we typically find data science teams, data analysts, business intelligence teams, etc. These groups sometimes combine data from different business units, and produce artifacts (machine learning models, interactive dashboards, reports, and so on). For deployment, they require the help of the data engineering team so that data is consistent and trusted.
At the center of these crossroads, we find the data engineering team. Data engineers are responsible for making sure that the data generated and needed by different business units gets ingested into the architecture. This job requires two disparate skills: functional knowledge and data engineering/software development skills. This is often coined under the term DataOps (which evolved from DevOps methodologies developed within the past decades but applied to data engineering practices).
Data engineers have another responsibility too. They must help in the deployment of artifacts produced by the data consumers. Typically, the data consumers do not have the deep technical skills and knowledge to take the sole responsibility for deployment of their artifacts.This is also true for highly sophisticated data science teams. So data engineers must add other skills under their belt: machine learning and business intelligence platform knowledge. Let’s clarify this point, we don’t expect data engineers to become machine learning engineers. Data engineers need to understand ML to ensure that the data delivered to the first layer of a model ( the input ) is correct. They will also become key when delivering that first layer of data in the inference path, as here the data engineering skills around scale / HA etc really need to shine.
By taking the responsibility of parsing and transforming messy data from various business units, or for ingesting in real time, data engineers allow the data consumers to focus on creating value. Data science and other types of data consumers are abstracted away from data encodings, large files, legacy systems, complex message queue configurations for streaming. The benefits of concentrating that knowledge in a highly skilled data engineering team are clear, notwithstanding that other teams (business units and consumers) may also have their data engineers to work as interfaces with other teams. More recently, we even see squads created with members of the business units (data product owners), data engineers, data scientists, and other roles. Effectively creating complete teams with autonomy and full responsibility over a data stream, from the incoming data down to the data driven decision with impact in the business.
Reference architecture – Serverless
The number of skills required for the data engineering team is vast and diverse. We should not make it harder by expecting the team to maintain the infrastructure where they run data pipelines. They should be focusing on how to cleanse, transform, enrich, and prepare the data rather than how much memory or how many cores their solution may require.
The reference architectures presented here are based on the following principles:
- Serverless no-ops technologies
- Streaming-enabled for low time-to-insight
We present different alternatives, based on different products available in Google Cloud:
- Dataflow, the built-in streaming analytics platform in Google Cloud
- Dataproc, the Google Cloud’s managed platform for Hadoop and Spark.
- Data Fusion, a codeless environment for creating and running data pipelines
Let’s dig into these principles.
By using serverless technology we eliminate the maintenance burden from the data engineering team, and we provide the necessary flexibility and scalability for executing complex and/or large jobs. For example, scalability is essential when planning for traffic spikes during mega Friday for retailers. Using serverless solutions allows retailers to look into how they are performing during the day. They no longer need to worry about resources needed to process massive data generated during the day.
The team needs to have full control and write their own code for the data pipelines because of the type of pipelines that the team develops. This is true either for batch or streaming pipelines. In batch, the parsing requirements can be complex and no off the shelf solution works. In streaming, if the team wants to fully leverage the capabilities of the platform, they should implement all the complex business logic that is required, without artificially simplifying the complexity in exchange for some better latency. They can develop a pipeline that achieves a low latency with highly complex business logic. This again requires the team to start writing code from first principles.
However, that the team needs to write code should not imply that they need to rewrite any existing piece of code. For many input/output systems, we can probably reuse code from patterns, snippets, and similar examples. Moreover, a logical pipeline developed by a data engineering team does not necessarily need to map to a physical pipeline. Some parts of the logic can be easily reused by using technologies like Dataflow templates, and use those templates in orchestration with other custom developed pipelines. This brings the best of both worlds (reuse and rewrite), while saving precious time that can be dedicated to higher impact code rather than common I/O tasks. The reference architecture presented has another important feature: the possibility to transform existing batch pipelines to streaming.
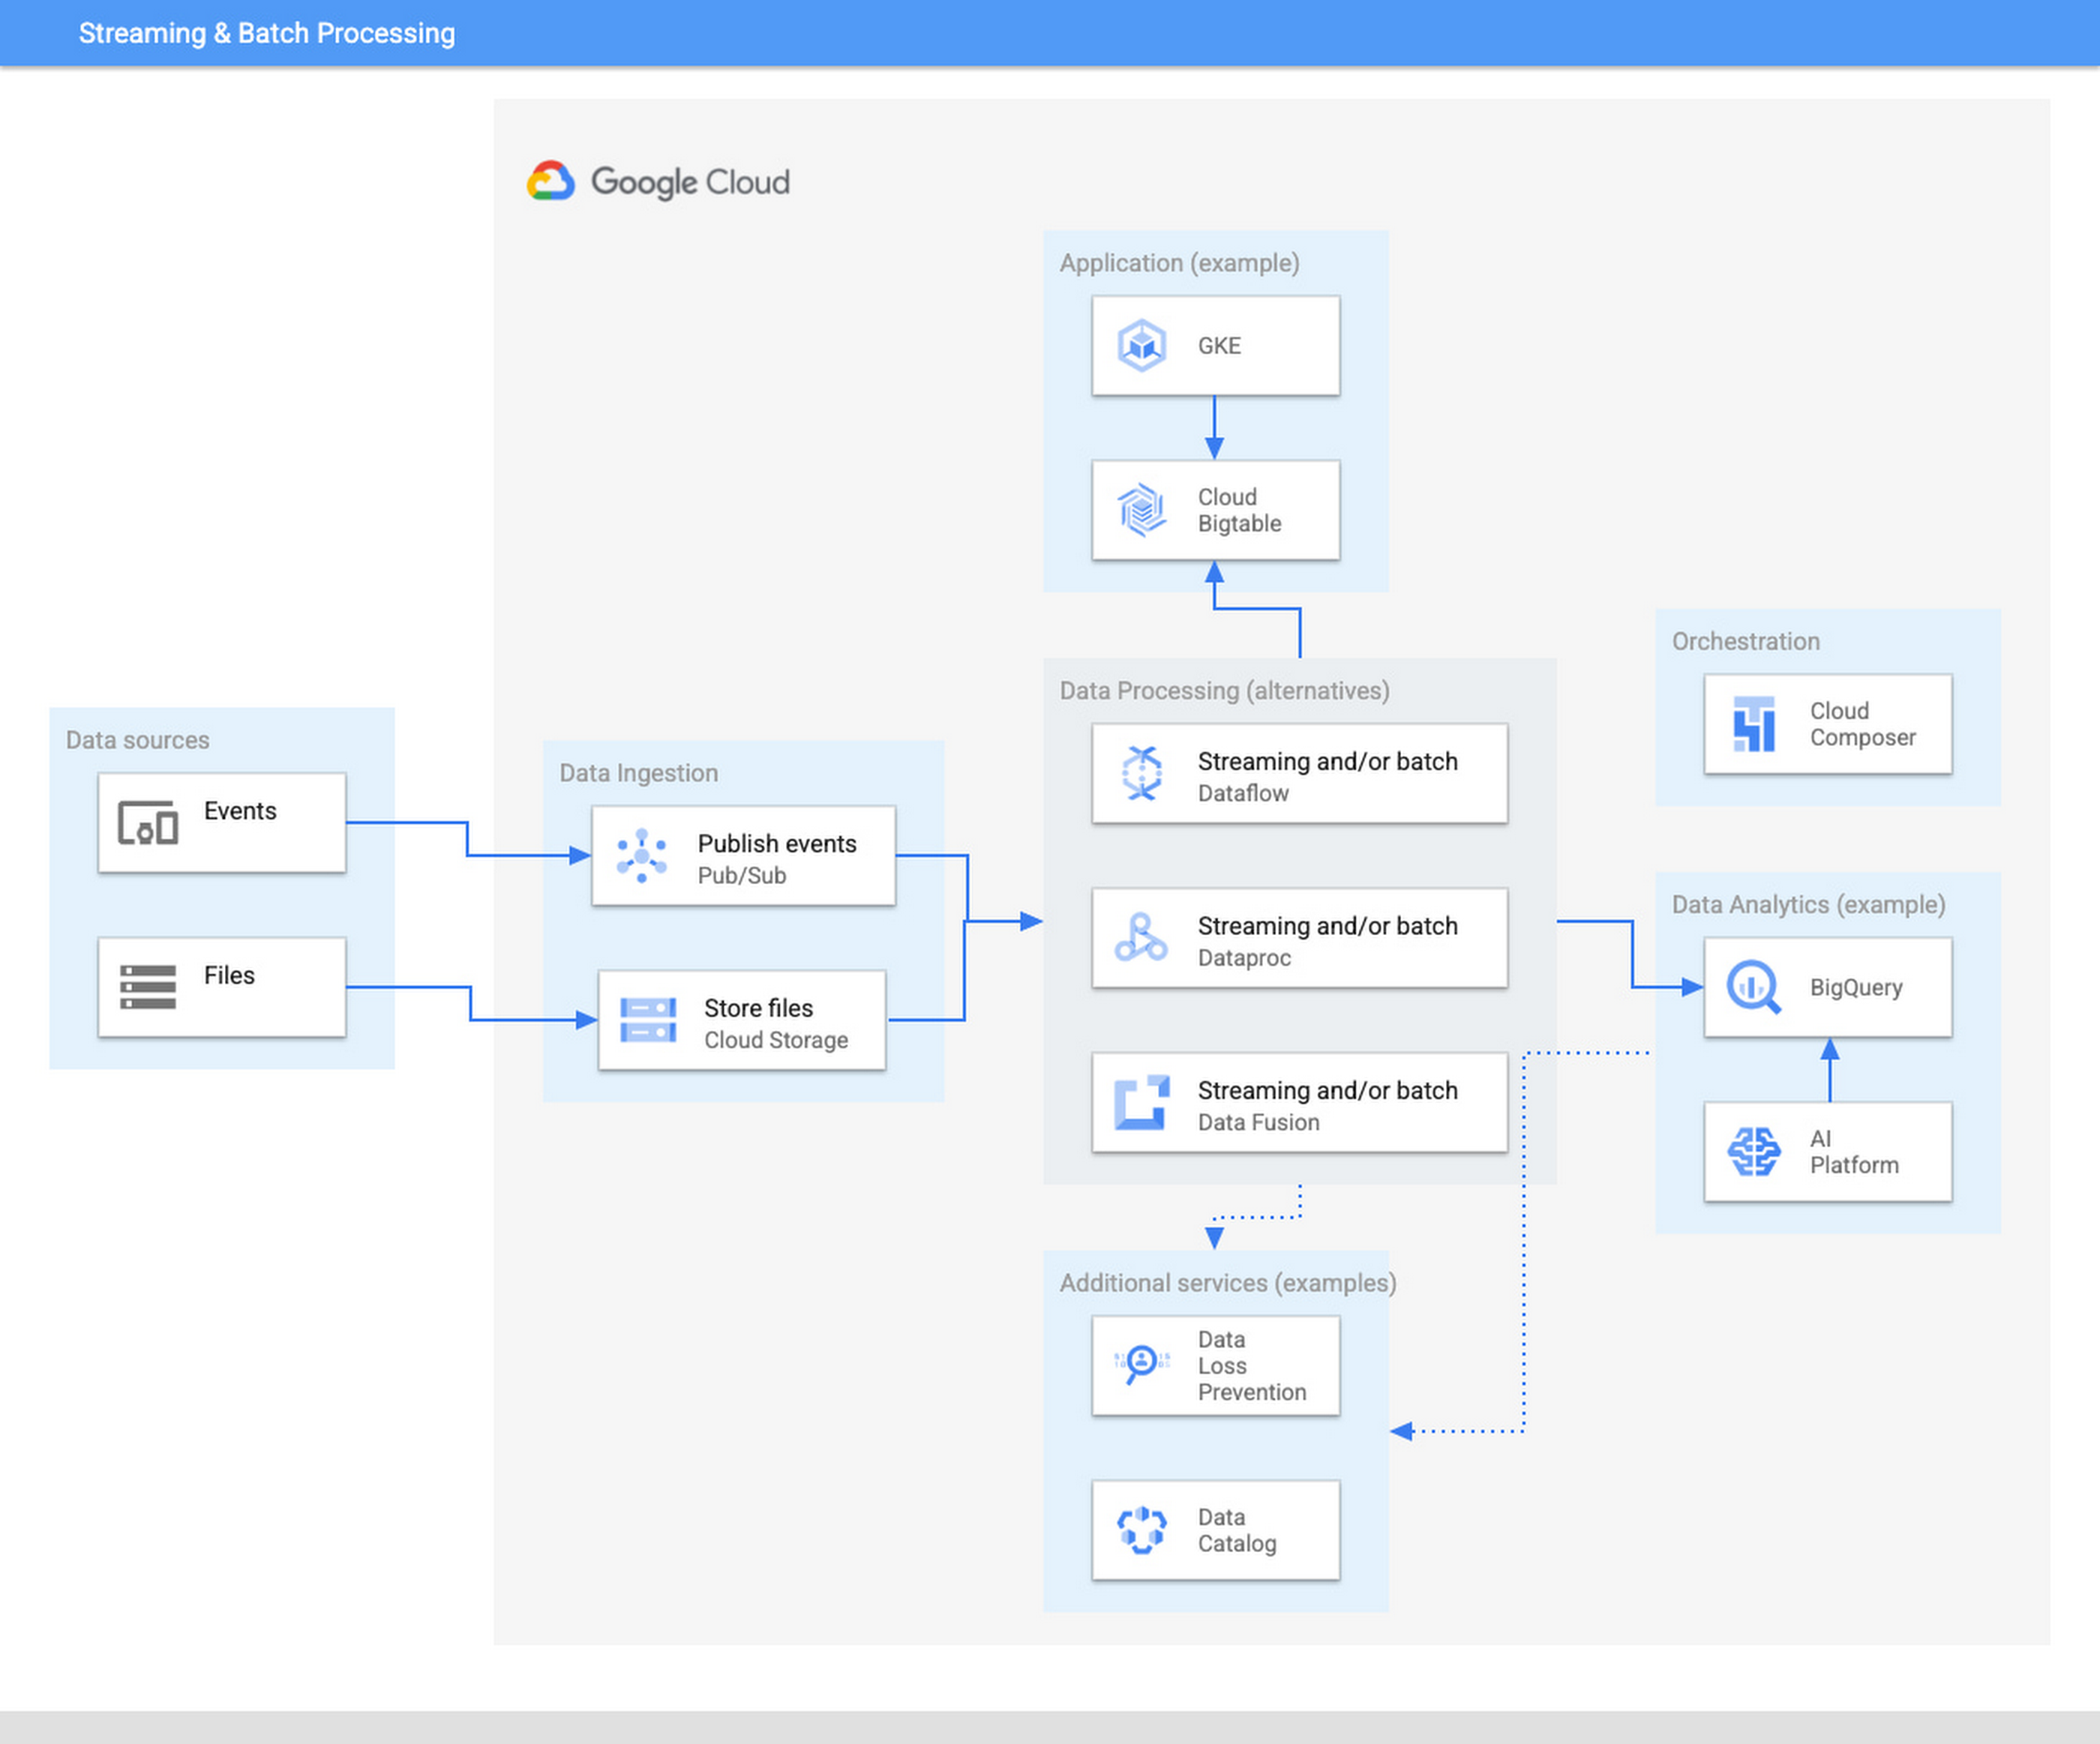
The ingestion layer consists of Pub/Sub for real time and Cloud Storage for batch and does not require any preallocated infrastructure. Both Pub/Sub and Cloud Storage can be used for a range of cases as it can automatically scale up with the input workload.
Once the data has been ingested, our proposed architecture follows the classical division in three stages: Extract, Transform, and Load (ETL). For some types of files, direct ingestion into BigQuery (following an ELT approach) is also possible.
In the transform layer, we primarily recommend Dataflow as the data process component. Dataflow uses Apache Beam as SDK. The main advantage of Apache Beam is the unified model for batch and streaming processing. As mentioned before, the same code can be adapted to run in batch or streaming by adapting input and output. For instance, switching the input from files in Cloud Storage to messages published in a topic in Pub/Sub.
One of the alternatives to Dataflow in this architecture is Dataproc, Google Cloud’s solution for managed Hadoop and Spark clusters. The main use case is for those teams that are migrating to Google Cloud but have large amounts of inherited code in Spark or Hadoop. Dataproc enables a direct path to the cloud, without having to review all those pipelines.
Finally, we also present the alternative of Data Fusion, a codeless environment for creating data pipelines using a drag-and-drop interface. Data Fusion actually uses Dataproc as its Compute Engine, so everything we have mentioned earlier applies also to the case of Data Fusion. If your team prefers to create data pipelines without having to write any code, Data Fusion is the right tool.
So in summary, these are the three recommended components for the transform layer:
- Dataflow, powerful and versatile with a unified model for batch and streaming processing. Straightforward path to move from batch processing to streaming
- Dataproc, for those teams that want to reuse existing code from Hadoop or Spark environments.
- Data Fusion, if your team does not want to write any code.
Challenges and opportunities
Data platforms are complex. Having on top of that data responsibility the duty to maintain infrastructure is a wasteful use of valuable skills and talent. Often data teams end up managing infrastructure rather than focusing on analyzing the data. The architecture presented in this article liberates the data engineering team from having to allocate infrastructure and tweak clusters but instead to focus on providing value through data processing pipelines.
For data engineers to focus on what they do best, you need to fully leverage the cloud. A lift & shift approach from any on-premise installation is not going to provide that flexibility and liberation. You need to leverage serverless technologies. As an added advantage, serverless lets you also scale your data processing capabilities with your needs, and be able to respond to peaks of activity, however large these are.
Serverless technologies sometimes face the doubts of practitioners: will I be locked in with my provider if I fully leverage serverless? This is actually a question that you should be asking when deciding whether to set up your architecture on top of a provider.
The components presented here for data processing are based on open source technologies, and fully interoperable with other open source equivalent components. Dataflow uses Apache Beam, which not only unifies batch and streaming, but also offers a widely compatible runner. You can take your code elsewhere to any other runner. For instance, Apache Flink or Apache Spark. Dataproc is a fully managed Hadoop and Spark based on the vanilla open source components of this ecosystem. Data Fusion is actually the Google Cloud version of CDAP, an open source project.
On the other hand, for the serving layer, BigQuery is based on standard Ansi SQL. Whereas in the case of Bigtable and Google Kubernetes Engine, Bigtable is compatible at API level with HBase, and Kubernetes is an open source component.
In summary, when your components are based on open source, like the ones included in this architecture, serverless does not lock you in. The skills required to encode business logic in the form of data processing pipelines are based on engineering principles that remain stable across time. The same principles apply if you are using Hadoop, Spark, or Dataflow or UI driven ETL tooling. In addition, there are now new capabilities, such as low-latency streaming, that were not available before. A team of data engineers that learn the fundamental principles of data engineering will be able to quickly leverage those additional capabilities.
Our recommended architecture separates the logical level, the code of your applications, from the infrastructure where they run. This enables data engineers to focus on what they do best and on where they provide the highest added value. Let your Dataflow and your engineers impact your business, by adopting the technologies that liberate them and allow them to focus on adding business value. To learn more about building an unified data analytics platform, take a look at our recently published Unified Data Analytics Platform paper and Converging Architectures paper.
Unifying Data and AI: Bringing Unstructured Data Analytics to BigQuery

4185
Of your peers have already read this article.
2:30 Minutes
The most insightful time you'll spend today!
Over one third of organizations believe that data analytics and machine learning have the most potential to significantly alter the way they run business over the next 3 to 5 years. However, only 26% of organizations are data driven. One of the biggest reasons for this gap is that a major portion of the data generated today is unstructured, which includes images, documents, and videos. It is estimated to cover roughly up to 80% of all data, which has so far remained untapped by organizations.
One of the goals of Google’s data cloud is to help customers realize value from data of all types and formats. Earlier this year, we announced BigLake, which unifies data lakes and warehouses under a single management framework, enabling you to analyze, search, secure, govern and share unstructured data using BigQuery.
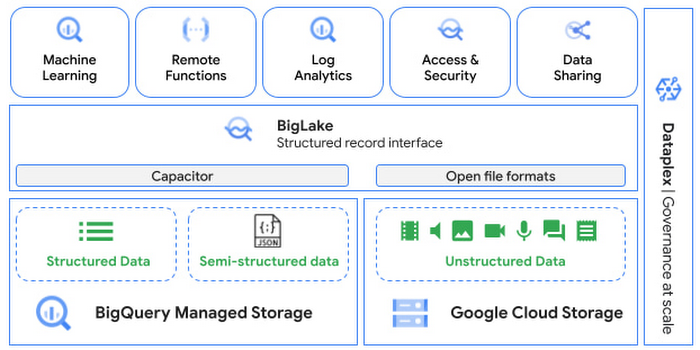
At Next ‘22, we announced the preview of object tables, a new table type in BigQuery that provides a structured record interface for unstructured data stored in Google Cloud Storage. This enables you to directly run analytics and machine learning on images, audio, documents and other file types using existing frameworks like SQL and remote functions natively in BigQuery itself. Object tables also extend our best practices of securing, sharing and governing structured data to unstructured, without needing to learn or deploy new tools.
Directly process unstructured data using BigQuery ML
Object tables contain metadata such as URI (Uniform Resource Identifier), content type, and size that can be queried just like other BigQuery tables. You can then derive inferences using machine learning models on unstructured data with BigQuery ML. As part of preview, you can import open source TensorFlow Hub image models, or your own custom models to annotate the images. Very soon, we plan to enable this for audio, video, text and many other formats, and pre-trained models to enable out-of-the box analysis. Check out this video to learn more and watch a demo.
Create an object table
CREATE EXTERNAL TABLE my_dataset.object_table
WITH CONNECTION us.my_connection
OPTIONS(uris=["gs://mybucket/images/*.jpg"],
object_metadata="SIMPLE", metadata_cache_mode="AUTOMATIC");
# Generate inferences with BQML
SELECT * FROM ML.PREDICT(
MODEL my_dataset.vision_model,
(SELECT ML.DECODE_IMAGE(data) AS img FROM my_dataset.object_table)
);By analyzing unstructured data natively in BigQuery, businesses can
- Eliminate manual effort as pre-processing steps such as tuning image sizes to model requirements are automated
- Leverage the simple and familiar SQL interface to quickly gain insights
- Save costs by utilizing existing BigQuery slots without needing to provision new forms of compute
Adswerve is a leading Google Marketing, Analytics and Cloud partner on a mission to humanize data. Twiddy & Co. is Adswerve’s client – a vacation rental company in North Carolina. By combining structured and unstructured data, Twiddy and Adswerve used BigQuery ML to analyze images of rental listings and predict the click-through rate, enabling data-driven photo editorial decisions.
“Twiddy now has the capability to use advanced image analysis to stay competitive in an ever changing landscape of vacation rental providers – and can do this using their in-house SQL skills.” said Pat Grady, Technology Evangelist, Adswerve
Process unstructured data using remote functions
Customers today use remote functions (UDFs) to process structured data for languages and libraries that are not supported in BigQuery. We are extending this capability to process unstructured data using object tables.
Object tables provide signed URLs to allow remote UDFs running on Cloud Functions or Cloud Run to process the object table content. This is particularly useful for running Google’s pre-trained AI models, including Vision AI, Speech-to-Text, Document AI, open source libraries such as Apache Tika, or deploying your own custom models where performance SLAs are important.
Here’s an example of an object table being created over PDF files that are parsed using an open source library running as a remote UDF.
SELECT uri, extract_title(samples.parse_tika(signed_url)) AS title<br>FROM EXTERNAL_OBJECT_TRANSFORM(TABLE pdf_files_object_table,<br>["SIGNED_URL"]);
Extending more BigQuery capabilities to unstructured data
Business intelligence – The results of analyzing unstructured data either directly in BigQuery ML or via UDFs can be combined with your structured data to build unified reports using Looker Studio (at no charge), Looker or any of your preferred BI solutions. This allows you to gain more comprehensive business insights. For example, online retailers can analyze product return rates by correlating them with the images of defective products. Similarly, digital advertisers can correlate ad performance with various attributes of ad creatives to make more informed decisions.
BigQuery search index – Customers are increasingly using the search functionality of BigQuery to power search use cases. These capabilities now extend to unstructured data analytics as well. Whether you use BigQueryML to produce inference on images or use remote UDFs with Doc AI to produce document extraction, the results can now be search indexed and used to support search access patterns.
Here’s an example of search index on data that is parsed from PDF files:
CREATE SEARCH INDEX my_index ON pdf_text_extract(ALL COLUMNS);
SELECT * FROM pdf_text_extract WHERE SEARCH(pdf_text, "Google");Security and governance – We are extending BigQuery’s row-level security capabilities to help you secure objects in Google Cloud Storage. By securing specific rows in an object table, you can restrict the ability of end users to retrieve the signed URLs of corresponding URIs present in the table. This is a shared responsibility security model, for which administrators need to ensure that end users don’t have direct access to Google Cloud Storage, and use signed URLs from object tables as the only access mechanism.
Here’s an example of a policy for PII images that are secured to be first processed through a blur pipeline:
CREATE ROW ACCESS POLICY pii_data ON object_table_images
GRANT TO ("group:admin@example.com")
FILTER USING (ARRAY_LENGTH(metadata)=1 AND
metadata[OFFSET(0)].name="face_detected")
Soon, Dataplex will support object tables, allowing you to automatically create object tables in BigQuery and manage and govern unstructured data at scale.
Data sharing – You can now use Analytics Hub to share unstructured data with partners, customers and suppliers while not compromising on security and governance. Subscribers can consume the rows of object tables that are shared with them, and use signed URLs for unstructured data objects.
Getting Started
Submit this form to try these new capabilities that unlock the power of your unstructured data in BigQuery. Watch this demo to learn more about these new capabilities.
Special thanks to engineering leaders Amir Hormati, Justin Levandoski and Yuri Volobuev for contributing to this post.
Datashare for Financial Services: Securing the Publishers and Consumers’ Access to Market Data

8593
Of your peers have already read this article.
4:30 Minutes
The most insightful time you'll spend today!
Access to the cloud has advanced the distribution and consumption of financial information on a global scale. In parallel, the global financial data landscape has been transformed by an influx of alternative data sources, including social media, meteorological data, satellite imagery, and other data. Exchanges and market data providers now find they need to include these new datasets to enrich their products and compete, which has meant they now must consider cloud-based models to keep up with the demands of their customers who expect easy, quick, flexible and cost-efficient ways to consume market data.
To address these needs, today we’re announcing the general availability of Datashare for financial services, a new Google Cloud solution that brings together the entire capital markets ecosystem—data publishers, and data consumers—to exchange market data securely and easily.
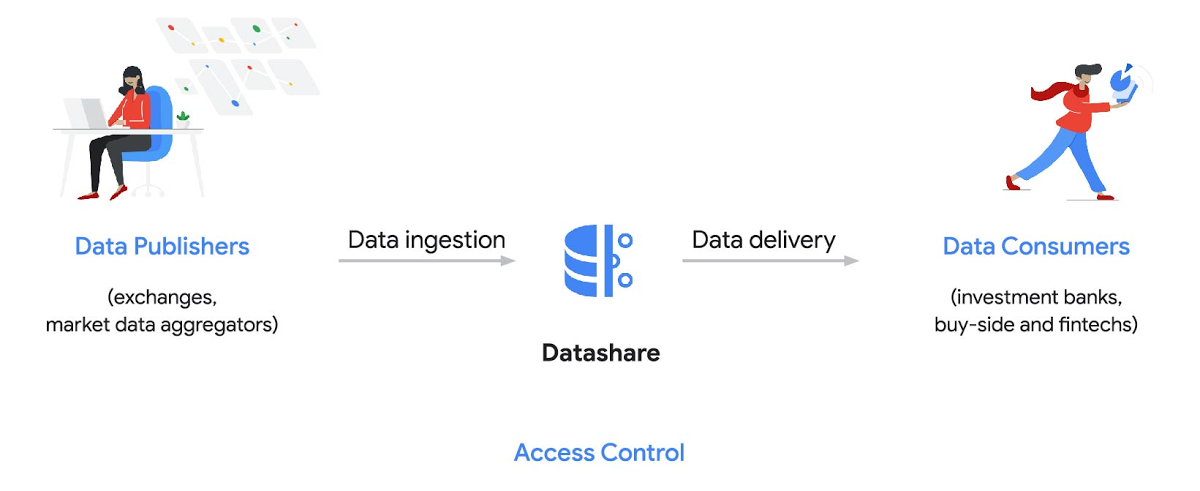
Datashare helps organize third-party financial information, making it accessible and useful to market data publishers and data consumers. We open-sourced the entire Datashare solution so market data publishers can now onboard their licensed datasets to Google Cloud securely, quickly and easily, while data consumers can consume that data as a service in tools of their preference, such as BigQuery.
Three ways to distribute and consume your data
Batch data delivery
Datashare provides a batch data delivery mechanism for data publishers to deliver their reference data, historical tick data, alternative market data sources and more via BigQuery, reducing the administrative burden on data consumers to extract insights from data.
Real-time data streaming delivery
By using this event-based data delivery channel for rapidly changing instrument prices, tick data, orders, news and others via Pub/Sub, data consumers can reliably process individual messages or rewind to a point in time to replay a prior market scenario and test model changes.
Monetizing licensed datasets
Market data publishers can onboard their licensed datasets to Google Cloud and make them available via a one-stop-shop on Google Cloud Marketplace, enabling a new sales channel to expand market reach.
Reference architecture
Check out the diagram below to see how you can share your batch and real-time data directly to your Google Cloud customers with BigQuery and Pub/Sub.

As you can see in the above reference architecture, both publishers and consumers can derive several benefits from the solution:
Benefits for data publishers
- You no longer have to maintain your own delivery and licensing infrastructure.
- You can easily package and deliver granular data products and experiments with SQL.
- You can have a solution that scales with your business as data volumes and number of customers grow.
Benefits for data consumers
- Your data is ready for analysis and machine learning (ML)— you no longer have to maintain extract, transform, and load (ETL) pipelines to load files and transform data.
- You can avoid the expense and burden of maintaining multiple copies of large data files.
- You can be more targeted with consumption of data using BigQuery queries, improving performance, and compliance, and reducing cost.
Accessing the datasets
Google Cloud has been working with multiple industry firms on innovating in the market data space. By using Datashare for publishing, data publishers can make their entire datasets available on Google Cloud. Early adopters of Datashare include firms such as OneTick and Accern. OneTick’s datasets include reference and historical futures data (that can be accessed in our console with your login). Accern’s datasets include alternative data such as market sentiment and credit analysis data (that can be accessed in our console with your login).
To make it more helpful, we partnered with Accern to create a hypothetical scenario to describe the data acquisition and analytics process step-by-step.
Accern use case
As a sustainability analyst, you require an economic, social and governance (ESG) dataset to determine which sector is the most widely covered ESG sector by analysts, and to also identify the sector with the lowest ESG sentiment score. Now, you can discover and acquire an ESG dataset in Google Cloud.
Step 1. Navigate to the Financial Services solutions page in the Google Cloud console:

Step 2. Click a dataset, for example Accern AI-Generated ESG Insights, then review the overview details, plans and pricing, documentation and support information. To view the available pricing tiers, click ‘View All Plans’. Once you’ve decided on a tier that you would like to subscribe to, click ‘Select’, choose a billing account and review and accept the terms of service to complete the subscription. Once the steps are complete, click ‘Subscribe’ at the bottom. An overlay window will appear, click ‘Register with Accern’ to activate and complete the subscription.
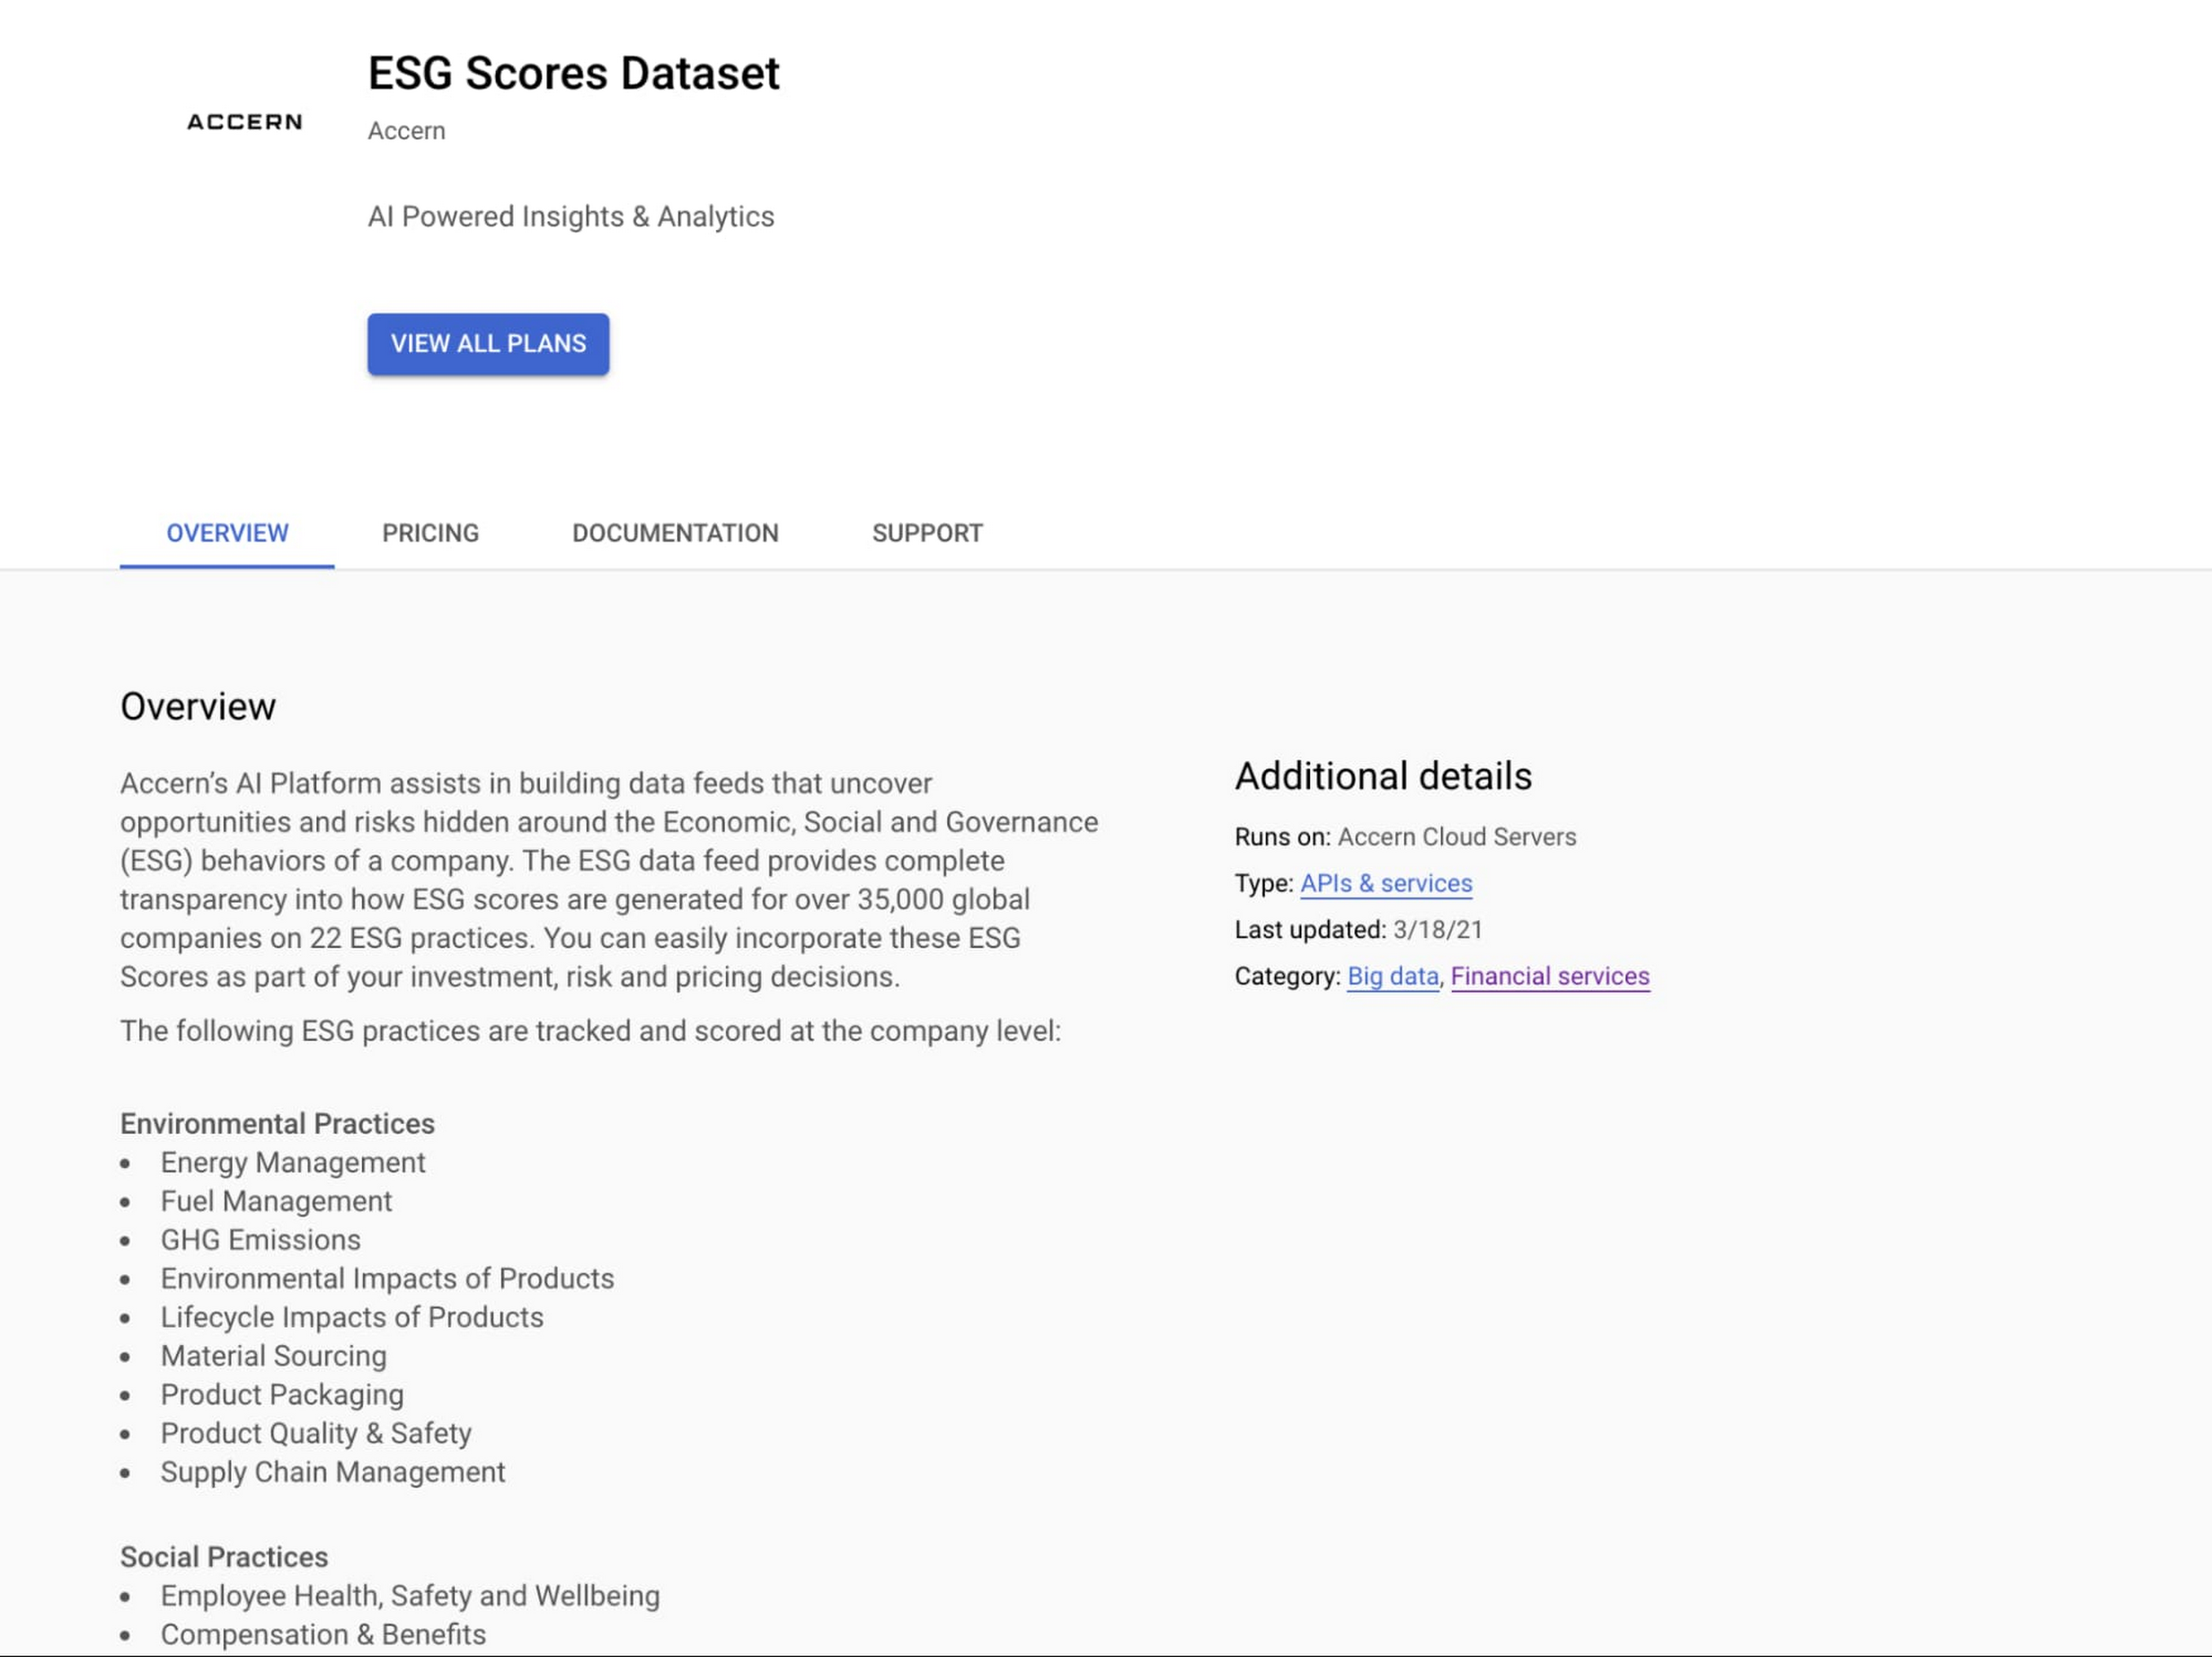

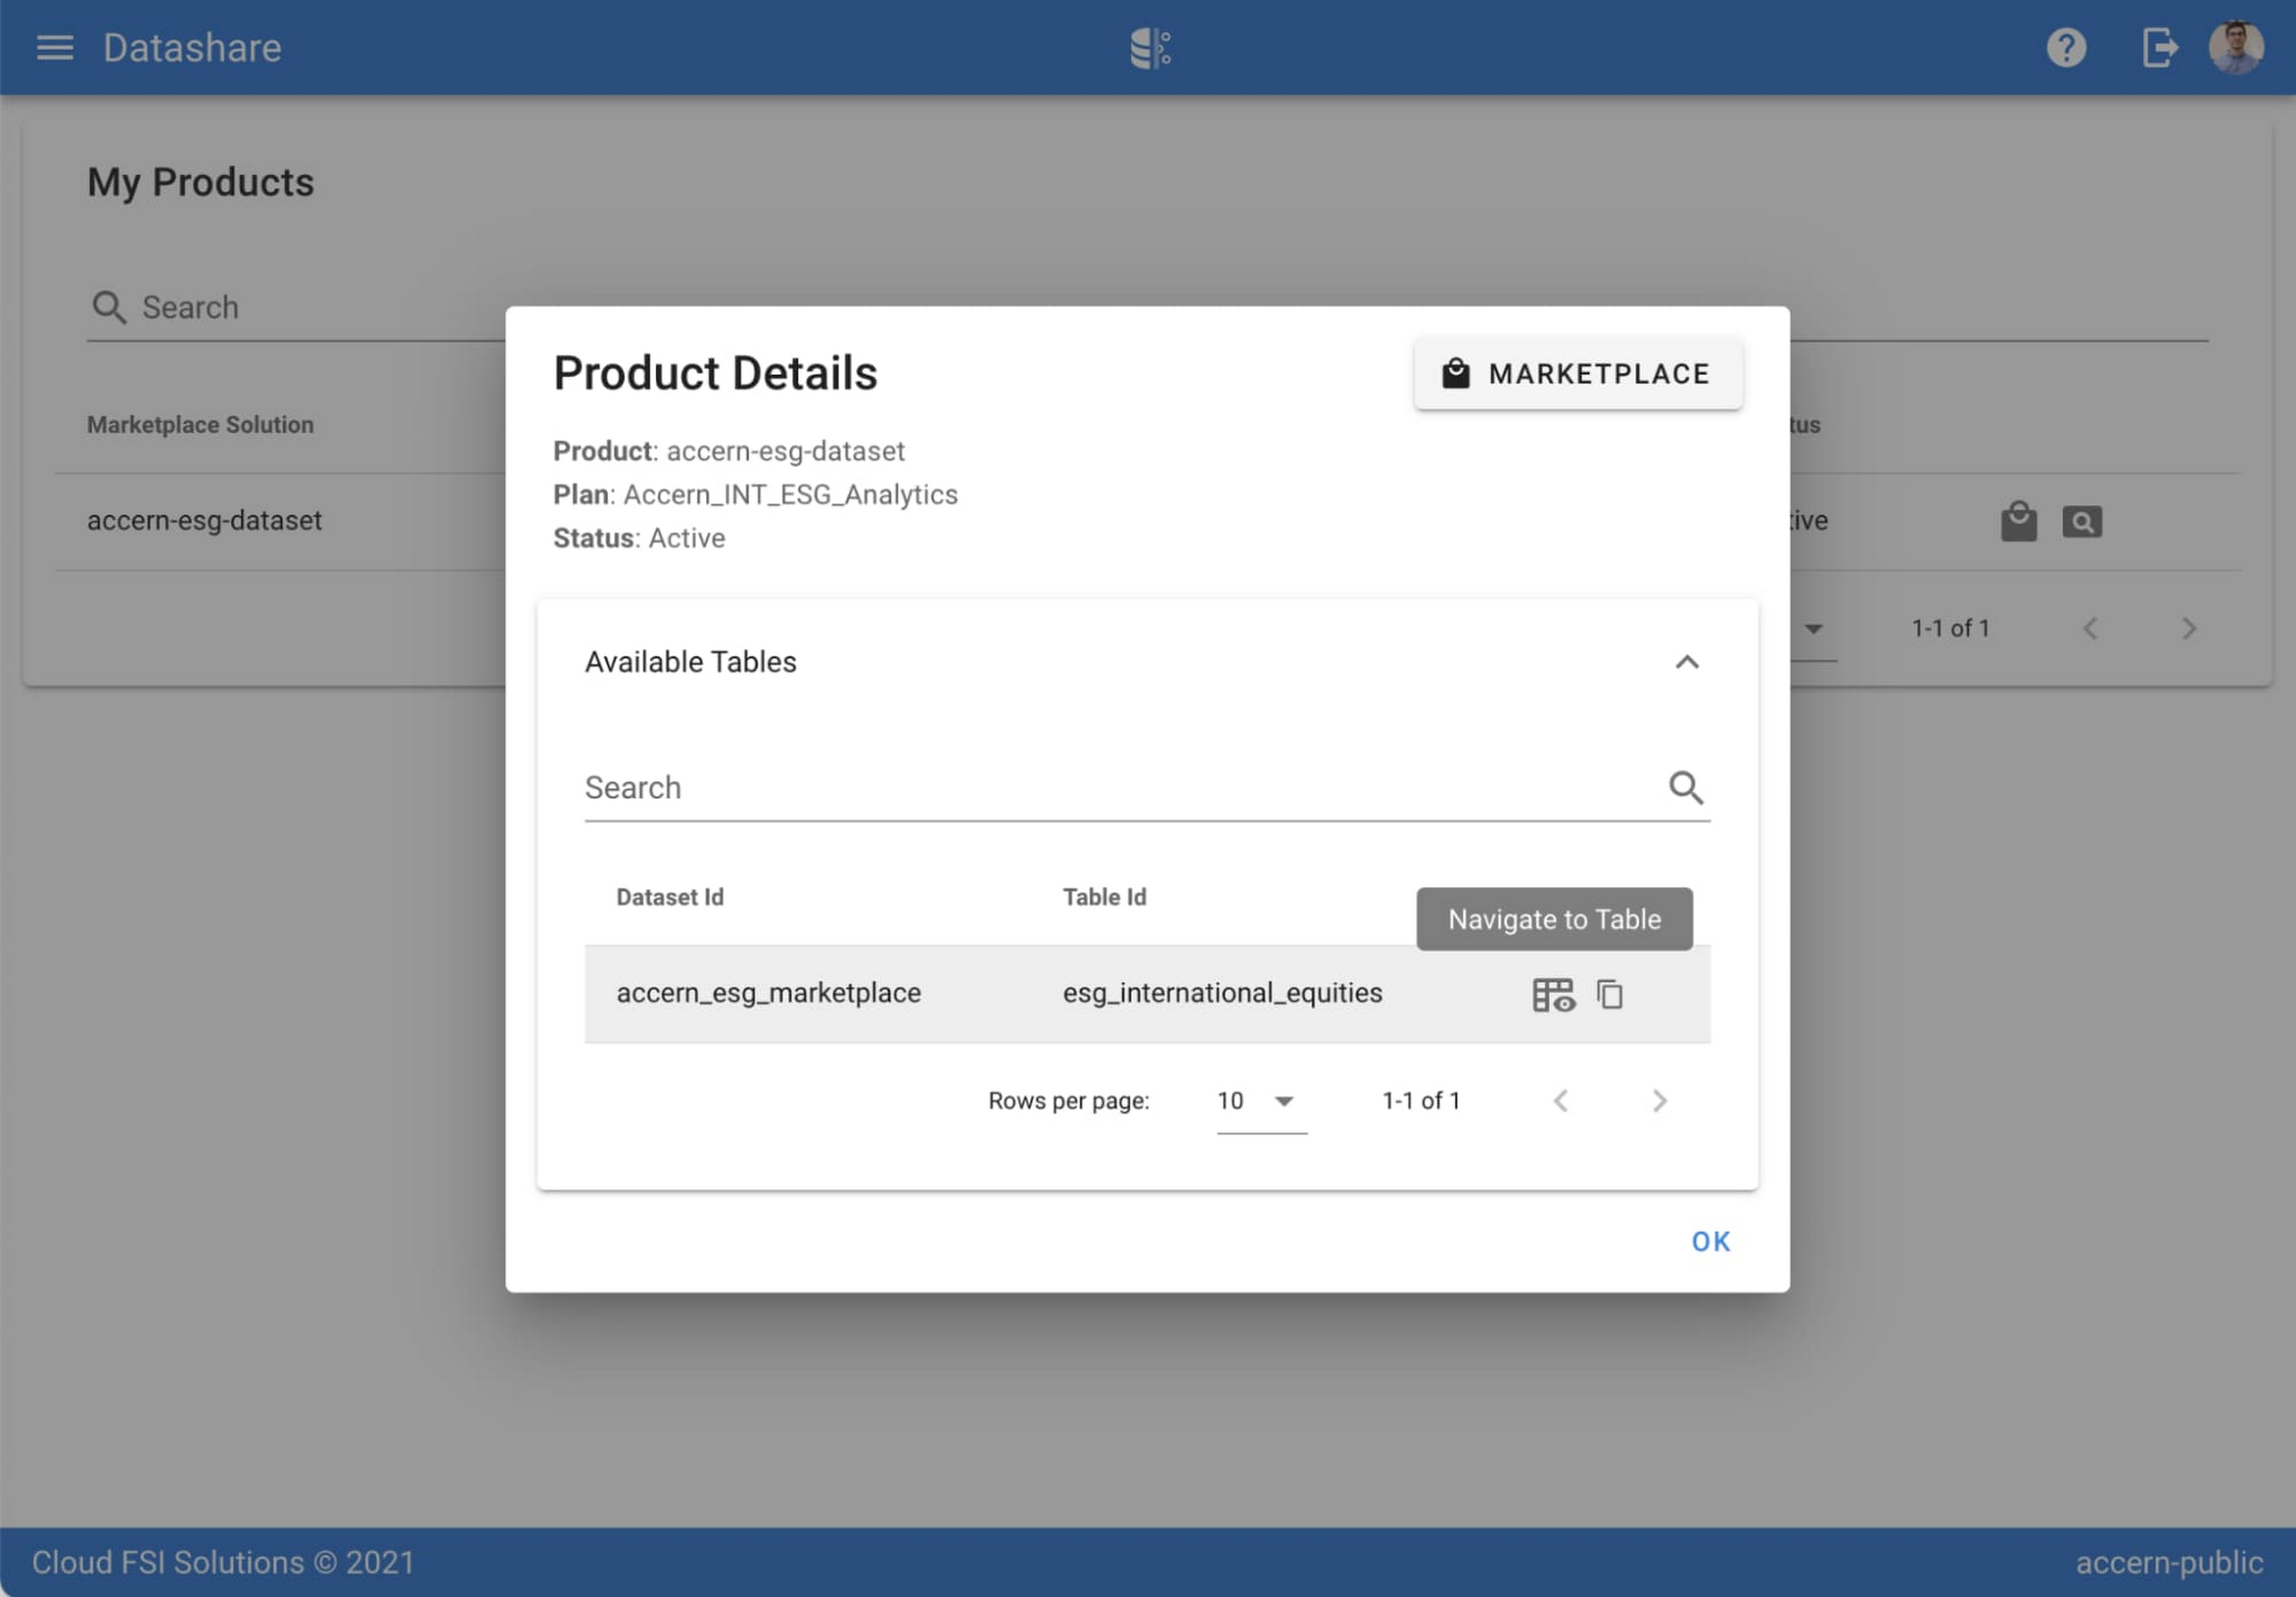
Step 3. Once activation is complete, you’ll be directed to the Datashare ‘My Products’ screen. Voila! You are now subscribed to Accern’s ESG Scores dataset and can access it in your Google Cloud instance using BigQuery. To access the data, click the hour glass icon on the corresponding ‘My Products’ record that you just purchased. An overlay will present you with the details on the dataset and/or table. Click the ‘Navigate to Table’ button to navigate through to the BigQuery console.


Step 4. Now that you have access and are in the BigQuery console, it’s time to generate data insights.
For this example, we’ve eliminated the company identifying information that is included as part of the subscription and aggregated company ESG in a view where each row represents a day, an industry sector, a specific identified ‘ESG Issues’ (event_group and event) and the respective ‘ESG Sentiment’ per issue.

For example, row 1 indicates that within the ‘Healthcare’ sector, there was a ‘Social – Civil Society’ issue identified and it had a negative ESG sentiment score of -15.35.
Step 5. Generate a report by exporting it to Data Studio to build visualizations and conduct additional analysis on the ESG data.
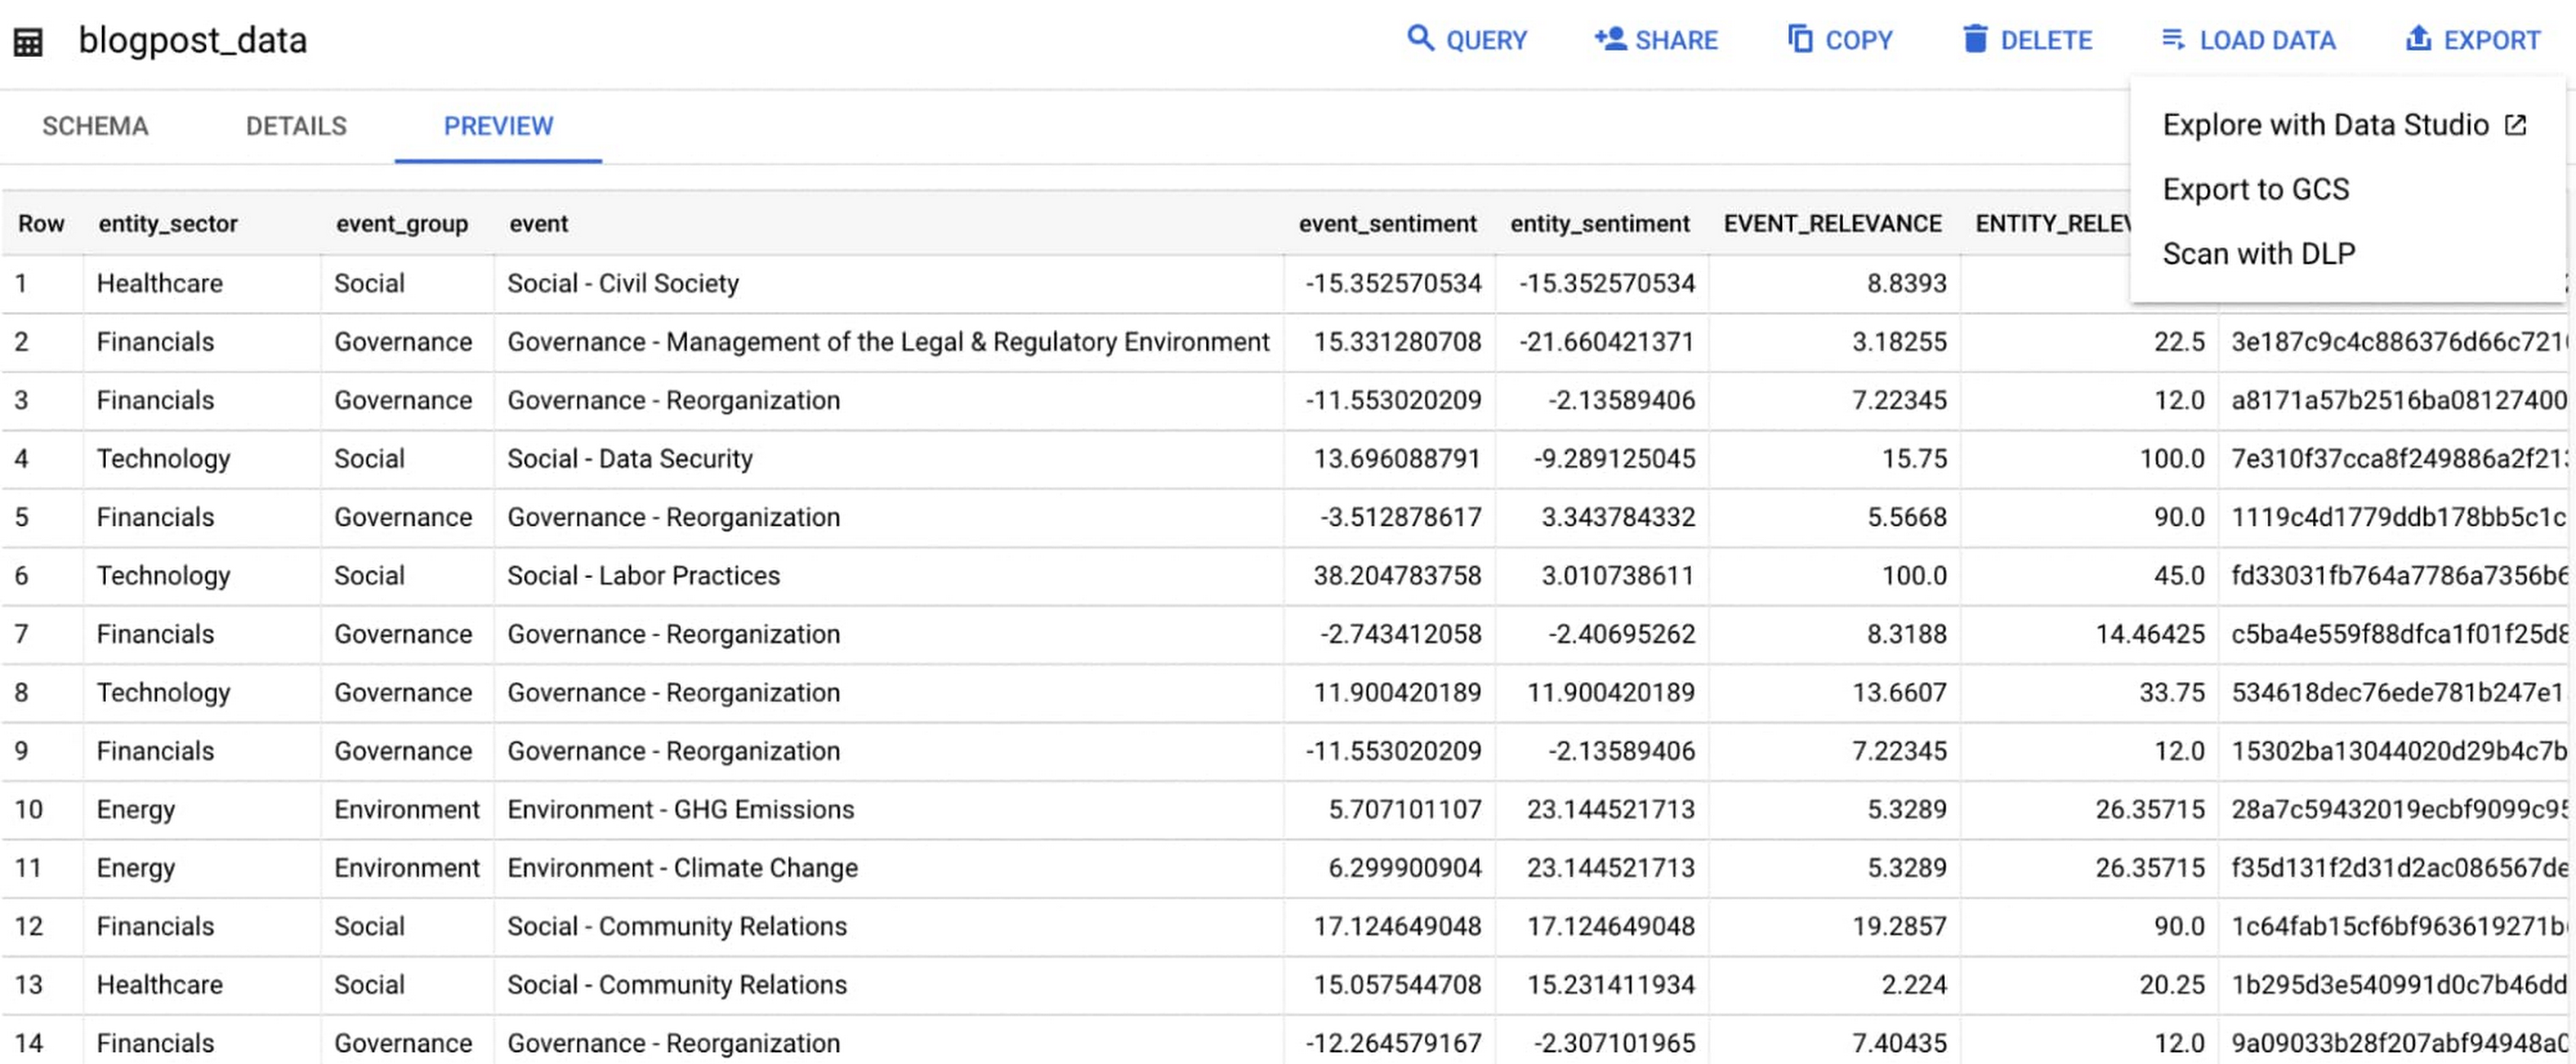
Select ‘Export’ and ‘Explore with Data Studio’.
Step 6. Build a simple/basic report.
Now that the ESG data appears in Data Studio, you can start by building a simple chart to help you understand which industry sectors have the highest volume of discussions around ESG and the overall ESG Sentiment per industry sector.
To build the chart:
- Select the chart type ‘Table’.
- Include
Entity_Sectoras your dimension to aggregate results by ‘Industry Sector.’ - Include
Signal_IDas a measure to count the number of ESG passages identified per ‘Industry Sector.’ - Include
AVG(Event_Sentiment)as a measure to display the overall ESG Sentiment per ‘Industry Sector’ across ESG Issues.

You can see sectors that are most discussed when it comes to ESG related topics and their corresponding ‘ESG Sentiment’ scores.
Step 7. Build your final report in Data Studio.
As a next step you can further drill into the data to understand ESG data specific to each ‘Industry Sector’ and identify positive and negative ESG practices.
Accern has built a more complex sample dashboard and made it available publicly here. You can interact with this report and play around with the data. The dashboard can help to identify material ESG insights for each sector to inform your investment and risk processes. If you have additional questions, you can reach out to Accern directly.

Discovering, accessing and analyzing licensed datasets is quick and easy. Stay tuned for more updates on new licensed datasets.
Publishing your data via Datashare
If you are a publisher of market data, alternative, or exotic data, you can use Datashare to get it published on Google Cloud Marketplace.
Start by joining the Partner Advantage program by registering for the Partner Advantage Portal and applying for the Partner Advantage Build Model engagement. Visit our getting started guide for information to get started on publishing licensed datasets in the Marketplace. Stay tuned for a future blog post about using Datashare to publish datasets in the Marketplace.
More solutions for capital markets
Check out other Google Cloud solutions for capital markets.
New Enterprise Capabilities and Changes to Cloud Spanner Reduces Cost of Running Workloads by 90 Percent

5404
Of your peers have already read this article.
3:00 Minutes
The most insightful time you'll spend today!
Customers love Cloud Spanner because it gives them the benefits of relational semantics and SQL while also delivering the scale and availability of non-relational databases. Many of these customers want to move even more of their work to Spanner, and have requested smaller instance sizes to support development, testing and small production workloads. We’re happy to announce that they’ll soon get what they asked for: more granular instance sizing is coming to Spanner.
Granular instance sizing will be available in Public Preview soon. With this feature, you can run workloads on Spanner at as low as 1/10th the cost of regular instances, equating to approximately $65/month.
In addition, we are launching new enterprise capabilities to break down operational silos for real-time insights and provide greater database observability to developers:
- Datastream, now in public preview, is a change data capture (CDC) service that allows enterprises to synchronize data across heterogeneous databases and applications. With Spanner support in Datastream, users will be able to stream data from MySQL or Oracle to Spanner reliably and with minimal latency.
- BigQuery federation to Spanner (coming soon) lets users query transactional data residing in Spanner, from BigQuery, without moving or copying data.
- Key Visualizer, available now in public preview, provides interactive monitoring so developers can quickly identify trends and usage patterns in Spanner.
Democratizing access with more granular instance sizing
Today, customers provision Spanner instances by specifying the number of nodes they need to run their workloads. Each node can provide up to 10,000 queries per second (QPS) of reads or 2,000 QPS of writes (writing single rows at 1 KB of data per row) and 2 TB of storage. A Spanner node is replicated across 3 zones for regional instances, and 5 or more zones for multi-regional instances. The choice of node count determines the amount of serving and storage resources that are available to the databases in a given instance.
Historically, the most granular unit for provisioning resources on Spanner has been one node. To enable more granular control, we are introducing Processing Units (PUs); one Spanner node is equal to 1,000 PUs. Customers can now provision in batches of 100 PUs, and get a proportionate amount of compute and storage resources. This will allow teams to run smaller workloads on Spanner at much lower cost. With this feature, customers can start at 100 PUs and scale up as needed in batches of 100 PUs, to up to 1,000 PUs (1 node), all with zero downtime. Subsequently, customers can continue to scale up by adding more nodes, just like what they do today. Customers do have the choice of using either PUs or nodes to provision resources within workloads, when those workloads occupy multiple nodes of capacity.
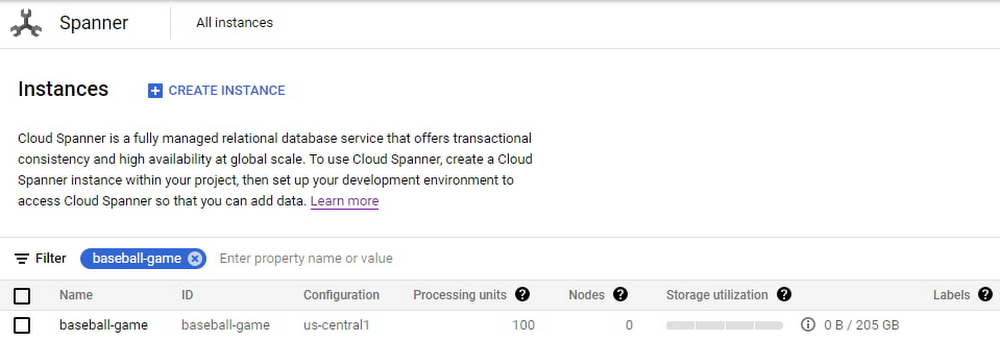
To illustrate with an example, let’s say a game developer creates a Spanner instance called “baseball-game” in us-central1, with 100 PU compute capacity at $65/month price.
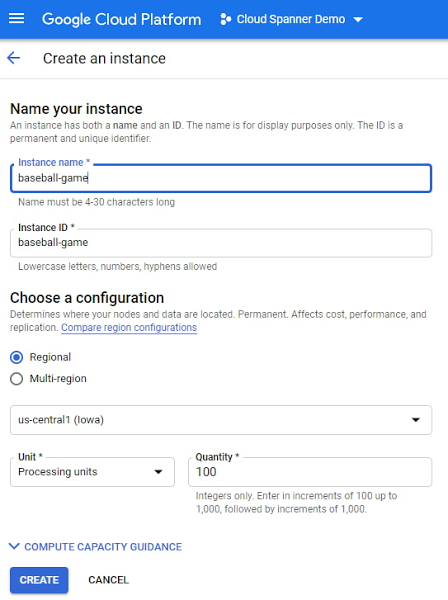
As you can see below, proportional maximum storage of 205 GB is assigned to the 100 PU instance.
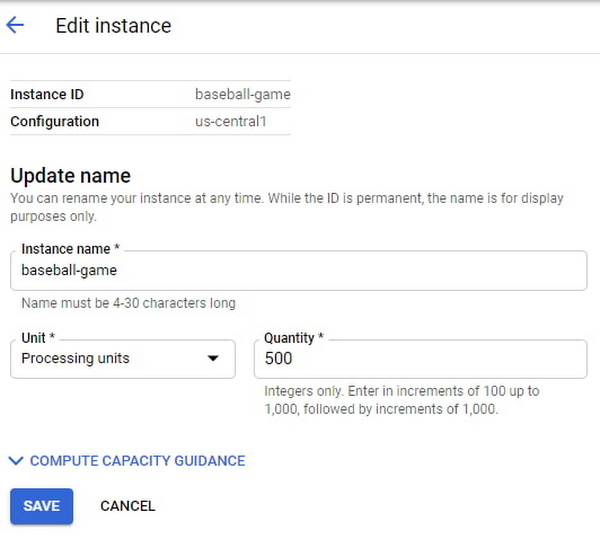
Once the game starts becoming popular and resource demands increase, the user edits the instance to increase the compute capacity to 500 PUs with proportional maximum 1 TB of storage.
The game grows in popularity, and the gaming company prepares to launch a much-awaited capability in the game. Anticipating a sharp increase in usage at launch day, the game developers increase the compute capacity to 3,000 PUs. Compute capacity assigned to the instance over a period of time can be viewed in Cloud Monitoring graphs:

Request Access
You can request early access to granular instance sizing feature by filling this form.
Breaking down operational silos with Datastream CDC and BigQuery federation
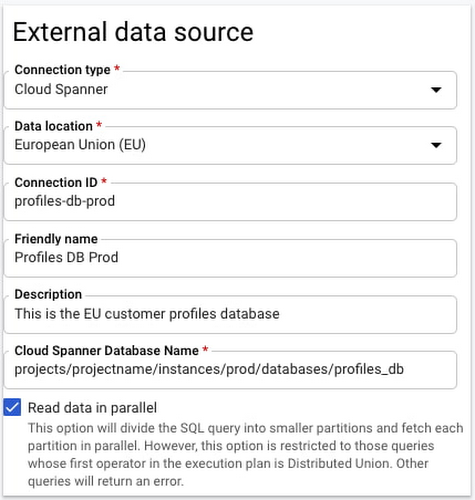
BigQuery Federation. BigQuery has made analytics easy by bringing together data from multiple sources for seamless analysis. Soon you’ll also be able to analyze data in Spanner directly in BigQuery. With Spanner’s BigQuery federation, you’ll be able to instantly query data residing in Spanner in real-time without moving or copying the data. Simply set up the Spanner as an external data source in BigQuery, as shown below.
Change Data Capture ingest. Now in public preview, Datastream lets you stream change data into Google Cloud from MySQL and Oracle databases. As of today, you can ingest this change data directly into Spanner using a built-in Dataflow template. This lets you migrate data from MySQL and Oracle databases into Spanner in near-real time.
Understanding performance and resource usage with Key Visualizer
Key Visualizer is a new interactive monitoring tool that lets developers and administrators analyze usage patterns in Spanner. It reveals trends and outliers in key performance and resource metrics for databases of any size, helping to optimize queries and reduce infrastructure costs. Designed for performance tuning and instance sizing, Key Visualizer is available today in public preview in the web-based Cloud Console for all Spanner databases at no additional cost. Learn more in the Key Visualizer blog.
Learn more
- To request early access to granular instance sizing in Spanner, fill out this form.
- To get started with Spanner today, create an instance or try it out with a Spanner Qwiklab.
Become Truly Data-driven with Unified Analytics Platform Built on Google Cloud

3676
Of your peers have already read this article.
2:00 Minutes
The most insightful time you'll spend today!
Every company these days is becoming a data company whether they know it or not. This results in preparing the company to create an ecosystem for data processing. Traditionally, organisations’ data ecosystems consisted of point solutions that used to provide data services. For example, one of the most common questions we get from customers is, “Do I need a data lake, or should I consider a data warehouse? Do you recommend I consider both?” Traditionally, these two architectures have been viewed as separate systems, applicable to specific data types and user skill sets. Increasingly, we are seeing a blurring of lines between data warehouses and data lakes, which provide customers with an opportunity to create a more comprehensive platform that gives them the best of both worlds.
What if we don’t need to compromise? And we create an end-to-end solution compromising the entire data management and processing stages, from data collection to serving. Thus, Data platforms are typically used to store vast amounts of data in varying formats and doing so without compromising on latency. At the same time, providing a platform for all users throughout the data lifecycle.
Emerging Trends
There are data solutions and architectures we’re seeing and anticipating. Emerging concepts include data lakehouses, data meshes, and data vaults. Some are not new and have been around in different shapes and formats, however, all of them work naturally within a Google Cloud environment. Lets look into both ends of the spectrum of enabling data and enabling teams.
Data mesh facilitates a decentralized approach to data ownership, allowing individual lines of business to publish and subscribe to data in a standardized manner, instead of forcing data access and stewardship through a single, centralized team. On the other hand, a data lake house brings raw and processed data closer together, allowing for a more streamlined and centralized repository of data needed throughout the organization. Processing can be done in transit via ELT, reducing the need to copy datasets across systems. This allows for easier data exploration and easier governance. Data vault is designed to separate data driven and model driven parts, so the way data is integrated in the raw vault enables parallel loading so that large implementations can scale out easily.
In Google Cloud, there is no need to keep them separate. In fact, with interoperability among our portfolio of data analytics products, you can easily provide access to data residing in different places, effectively bringing your data lake and data warehouse together on a single platform.
Let’s look at some of the technological innovations that make this reality. BigQuery’s storage API allows treating a data warehouse like a data lake, letting you access the data residing in BigQuery. For example, you can use Spark to access data residing in the data warehouse without it affecting performance of any other jobs accessing it. This is all made possible by the underlying architecture, which separates compute and storage.
We continue to offer specialized products and solutions around data lake and data warehouse functionality but over time we expect to see a significant enough convergence of the two systems that the terminology will change. At Google Cloud, we consider this combination an “analytics data platform”.
Tactical or Strategical
Key differentiators of Google Cloud’s data analytics platform are being open, intelligent, flexible, and tightly integrated. There are many technologies in the market which provide tactical solutions that may feel comfortable and familiar. However, this can be a rather short-term approach that simply lifts and shifts a siloed solution into the cloud. In contrast, an analytics data platform built on Google Cloud provides modern data warehousing and data lake capabilities with close integration to our AI Platform. It also provides built-in streaming, ML, and geospatial capabilities and an in-memory solution for BI use cases. Depending on your organizational data needs, Google Cloud has the set of products, tools, and services to create the right data platform for you.
To become a truly data-driven organization, the first step is to design and implement an analytics data platform that meets your technical and business needs. Whether you want to empower teams to own, publish, and share their data across the organization, or you want to create a streamlined store of raw and processed data for easier discovery, there is a solution that best meets the needs of your company.
To learn more about the elements of a unified analytics data platform built on Google Cloud, and the differences in platform architectures and organizational structures, read our Unified Analytics Platform paper.
Unlock Powerful Insights: Monitor Cloud Expenses with BigQuery’s Data Export

1312
Of your peers have already read this article.
1:30 Minutes
The most insightful time you'll spend today!
TL;DR – Regular file export for Google Cloud billing is going away on May 15th! Try out this interactive tutorial to set up exporting and explore your billing data with BigQuery
You may have seen an email from Google Cloud reminding you to set up billing data export to BigQuery, and letting you know that file export options are going away. More specifically:
Starting May 15, 2023, your daily usage and cost estimates won’t be automatically exported to a Cloud Storage bucket. Your existing Cloud Storage buckets will continue to exist, but no new files will be added on an ongoing basis.
In fact, I even received one of these notifications since I had an old billing account (or two) that still had file export enabled. Even though the file export is going away, exporting your billing data to BigQuery gives you more detail and more capabilities to analyze, so it’s a big upgrade.
Start from the start
While Google Cloud does offer a free trial and free tier of services, it shouldn’t come as a surprise that most cloud services cost money to use. With the unique properties of the cloud, it’s much easier to bill for exact usage of various services, like pay-per-second for virtual machines. However, this can also become an overwhelming amount of information when a large number of services are being used across multiple teams. In order to make sure you understand your billing data, Google Cloud offers that data through direct reporting in the Cloud console, file exports, and exporting to BigQuery.
Most importantly, the file export for Cloud Billing data is going away on May 15th (the file exports for specific reports, like the cost table, aren’t going away). This was an option for billing accounts to generate daily CSV or JSON files into a Cloud Storage bucket so you could download the files and analyze them as needed. While these exports were definitely helpful for looking at your billing data, over time they couldn’t keep up with the complexity and volume of data that comes out of a billing account.
The most important thing to note here is simple: this export option is being deprecated entirely, so if you’re currently using it (and even if you’re not), you should make sure exporting to BigQuery is enabled.
Large data, large queries
Exporting from your billing account into BigQuery has been an option for the past few years, and now more than ever it’s the central option for managing your billing data. Of course, BigQuery is a natural home for large datasets with the scale and granularity of your billing data. In addition to that, exporting to BigQuery also happens more frequently than a daily file export, so you can do cost anomaly detection much faster.
As teams and organizations become larger, it can be increasingly difficult to figure out which groups are responsible for different costs. If your organization is using a chargeback model (where one group pays for all resources and then breaks down cost details for individual teams/groups to be responsible for their usage), then using BigQuery is the best way for you to accurately collect and analyze costs. On top of being able to query directly against your data, BigQuery also makes it much easier to integrate with other tools, like Looker or Looker Studio for visualization.
The actual data being exported to BigQuery are hourly records of every service your billing account is responsible for, along with detailed information like the SKU, what type of unit is being measured, and how many of that unit you’re paying for.
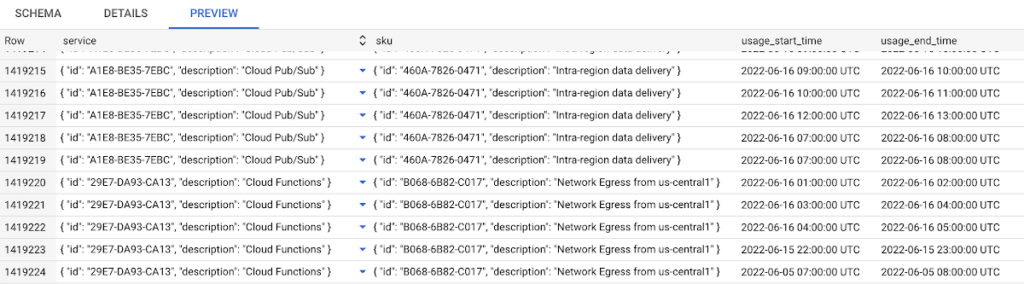
I suspect most folks using the file export (and probably most folks overall) will be fine with the standard export for BigQuery, and can use the detailed cost and pricing options if they need even more details. You can find some more details on all the exports in this blog post.
With the file export going away, it’s also important to mention: exporting your Cloud Billing data to BigQuery starts when you enable it, and doesn’t include older data. So make sure you set yourself up for future success by enabling billing export as soon as possible. Try using our built-in walkthrough to help you enable the export and to get started analyzing the data! You can also read more in the documentation.
More Relevant Stories for Your Company

Cloud Spanner & Bigtable Helps Sabre Build Consistency & Scalability to Serve 1 Billion Travellers
Sabre is an innovative software and technology company that leverages highly scalable databases and artificial intelligence (AI) to power travel industry partners around the globe. Our company processes more than 12 billion shopping requests and serves over 1 billion travelers every year. The companies that partner with us include airlines, travel

Gartner Identifies Critical Capabilities for Data Management Solutions
Data management solutions for analytics offerings are consolidating, with major vendors able to address a range of use cases and smaller vendors addressing a subset of use cases. Data and analytics leaders can use this research to guide evaluation and initial vendor selection for DMSA offerings. For data and analytics

Wayfair Writes its Success Story with BigQuery for Internal Analytics
Editor’s note: Home-goods and furniture giant Wayfair first partnered up with Google Cloud to transform and scale its storefront—work that proved its value many times over during the unprecedented surge in ecommerce traffic during 2020. Today, we hear how BigQuery’s performance and cost optimization have transformed the company’s internal analytics

DR for Cloud: Architecting Microsoft SQL Server with Google Cloud
Database disaster recovery (DR) planning is an important component of a bigger DR plan, and for enterprises using Microsoft SQL Server on Compute Engine, it often involves critical data. When you’re architecting a disaster recovery solution with Microsoft SQL Server running on Google Cloud Platform (GCP), you have some decisions to make
