





New Enterprise Capabilities and Changes to Cloud Spanner Reduces Cost of Running Workloads by 90 Percent

5392
Of your peers have already read this article.
3:00 Minutes
The most insightful time you'll spend today!
Customers love Cloud Spanner because it gives them the benefits of relational semantics and SQL while also delivering the scale and availability of non-relational databases. Many of these customers want to move even more of their work to Spanner, and have requested smaller instance sizes to support development, testing and small production workloads. We’re happy to announce that they’ll soon get what they asked for: more granular instance sizing is coming to Spanner.
Granular instance sizing will be available in Public Preview soon. With this feature, you can run workloads on Spanner at as low as 1/10th the cost of regular instances, equating to approximately $65/month.
In addition, we are launching new enterprise capabilities to break down operational silos for real-time insights and provide greater database observability to developers:
- Datastream, now in public preview, is a change data capture (CDC) service that allows enterprises to synchronize data across heterogeneous databases and applications. With Spanner support in Datastream, users will be able to stream data from MySQL or Oracle to Spanner reliably and with minimal latency.
- BigQuery federation to Spanner (coming soon) lets users query transactional data residing in Spanner, from BigQuery, without moving or copying data.
- Key Visualizer, available now in public preview, provides interactive monitoring so developers can quickly identify trends and usage patterns in Spanner.
Democratizing access with more granular instance sizing
Today, customers provision Spanner instances by specifying the number of nodes they need to run their workloads. Each node can provide up to 10,000 queries per second (QPS) of reads or 2,000 QPS of writes (writing single rows at 1 KB of data per row) and 2 TB of storage. A Spanner node is replicated across 3 zones for regional instances, and 5 or more zones for multi-regional instances. The choice of node count determines the amount of serving and storage resources that are available to the databases in a given instance.
Historically, the most granular unit for provisioning resources on Spanner has been one node. To enable more granular control, we are introducing Processing Units (PUs); one Spanner node is equal to 1,000 PUs. Customers can now provision in batches of 100 PUs, and get a proportionate amount of compute and storage resources. This will allow teams to run smaller workloads on Spanner at much lower cost. With this feature, customers can start at 100 PUs and scale up as needed in batches of 100 PUs, to up to 1,000 PUs (1 node), all with zero downtime. Subsequently, customers can continue to scale up by adding more nodes, just like what they do today. Customers do have the choice of using either PUs or nodes to provision resources within workloads, when those workloads occupy multiple nodes of capacity.
To illustrate with an example, let’s say a game developer creates a Spanner instance called “baseball-game” in us-central1, with 100 PU compute capacity at $65/month price.
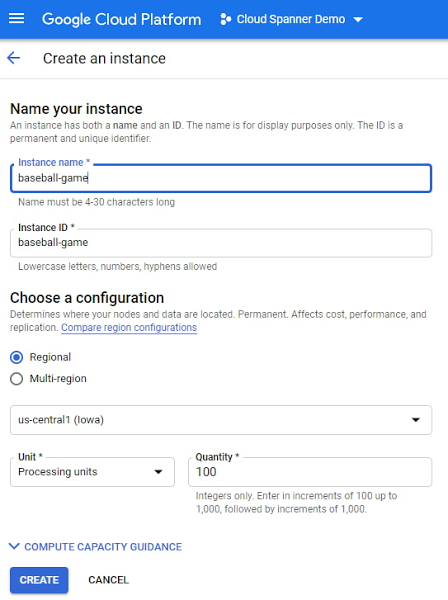
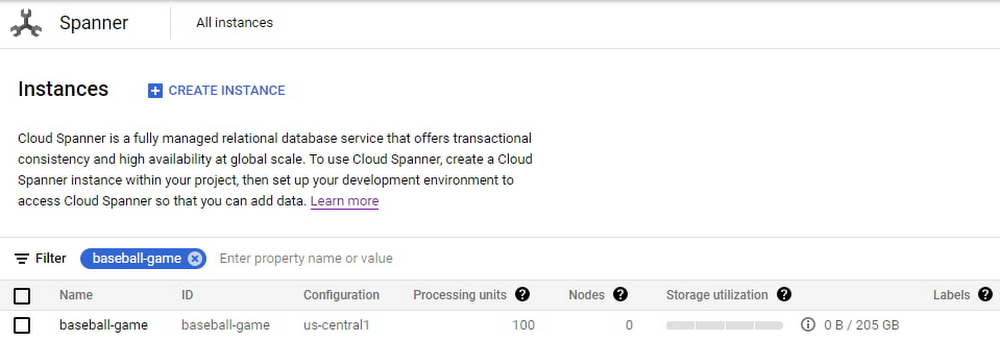
As you can see below, proportional maximum storage of 205 GB is assigned to the 100 PU instance.
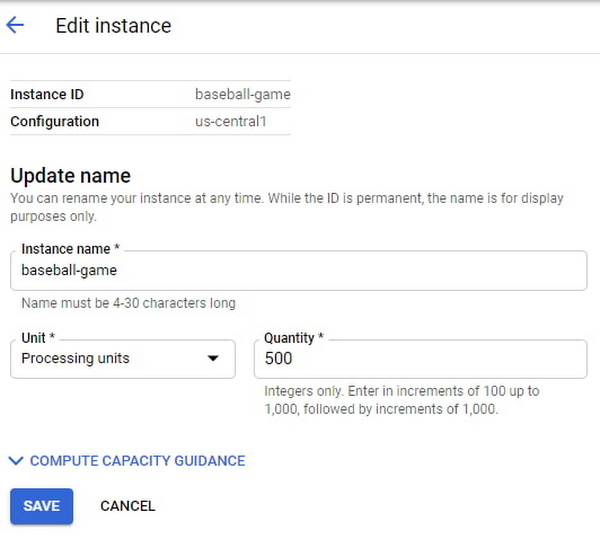
Once the game starts becoming popular and resource demands increase, the user edits the instance to increase the compute capacity to 500 PUs with proportional maximum 1 TB of storage.
The game grows in popularity, and the gaming company prepares to launch a much-awaited capability in the game. Anticipating a sharp increase in usage at launch day, the game developers increase the compute capacity to 3,000 PUs. Compute capacity assigned to the instance over a period of time can be viewed in Cloud Monitoring graphs:

Request Access
You can request early access to granular instance sizing feature by filling this form.
Breaking down operational silos with Datastream CDC and BigQuery federation
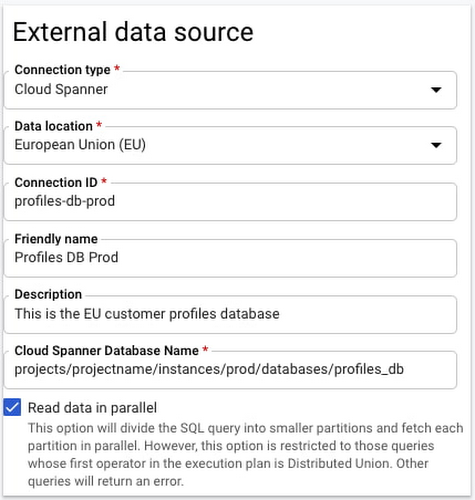
BigQuery Federation. BigQuery has made analytics easy by bringing together data from multiple sources for seamless analysis. Soon you’ll also be able to analyze data in Spanner directly in BigQuery. With Spanner’s BigQuery federation, you’ll be able to instantly query data residing in Spanner in real-time without moving or copying the data. Simply set up the Spanner as an external data source in BigQuery, as shown below.
Change Data Capture ingest. Now in public preview, Datastream lets you stream change data into Google Cloud from MySQL and Oracle databases. As of today, you can ingest this change data directly into Spanner using a built-in Dataflow template. This lets you migrate data from MySQL and Oracle databases into Spanner in near-real time.
Understanding performance and resource usage with Key Visualizer
Key Visualizer is a new interactive monitoring tool that lets developers and administrators analyze usage patterns in Spanner. It reveals trends and outliers in key performance and resource metrics for databases of any size, helping to optimize queries and reduce infrastructure costs. Designed for performance tuning and instance sizing, Key Visualizer is available today in public preview in the web-based Cloud Console for all Spanner databases at no additional cost. Learn more in the Key Visualizer blog.
Learn more
- To request early access to granular instance sizing in Spanner, fill out this form.
- To get started with Spanner today, create an instance or try it out with a Spanner Qwiklab.
How to Enhance Incremental Pipeline Performance while Ingesting Data into BigQuery

6321
Of your peers have already read this article.
3:00 Minutes
The most insightful time you'll spend today!
When you build a data warehouse, the important question is how to ingest data from the source system to the data warehouse. If the table is small you can fully reload a table on a regular basis, however, if the table is large a common technique is to perform incremental table updates. This post demonstrates how you can enhance incremental pipeline performance when you ingest data into BigQuery.
Setting up a standard incremental data ingestion pipeline
We will use the below example to illustrate a common ingestion pipeline that incrementally updates a data warehouse table. Let’s say that you ingest data into BigQuery from a large and frequently updated table in the source system, and you have Staging and Reporting areas (datasets) in BigQuery.

The Reporting area in BigQuery stores the most recent, full data that has been ingested from the source system tables. Usually you create the base table as a full snapshot of the source system table. In our running example, we use BigQuery public data as the source system and create reporting.base_table as shown below. In our example each row is identified by a unique key which consists of two columns: block_hash and log_index.
CREATE TABLE reporting.base_table --156 GB processedPARTITION BY TIMESTAMP_TRUNC(block_timestamp, DAY) ASSELECT log_index, data, topics, block_timestamp, block_hashFROM bigquery-public-data.crypto_ethereum.logsWHERE block_timestamp BETWEEN TIMESTAMP '2020-01-01' AND TIMESTAMP '2020-11-30';
In data warehouses it is common to partition a large base table by a datetime column that has a business meaning. For example, it may be a transaction timestamp, or datetime when some business event happened, etc. The idea is that data analysts who use the data warehouse usually need to analyze only some range of dates and rarely need the full data. In our example, we partition the base table by block_timestamp which comes from the source system.
After ingesting the initial snapshot you need to capture changes that happen in the source system table and update the reporting base table accordingly. This is when the Staging area comes into the picture. The staging table will contain captured data changes that you will merge into the base table. Let’s say that in our source system on a regular basis we have a set of new rows and also some updated records. In our example we mock the staging data as follows: first, we create new data, than we mock the updated records:
CREATE TABLE staging.load_delta AS --5 GB processedSELECT log_index, data, topics, block_timestamp, block_hashFROM bigquery-public-data.crypto_ethereum.logsWHERE block_timestamp BETWEEN TIMESTAMP '2020-12-01' AND TIMESTAMP '2020-12-07';INSERT INTO staging.load_delta --2 GB processedSELECT log_index, CONCAT(data, RAND()), topics, block_timestamp, block_hashFROM bigquery-public-data.crypto_ethereum.logs TABLESAMPLE SYSTEM (5 PERCENT)WHERE block_timestamp BETWEEN TIMESTAMP '2020-10-01' AND TIMESTAMP '2020-11-30';
Next, the pipeline merges the staging data into the base table. It joins two tables by unique key and than updates the changed value or inserts a new row
MERGE INTO reporting.base_table T --161 GB processedUSING staging.load_delta SON T.block_hash = S.block_hashAND T.log_index = S.log_indexWHEN MATCHED THEN UPDATE SETT.data = S.dataWHEN NOT MATCHED THEN INSERT (log_index, data, topics, block_timestamp, block_hash)VALUES (log_index, data, topics, block_timestamp, block_hash);
It is often the case that the staging table contains keys from various partitions but the number of those partitions are relatively small. It holds, for instance, because in the source system the recently added data may get changed due to some initial errors or ongoing processes but older records are rarely updated. However, when the above MERGE gets executed, BigQuery scans all partitions in the base table and processes 161 GB of data. You might add additional join condition on block_timestamp:
MERGE INTO reporting.base_table T --161 GB processedUSING staging.load_delta SON T.block_hash = S.block_hashAND T.log_index = S.log_indexAND T.block_timestamp = S.block_timestampWHEN MATCHED THEN UPDATE SETT.data = S.dataWHEN NOT MATCHED THEN INSERT (log_index, data, topics, block_timestamp, block_hash)VALUES (log_index, data, topics, block_timestamp, block_hash);
But BigQuery would still scan all partitions in the base table because condition T.block_timestamp = S.block_timestamp is a dynamic predicate and BigQuery doesn’t automatically push such predicates down from one table to another in MERGE.
Can you improve the MERGE efficiency by making it scan less data? The answer is Yes.
As described in the MERGE documentation, pruning conditions may be located in a subquery filter, a merge_condition filter, or a search_condition filter. In this post we show how you can leverage the first two. The main idea is to turn a dynamic predicate into a static predicate.
Steps to enhance your ingestion pipeline
The initial step is to compute the range of partitions that will be updated during the MERGE and store it in a variable. As was mentioned above, in data ingestion pipelines, staging tables are usually small so the cost of the computation is relatively low.
DECLARE src_range STRUCT<date_min TIMESTAMP, date_max TIMESTAMP> --115 MB processedDEFAULT(SELECT STRUCT(MIN(block_timestamp) AS date_min,MAX(block_timestamp) AS date_max) FROM staging.load_delta);
Based on your existing ETL/ELT pipeline, you can add the above code as-is to your pipeline or you can compute date_min, data_max as part of some already existing transformation step. Alternatively, date_min, data_max can be computed on the Source System side while capturing the next ingestion data batch.
After computing date_min, date_max you pass those values to the MERGE statement as static predicates. There are several ways to enhance the MERGE and prune partitions in the base table based on precomputed date_min, data_max.
If your initial MERGE statement uses a subquery, you can incorporate a new filter into it:
BEGINDECLARE src_range STRUCT<date_min TIMESTAMP, date_max TIMESTAMP> --115 MB processedDEFAULT(SELECT STRUCT(MIN(block_timestamp) AS date_min,MAX(block_timestamp) AS date_max) FROM staging.load_delta);MERGE INTO reporting.base_table T --41 GB processedUSING (SELECT *FROM staging.load_deltaWHERE block_timestamp BETWEEN src_range.date_min AND src_range.date_max) SON T.block_hash = S.block_hashAND T.log_index = S.log_indexAND T.block_timestamp = S.block_timestampWHEN MATCHED THEN UPDATE SETT.data = S.dataWHEN NOT MATCHED THEN INSERT (log_index, data, topics, block_timestamp, block_hash)VALUES (log_index, data, topics, block_timestamp, block_hash);END;
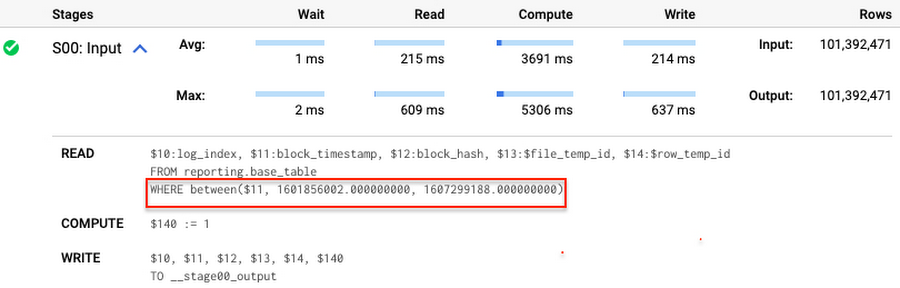
Note that you add the static filter to the staging table and keep T.block_timestamp = S.block_timestamp to convey to BigQuery that it can push that filter to the base table. This MERGE processes 41 GB of data in contrast to the initial 161 GB. You can see in the query plan that BigQuery pushes the partition filter from the staging table to the base table:
This type of optimization, when a pruning condition is pushed from a subquery to a large partitioned or clustered table, is not unique for MERGE. It also works for other types of queries. For instance:
SELECT * -- 41 GB processedFROM reporting.base_table TINNER JOIN staging.load_delta SON T.block_hash = S.block_hashAND T.log_index = S.log_indexAND T.block_timestamp = S.block_timestampWHERE S.block_timestamp BETWEEN TIMESTAMP '2020-10-05' AND TIMESTAMP '2020-12-07'
And you can check the query plan to verify that BigQuery pushed down the partition filter from one table to another.
Moreover, for SELECT statements, BigQuery can automatically infer a filter predicate on a join column and push it down from one table to another if your query meets the following criteria:
- The target table must be clustered or partitioned.
- The result size of the other table, i.e. after applying all filters, must qualify for broadcast join. Namly, the result set must be relatively small, less than ~100MB.
In our running example, reporting.base_table is partitioned by block_timestamp. If you define a selective filter on staging.load_delta and join two tables, you can see an inferred filter on the join key pushed to the target table
SELECT *FROM reporting.base_table TINNER JOIN staging.load_delta SON T.block_timestamp = S.block_timestampWHERE S.block_hash = '0x0c1caa16b34d94843aabfebc0d5a961db358135988f7498a6fdc450ad55f0870'
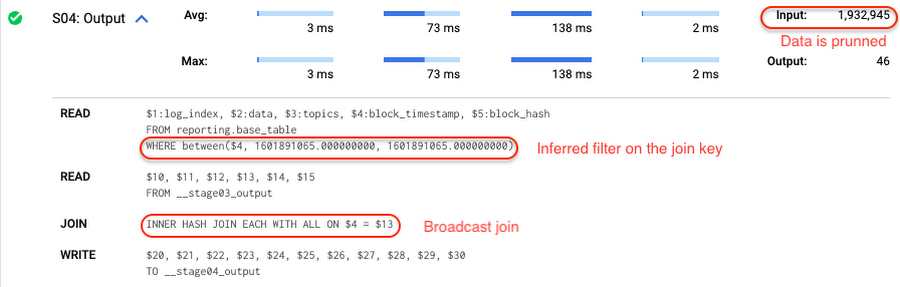
There is no requirement to join tables by partitioning or clustering key to kick off this type of optimization. However, in this case the pruning effect on the target table would be less significant.
But let us get back to the pipeline optimizations. Another way to enhance MERGE is to modify the merge_condition filter by adding static predicate on the base table:
BEGINDECLARE src_range STRUCT<date_min TIMESTAMP, date_max TIMESTAMP> --115 MB processedDEFAULT(SELECT STRUCT(MIN(block_timestamp) AS date_min,MAX(block_timestamp) AS date_max) FROM staging.load_delta);MERGE INTO reporting.base_table T --41 GB processedUSING staging.load_delta SON T.block_hash = S.block_hashAND T.log_index = S.log_indexAND T.block_timestamp BETWEEN src_range.date_min AND src_range.date_maxWHEN MATCHED THEN UPDATE SETT.data = S.dataWHEN NOT MATCHED THEN INSERT (log_index, data, topics, block_timestamp, block_hash)VALUES (log_index, data, topics, block_timestamp, block_hash);END;
To summarize, here are the steps that you can perform to enhance incremental ingestion pipelines in BigQuery. First you compute the range of updated partitions based on the small staging table. Next, you tweak the MERGE statement a bit to let BigQuery know to prune data in the base table.
All the enhanced MERGE statements scanned 41 GB of data, and setting up the src_range variable took 115 MB. Compare it with the initial 161 GB scan. Moreover, given that computing src_range may be incorporated into some existing transformation in your ETL/ELT, it results in a good performance improvement which you can leverage in your pipelines.
In this post we described how to enhance data ingestion pipelines by turning dynamic filter predicates into static predicates and letting BiQuery prune data for us. You can find more tips on BigQuery DML tuning here.
Special thanks to Daniel De Leo, who helped with examples and provided valuable feedback on this content.
How Arvind Fashions Ltd leads the fashion industry with powerful data analytics on BigQuery

4115
Of your peers have already read this article.
3:30 Minutes
The most insightful time you'll spend today!
Arvind Ltd has been in the apparel industry for more than 90 years, with its retail powerhouse Arvind Fashions Ltd being the backbone of well-known names in the retail fashion industry in India.
Arvind Fashions Ltd (Arvind) has seen significant growth in its portfolio with new franchises being added every year. The six high conviction brands include Tommy Hilfiger, Calvin Klein, Sephora, Arrow, U.S. Polo Assn. & Flying Machine.
To secure a foundation for future growth, the company has embarked on a digital transformation (DX) journey, focusing on profitability and improving the customer experience. The key objectives for Arvind’s DX is to unlock the value of existing applications, gain new insights, and build a solid workflow with resilient systems.
Getting Google Cloud to address the challenges around insights & analytics was a natural step forward, since Arvind had already formed a relationship with Google Cloud, starting with its productivity and collaboration tools during the pandemic.
Key Challenges
Arvind’s enterprise applications estate is a mix of SAP, Oracle POS, logistics management systems and other applications. Having so many different applications made it a challenge for the company to bring all of this data together to drive retail insights and at the same time maintain the freshness of its products.
As a case in point, the existing sales reporting and inventory reconciliation process had been enabled by a mix of automated and semi-automated desktop applications. There were challenges to scale the infrastructure in order to process large amounts of data at a low latency.
The synchronization of master data across functions was critical to build the data platform that provides consistent insights to multiple stakeholders across the organization.
Solution Approach – Modern Data Platform
There are several ways to solve the challenges above and do more by building a modern data analytics platform. For example, using a data lake based approach that builds use case by use case, hybrid data estates and so on. Regardless of the approach, it is important to define the solution based on certain principles.
In Arvind’s scenario, the key business principles considered are that data platforms should support Variety, Variability, Velocity and Volume. Each of these 4 V’s are critical business pivots to successful fashion retailing. Variety in SKU’s to deal with myriad fashion trends every season, Variability in shopping footfalls due to different festivities, weekends and special occasions, Velocity to be agile and responsive to customer needs, and Volumes of data that bring richer insights.
This is where Google BigQuery enabled data platform comes in, as it is able to meet the needs above.
Solution Architecture – Current Capabilities & Future Vision
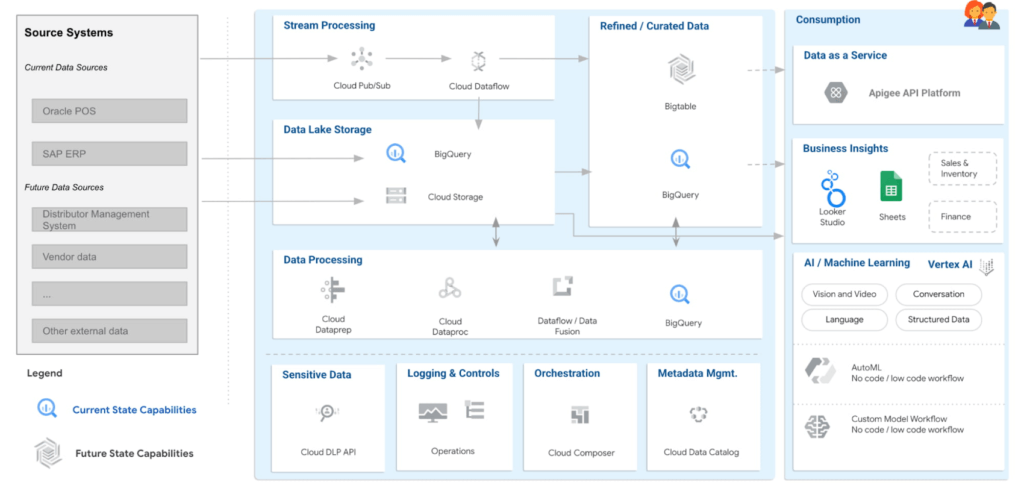
BigQuery is the mothership of the data and analytics platform on Google Cloud. Its serverless construct ensures that data engineering teams focus only on insights & analytics. Storage and compute is decoupled and can be independently scaled. BigQuery has been leveraged to service both the raw as well as the curated data zones.
With BigQuery procedures, it is possible to process the data natively within the data warehouse itself. Procedures have been leveraged to process the data in a low latency manner with the familiar SQL.
But then what happens to advanced analytics and insights? With simplicity being our key guiding principle, BigQuery machine learning ensures that data analysts can create, train and deploy analytics models even with complex requirements. It can also consume data from Looker Studio, which is seamlessly integrated with BigQuery.
Here are the key principles and highlights of the data platform that have been achieved:
- Simple, yet exhaustive – We needed a solution with vast technical capabilities such as data lake & data warehouse, data processing, data consumption, analytics amongst others. And at the same time it needed to be simple to implement and run ongoing operations.
- Agility – High quality analytics use cases typically require a significant amount of time, effort and skill set. While building a simple solution we ensured that the selection of technology services ensured agility in the long term.
- Security – An organization can be truly successful if the insights and analytics operations are democratized. But while data is made available to a wider community, we need to ensure data governance and security.
- Ease of operations – Data engineering teams spend a lot of time doing infrastructure setting and management operations. With BigQuery, teams can put in more effort on building the data pipelines and models to feed into analytics instead of worrying about the infrastructure operations.
- Costs – Decoupling storage and compute allows for flexible pricing. A pay-as-you-go model is the ideal solution to managing costs.
Business Impact
The ingestion frequency of the store level inventory (~800 stores) has now been changed to daily. With the additional data volumes and processing the scaling on BigQuery has been seamless. There are new processes and dashboards to address the reconciliation and root cause analysis. Operational efficiencies have improved leading to better productivity and turn around time of critical processes.
The discrepancies in various reconciliation activities have drastically reduced by an order of magnitude of 300X due to the capabilities offered by the data platform. Not only is it possible to identify discrepancies but the data platform has also enabled in identifying the root causes for the same as well.
Arvind Fashions Ltd have also been able to enhance some of the existing business processes and systems with insight from the data platform.
It’s going to be an exciting journey for Arvind Fashions Ltd and Google Cloud. There are several initiatives ready for kick off such as getting more apps on the edge devices, warehouse analytics, advanced customer data platforms, predicting the lifecycle of designs, style codes and other exciting initiatives.
3687
Of your peers have already watched this video.
61:30 Minutes
The most insightful time you'll spend today!
How to Move From Redshift to BigQuery Easily
Enterprise data warehouses are getting more expensive to maintain. Traditional data warehouses are hard to scale and often involve lots of data silos. Business teams need data insights quickly, but technology teams have to grapple with managing and providing that data using old tools that aren’t keeping up with demand. Increasingly, enterprises are migrating their data warehouses to the cloud to take advantage of the speed, scalability, and access to advanced analytics it offers.
With this in mind, we introduced the BigQuery Data Transfer Service to automate data movement to BigQuery, so you can lay the foundation for a cloud data warehouse without writing a single line of code. Earlier this year, we added the capability to move data and schema from Teradata and S3 to BigQuery via the BigQuery Data Transfer Service. To help you take advantage of the scalability of BigQuery, we’ve now added a service to transfer data from Amazon Redshift, in beta, to that list.
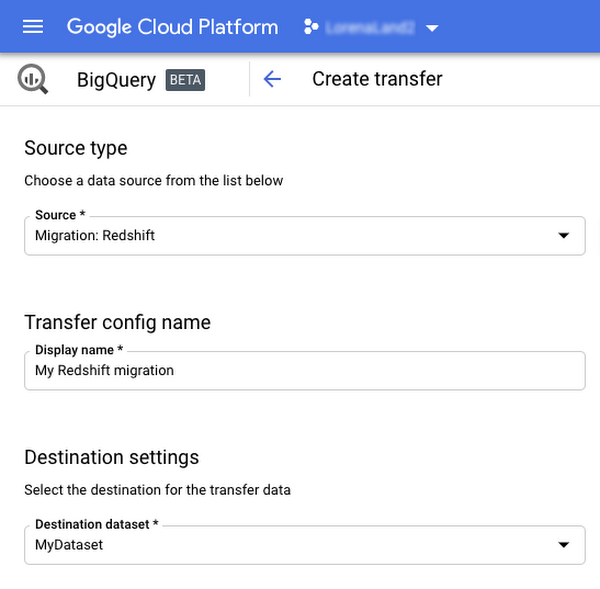
Data and schema migration from Redshift to BigQuery is provided by a combination of the BigQuery Data Transfer Service and a special migration agent running on Google Kubernetes Engine (GKE), and can be performed via UI, CLI or API. In the UI, Redshift to BigQuery migration can be initiated from BigQuery Data Transfer Service by choosing Redshift as a source.
The migration process has three steps:
- UNLOAD from Redshift to S3—The GKE agent initiates an UNLOAD operation from Redshift to S3. The agent extracts Redshift data as a compressed file, which helps customers minimize the egress costs.
- Transfer from S3 to Cloud Storage—The agent then moves data from Amazon S3 to a Cloud Storage bucket using Cloud Storage Transfer Service.
- Load from Cloud Storage to BigQuery—Cloud Storage data is loaded into BigQuery (up to 10 million files).
Watch the video to learn more!
Why Data Cloud Matters for Business Transformation
3799
Of your peers have already read this article.
2:00 Minutes
The most insightful time you'll spend today!
I’m so excited to be part of Google Cloud. Data has been a longstanding part of my career and it is at the heart of business transformation. Many companies have mastered the ability to collect data and have mechanisms in place to draw on some of it to solve business problems. But most data collected piles up and is never put to a useful purpose. Accessing it and mining it for helpful insights is practically impossible at many companies. It’s always stuck in hard to reach places, fragmented across departments and unavailable when you need it the most.
Our mission at Google Cloud is to accelerate your ability to digitally transform your business with data. Solving data challenges is in our DNA, and over the last two decades we’ve been in a unique position to help our customers get the most out of data to drive real business value.
Google products are used and loved by billions of people across the globe. These products bring together the complex web of disconnected, disparate, and rapidly changing data that makes up the internet. When you get an answer in milliseconds from google.com via a simple search bar, you know we have this down to a science. Google Cloud brings this expertise in data and software together for businesses of all sizes so that you can gain advantage from your data. We call this the data cloud.
Enter the data cloud
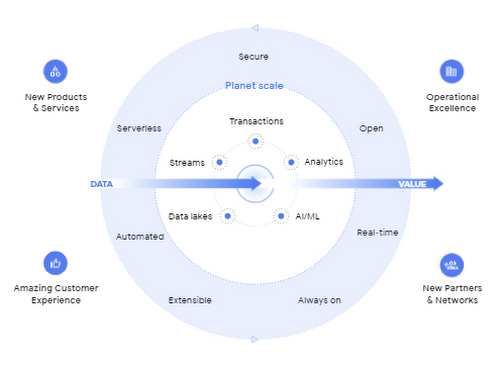
A data cloud offers a comprehensive and proven approach to cloud and embraces the full data lifecycle, from the systems that run your business, where data is born, to analytics that support decision making, to AI and machine learning (ML) that predict and automate the future. A data cloud allows you a way to securely unify data across your entire organization, so you can break down silos, increase agility, innovate faster, get value from your data, and support business transformation. This is the heart of the data cloud.
Why a data cloud is essential
Building a data cloud using Google Cloud’s technologies helps organizations accelerate business transformation by giving everyone access to the right information at the right time so that they can act more intelligently based on it.
Since I’ve joined Google, I’ve been not only inspired by the work that the team has done to build products with a user-first mindset, but our customers have been an inspiration to each of us in what’s possible.
- The Home Depot built a data cloud using Google Cloud technologies to help keep 50,000+ items stocked at over 2,000 locations. They’re making their 400,000+ associates smarter by giving them visibility into the things each customer needs, like item location within a local store. By leveraging BigQuery, their query performance dropped from hours and days to seconds and minutes. The Home Depot also uses Cloud SQL, Spanner, and Bigtable for their operational use cases and AI to help locate goods using their mobile apps for in-store navigation.
- Major League Baseball (MLB) is reimagining the fan experience with their data cloud. To build engagement with today’s fans, drive engagement with future generations, and lay the groundwork for future innovation, MLB consolidated its infrastructure and migrated to Google Cloud’s Anthos, Google Kubernetes Engine, Cloud SQL, and BigQuery. MLB tracks every moment of every game for an audience on seven continents with Cloud SQL, this valuable data to drive deeper engagement with fans.
- Vodafone is using their data cloud to offer their customers new, personalized products and services across multiple markets. By identifying more than 700 use cases to deliver new products and services, Vodafone can support fact-based decision-making, reduce costs, remove duplication of data sources, and simplify operations. With Google Cloud, Vodafone’s operating companies in multiple countries can access improved data analytics, intelligence, and machine-learning capabilities.
Here are four reasons why customers trust Google Cloud to build their data cloud strategy:
First, Google delivers insights at planet scale
Customers often gravitate to Google Cloud for our specific data tools that were built for Google’s internal data needs and are unmatched for speed, scale, security, and capability for any size organization. BigQuery is the leading solution for analytics and allows you to run analytics at scale with a 99.99% SLA and up to 34% lower TCO than cloud data warehouse alternatives. Spanner provides unlimited scale, global consistency across regions, and high availability up to 99.999%, at a TCO that is 78% lower compared to on-prem databases and 37% lower than other cloud options. Firestore continues to see rapid adoption with over 2M databases created to power mobile, web, and IoT applications across customer environments. And finally Looker, an API for all your data, offers a single shared place for people and apps to interact with it, no matter the cloud environment.
Second, Google’s AI helps your business be more intelligent
Google was built on pioneering AI research and the principle of making the world’s information useful to people and businesses everywhere. AI powers some of Google’s most popular products, such as Search, Maps, Ads, and YouTube. We have leveraged this expertise to deliver a new, unified AI platform that gives every data scientist, data analyst, and ML engineer access to the same AI toolkit Google uses. Automated machine learning, accelerated experimentation and custom training, and more deployed models than any other platform enable your entire data team to drive business outcomes at any scale.
Third, Google is the open data platform
Google Cloud’s open platform gives customers maximum flexibility for managing transactional, analytical, and AI-based applications. Customers can choose from a wide range of transactional, processing, and analytics engines, open source tools, open APIs, and ML services to eliminate lock-in. This includes choice of deployment across multi-cloud and hybrid environments and easy interoperability with existing partner solutions and investments. With BigQuery Omni, organizations can choose to deploy their data warehousing solution to work natively with AWS or with Azure (coming soon). Looker supports 50+ distinct SQL dialects across multiple clouds and our database services like Cloud SQL, one of the fastest growing services at Google Cloud, offers familiar open source MySQL and PostgreSQL standard connection drivers, so you can work with your preferred tools and stay up-to-date with the latest community enhancements. In addition, Google offers an unrivaled developer community across the fields of AI, machine learning, mobile, application development, microservices, and access to third party solutions and open source systems.
Fourth, Google offers a trusted platform for your data needs
Customers can take advantage of the same secure-by-design infrastructure, built-in data protection, and global network that Google uses to ensure compliance, redundancy, and reliability. All of Google’s data is encrypted in transit and at rest, by default. Google offers industry-leading reliability across regions so you’re always up and running. Spanner offers a 99.999% SLA and BigQuery offers a 99.99% SLA. For BI and embedded analytics, Looker supports data governance via a semantic layer that organizes your data and stores your business logic centrally, delivering consistent and trusted KPIs. And finally, our multi-layered security approach across hardware, services, user identity, storage, internet communication and operations provides peace of mind that your data is protected.
Learn more at Data Cloud Summit
We are committed to helping you build a data cloud that gives you deep insights into your business and process automation. Join me as I welcome Anders Gustafsson, CEO of Zebra and
Gil Perez, CIO of Deutsche Bank at the Data Cloud Summit on May 26, 2021 to learn and share new ways to use data for good. I can’t wait to hear what you accomplish.
Countries can Tackle Food Wastage Crisis Using Google’s Data Analytics

4976
Of your peers have already read this article.
4:00 Minutes
The most insightful time you'll spend today!
With over ⅓ of the food in the USA ending up as waste according to the USDA, it is a compelling challenge to address this travesty. What will happen to hunger, food prices, trash reduction, water consumption, and overall sustainability when we stop squandering this abundance?

Beginning with the departure from the farm to the back of the store, the freshness clock continues to run. Grocers work very hard to purchase high quality produce items for their customers and the journey to the shelf can take a toll in both quality and remaining shelf life. Suppliers focus on delivering their items through the arduous supply chain journey to the store with speed and gentle handling. The baton is then passed to the store to unload and present the items to customers with care to sell through each lot significantly before the expiration or sell by date. This is to ensure that the time spent in the customer’s home is ample to ensure a great eating experience as well. Food waste is a farm to fork problem with opportunity at every step of the chain, but today we will focus on the segment that the grocery industry oversees.
With the complexities of weather, geopolitical issues, distribution, sales variability, pricing, promotions, and inventory management, it seems daunting to impact waste. Fortunately, data analytics and machine learning in the cloud is a powerful weapon in the fight against food waste. Data Scientists harness knowledge to draw meaning from data turning that data into decision driving information.
One key Google has been working on to accelerate value is to break down data silos and leverage machine learning to realize better outcomes, using our Google Data Cloud platform. This enables better planning through demand forecasting, Inventory management, assortment planning, and dynamic pricing and promotions.
That sounds great but how does it work?
Let’s walk through a day in the life journey to see how the integrated Google Data Cloud platform can change the game for good. Our friendly fictitious grocer FastFreshFood is committed to selling high quality perishable items to their local market. Their goal is to minimize food waste and maximize revenue by selling as much perishable fresh food as possible before the sell by date. Our fictitious grocer in partnership with Google Cloud could build a solution that will take a significant bite out of their food waste volume and better satisfy customers.
- Sales through the register and online are processed in real time with Datastream, Dataflow to keep an accurate perpetual inventory by minute of every single item.
- A Demand forecasting model using machine learning algorithms in BigQuery then identifies needs for back room replenishment, so Direct Store Delivery and daily store Distribution Centers manage ordering more efficiently to ensure just the right amount of each product each day.
- Realtime reporting dashboards in Looker with alerting capabilities enable the system to operate with strong associate support and understanding. The reporting suite shows inventory levels into the future, daily orders, and at risk items.
The pricing algorithm could also alert store leadership concerning any items that will not sell through and suggest real time in store specials resulting in zero waste at shelf and maximized revenue.

This approach is not just for perishable categories and is a pattern that works well for in-store produced items and center store items. The key point is that by bringing ML/AI to difficult business problems grocers are reinventing what is possible for both their profitability and sustainability.
The technical implementation of this design pattern in Google Cloud leverages Datastream, Dataflow, BigQuery and Looker products, it is detailed in a technical tutorial accompanying this blog post.
In partnership with Google Cloud, retailers can solve complex problems with innovative solutions to achieve higher quality, lower cost, and provide great customer experiences. To learn more from this and other use cases, please visit our Design Patterns website.
Curious to learn more?
We’re excited to share what we know about tackling food waste at Google, a topic we’ve been working on in the last decade as we’ve embarked on reducing our own food waste in our operations in over 50 countries in the world. The Google Food for Good team works exclusively on Google Cloud Platform with our partners on this topic. Two additional articles below.
Silos are for food, not for data – tackling food waste with technology
This business Cloud blog directly addresses information silos that currently exist across many nodes in the food system and how to break down cultural and organizational barriers to sharing.
“Unsiloing” data to work toward solving food waste and food insecurity
This follow-on technical Cloud blog articulates the path to setting up data pipelines, translating between data sets (not everyone calls a tomato a tomato!) and making sense of emergent insights.
More Relevant Stories for Your Company

Transform ‘Dark Data’ from Documents with Document AI, Cloud Functions and Workflows
At enterprises across industries, documents are at the center of core business processes. Documents store a treasure trove of valuable information whether it's a company's invoices, HR documents, tax forms and much more. However, the unstructured nature of documents make them difficult to work with as a data source. We

Serverless and BigQuery Together on Google Cloud: Behind the L’Oreal Beauty Tech Data Platform
Editor's note: In Today's guest post we hear from beauty leader L'Oréal about their approach to building a modern data platform on fully managed services: managing the ingest of diverse datasets into BigQuery with Cloud Run, and orchestrating transformations into relevant business domain representations for stakeholders across the organization. Learn

AgroStar: Small farms in India getting big help from the cloud
AgroStar has launched a cloud-based mobile app that is helping to boost crop yields and encourage best practices for small farmers in India. Launched as an on-premises ecommerce platform selling farm tools in 2008, the firm turned to Google Cloud Platform (GCP) to expand its offering. It now uses cloud-based analytics and is

Vodafone Leverages Google Cloud to Aid COVID-19 Frontline with Anonymized Insights on Population Mobility
Editor’s note: When Europe’s largest mobile communications company, Vodafone, was asked by the European Commission to help understand population movement across the European Union and the UK to help fight COVID-19, it was able to provide anonymized mobile network-based insights to answer the call. Here’s how Vodafone, with the support
