





New Capabilities in BigQuery to Ease Anomalies Detection in the Absence of Labeled Data

6340
Of your peers have already read this article.
4:00 Minutes
The most insightful time you'll spend today!
When it comes to anomaly detection, one of the key challenges that many organizations face is that it can be difficult to know how to define what an anomaly is. How do you define and anticipate unusual network intrusions, manufacturing defects, or insurance fraud? If you have labeled data with known anomalies, then you can choose from a variety of supervised machine learning model types that are already supported in BigQuery ML. But what can you do if you don’t know what kind of anomaly to expect, and you don’t have labeled data? Unlike typical predictive techniques that leverage supervised learning, organizations may need to be able to detect anomalies in the absence of labeled data.
Today we are announcing the public preview of new anomaly detection capabilities in BigQuery ML that leverage unsupervised machine learning to help you detect anomalies without needing labeled data. Depending on whether or not the training data is time series, users can now detect anomalies in training data or on new input data using a new ML.DETECT_ANOMALIES function (documentation), with the following models:
- Autoencoder model, now in Public Preview (documentation)
- K-means model, already GA (documentation)
- ARIMA_PLUS time series model, already GA (documentation)
How does anomaly detection with ML.DETECT_ANOMALIES work?
To detect anomalies in non-time-series data, you can use:
- K-means clustering models: When you use
ML.DETECT_ANOMALIESwith a k-means model, anomalies are identified based on the value of each input data point’s normalized distance to its nearest cluster. If that distance exceeds a threshold determined by the contamination value provided by the user, the data point is identified as an anomaly. - Autoencoder models: When you use
ML.DETECT_ANOMALIESwith an autoencoder model, anomalies are identified based on the reconstruction error for each data point. If the error exceeds a threshold determined by the contamination value, it is identified as an anomaly.
To detect anomalies in time-series data, you can use:
- ARIMA_PLUS time series models: When you use
ML.DETECT_ANOMALIESwith an ARIMA_PLUS model, anomalies are identified based on the confidence interval for that timestamp. If the probability that the data point at that timestamp occurs outside of the prediction interval exceeds a probability threshold provided by the user, the datapoint is identified as an anomaly.
Below we show code examples of anomaly detection in BigQuery ML for each of the above scenarios.
Anomaly detection with a k-means clustering model
You can now detect anomalies using k-means clustering models, by running ML.DETECT_ANOMALIES to detect anomalies in the training data or in new input data. Begin by creating a k-means clustering model:
Language: SQL
CREATE MODEL `mydataset.my_kmeans_model`OPTIONS(MODEL_TYPE = 'kmeans',NUM_CLUSTERS = 8,KMEANS_INIT_METHOD = 'kmeans++') ASSELECT* EXCEPT(Time, Class)FROM`bigquery-public-data.ml_datasets.ulb_fraud_detection`;
With the k-means clustering model trained, you can now run ML.DETECT_ANOMALIES to detect anomalies in the training data or in new input data.
To detect anomalies in the training data, use ML.DETECT_ANOMALIES with the same data used during training:
Language: SQL
SELECT*FROMML.DETECT_ANOMALIES(MODEL `mydataset.my_kmeans_model`,STRUCT(0.02 AS contamination),TABLE `bigquery-public-data.ml_datasets.ulb_fraud_detection`);

To detect anomalies in new data, use ML.DETECT_ANOMALIES and provide new data as input:
Language: SQL
SELECT*FROMML.DETECT_ANOMALIES(MODEL `mydataset.my_kmeans_model`,STRUCT(0.02 AS contamination),(SELECT * FROM `mydataset.newdata`));

How does anomaly detection work for k-means clustering models?
Anomalies are identified based on the value of each input data point’s normalized distance to its nearest cluster, which, if exceeds a threshold determined by the contamination value, is identified as an anomaly. How does this work exactly? With a k-means model and data as inputs, ML.DETECT_ANOMALIES first computes the absolute distance for each input data point to all cluster centroids in the model, then normalizes each distance by the respective cluster radius (which is defined as the standard deviation of the absolute distances of all points in this cluster to the centroid). For each data point, ML.DETECT_ANOMALIES returns the nearest centroid_id based on normalized_distance, as seen in the screenshot above. The contamination value, specified by the user, determines the threshold of whether a data point is considered an anomaly. For example, a contamination value of 0.1 means that the top 10% of descending normalized distance from the training data will be used as the cut-off threshold. If the normalized distance for a datapoint exceeds the threshold, then it is identified as an anomaly. Setting an appropriate contamination will be highly dependent on the requirements of the user or business.
For more information on anomaly detection with k-means clustering, please see the documentation here.
Anomaly detection with an autoencoder model
You can now detect anomalies using autoencoder models, by running ML.DETECT_ANOMALIES to detect anomalies in the training data or in new input data.
Begin by creating an autoencoder model:
Language: SQL
CREATE MODEL `mydataset.my_autoencoder_model`OPTIONS(model_type='autoencoder',activation_fn='relu',batch_size=8,dropout=0.2,hidden_units=[32, 16, 4, 16, 32],learn_rate=0.001,l1_reg_activation=0.0001,max_iterations=10,optimizer='adam') ASSELECT* EXCEPT(Time, Class)FROM`bigquery-public-data.ml_datasets.ulb_fraud_detection`;
To detect anomalies in the training data, use ML.DETECT_ANOMALIES with the same data used during training:
Language: SQL
SELECT*FROMML.DETECT_ANOMALIES(MODEL `mydataset.my_autoencoder_model`,STRUCT(0.02 AS contamination),TABLE `bigquery-public-data.ml_datasets.ulb_fraud_detection`);

To detect anomalies in new data, use ML.DETECT_ANOMALIES and provide new data as input:
Language: SQL
SELECT*FROMML.DETECT_ANOMALIES(MODEL `mydataset.my_autoencoder_model`,STRUCT(0.02 AS contamination),(SELECT * FROM `mydataset.newdata`));

How does anomaly detection work for autoencoder models?
Anomalies are identified based on the value of each input data point’s reconstructed error, which, if exceeds a threshold determined by the contamination value, is identified as an anomaly. How does this work exactly? With an autoencoder model and data as inputs, ML.DETECT_ANOMALIES first computes the mean_squared_error for each data point between its original values and its reconstructed values. The contamination value, specified by the user, determines the threshold of whether a data point is considered an anomaly. For example, a contamination value of 0.1 means that the top 10% of descending error from the training data will be used as the cut-off threshold. Setting an appropriate contamination will be highly dependent on the requirements of the user or business.
For more information on anomaly detection with autoencoder models, please see the documentation here.
Anomaly detection with an ARIMA_PLUS time-series model

With ML.DETECT_ANOMALIES, you can now detect anomalies using ARIMA_PLUS time series models in the (historical) training data or in new input data. Here are some examples of when might you want to detect anomalies with time-series data:
Detecting anomalies in historical data:
- Cleaning up data for forecasting and modeling purposes, e.g. preprocessing historical time series before using them to train an ML model.
- When you have a large number of retail demand time series (thousands of products across hundreds of stores or zip codes), you may want to quickly identify which stores and product categories had anomalous sales patterns, and then perform a deeper analysis of why that was the case.
Forward looking anomaly detection:
- Detecting consumer behavior and pricing anomalies as early as possible: e.g. if traffic to a specific product page suddenly and unexpectedly spikes, it might be because of an error in the pricing process that leads to an unusually low price.
- When you have a large number of retail demand time series (thousands of products across hundreds of stores or zip codes), you would like to identify which stores and product categories had anomalous sales patterns based on your forecasts, so you can quickly respond to any unexpected spikes or dips.
How do you detect anomalies using ARIMA_PLUS? Begin by creating an ARIMA_PLUS time series model:
Language: SQL
CREATE OR REPLACE MODEL mydataset.my_arima_plus_modelOPTIONS(MODEL_TYPE='ARIMA_PLUS',TIME_SERIES_TIMESTAMP_COL='date',TIME_SERIES_DATA_COL='total_amount_sold',TIME_SERIES_ID_COL='item_name',HOLIDAY_REGION='US') ASSELECTdate,item_description AS item_name,SUM(bottles_sold) AS total_amount_soldFROM`bigquery-public-data.iowa_liquor_sales.sales`GROUP BYdate,item_nameHAVINGdate BETWEEN DATE('2016-01-04') AND DATE('2017-06-01')AND item_name IN ("Black Velvet", "Captain Morgan Spiced Rum","Hawkeye Vodka", "Five O'Clock Vodka", "Fireball Cinnamon Whiskey");
To detect anomalies in the training data, use ML.DETECT_ANOMALIES with the model obtained above:
Language: SQL
SELECT*FROMML.DETECT_ANOMALIES(MODEL `mydataset.my_arima_plus_model`,STRUCT(0.8 AS anomaly_prob_threshold));

To detect anomalies in new data, use ML.DETECT_ANOMALIES and provide new data as input:
Language: SQL
WITHnew_data AS (SELECTdate,item_description AS item_name,SUM(bottles_sold) AS total_amount_soldFROM`bigquery-public-data.iowa_liquor_sales.sales`GROUP BYdate,item_nameHAVINGdate BETWEEN DATE('2017-06-02')AND DATE('2017-10-01')AND item_name IN ('Black Velvet','Captain Morgan Spiced Rum','Hawkeye Vodka',"Five O'Clock Vodka",'Fireball Cinnamon Whiskey') )SELECT*FROMML.DETECT_ANOMALIES(MODEL `mydataset.my_arima_plus_model`,STRUCT(0.8 AS anomaly_prob_threshold),(SELECT*FROMnew_data));

For more information on anomaly detection with ARIMA_PLUS time series models, please see the documentation here.
Thanks to the BigQuery ML team, especially Abhinav Khushraj, Abhishek Kashyap, Amir Hormati, Jerry Ye, Xi Cheng, Skander Hannachi, Steve Walker, and Stephanie Wang.
BigQuery Helps Insurance Firms Leverage Previous Storm Data for Better Pricing Insights

8568
Of your peers have already read this article.
2:00 Minutes
The most insightful time you'll spend today!
It may be surprising to know that U.S. natural catastrophe economic losses totaled $119 billion in 2020, and 75% (or $89.4B) of those economic losses were caused by severe storms and cyclones. In the insurance industry, data is everything. Insurers use data to influence underwriting, rating, pricing, forms, marketing, and even claims handling. When fueled by good data, risk assessments become more accurate and produce better business results. To make this possible, the industry is increasingly turning to predictive analytics, which uses data, statistical algorithms, and machine learning (ML) techniques to predict future outcomes based on historical data. Insurance firms also integrate external data sources with their own existing data to generate more insight into claimants and damages. Google Cloud Public Datasets offers more than 100 high-demand public datasets through BigQuery that helps insurers in these sorts of data “mashups.”
One particular dataset that insurers find very useful is Severe Storm Event Details from the U.S. National Oceanic and Atmospheric Administration (NOAA). As part of the Google Cloud Public Datasets program and NOAA’s Public Data Program, this severe storm data contains various types of storm reports by state, county, and event type—from 1950 to the present—with regular updates. Similar NOAA datasets within the Google Cloud Public Datasets program include the Significant Earthquake Database, Global Hurricane Tracks, and the Global Historical Tsunami Database.
In this post, we’ll explore how to apply storm event data for insurance pricing purposes using a few common data science tools—Python Notebook and BigQuery—to drive better insights for insurers.
Predicting outcomes with severe storm datasets
For property insurers, common determinants of insurance pricing include home condition, assessor and neighborhood data, and cost-to-replace. But macro forces such as natural disasters—like regional hurricanes, flash floods, and thunderstorms—can also significantly contribute to the risk profile of the insured. Insurance companies can leverage severe weather data for dynamic pricing of premiums by analyzing the severity of those events in terms of past damage done to property and crops, for example.
It’s important to set the premium correctly, however, considering the risks involved. Insurance companies now run sophisticated statistical models, taking into account various factors—many of which can change over time. After all, without accurate data, poor predictions can lead to business losses, particularly at scale.
The Severe Storm Event Details database includes information about a storm event’s location, azimuth (an angle measurement used in celestial coordination), distance, impact, and severity, including the cost of damages to property and crops. It documents:
- The occurrence of storms and other significant weather events of sufficient intensity to cause loss of life, injuries, significant property damage, and/or disruption to commerce.
- Rare, unusual weather events that generate media attention, such as snow flurries in South Florida or the San Diego coastal area.
- Other significant weather events, such as record maximum or minimum temperatures or precipitation that occur in connection with another event.
Data about a specific event is added to the dataset within 120 days to allow time for damage assessments and other analysis.
Driving business insights with BigQuery and notebooks
Google Cloud’s BigQuery provides easy access to this data in multiple ways. For example, you can query directly within BigQuery and perform analysis using SQL.
Another popular option in the data science and analyst community is to access BigQuery from within the Notebook environment to intersperse Python code and SQL text, and then perform ad hoc experimentation. This uses the powerful BigQuery compute to query and process huge amounts of data without having to perform the complex transformations within the memory in Pandas, for example.
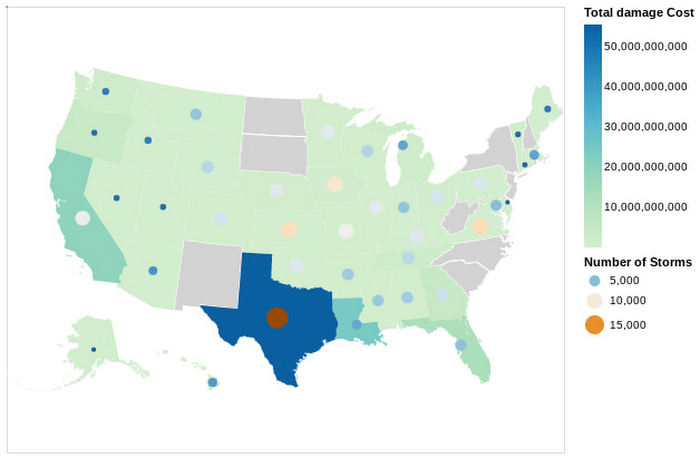
In this Python notebook, we have shown how the severe storm data can be used to generate risk profiles of various zip codes based on the severity of those events as measured by the damage incurred. The severe storm dataset is queried to retrieve a smaller dataset into the notebook, which is then explored and visualized using Python. Here’s a look at the risk profiles of the zip codes:
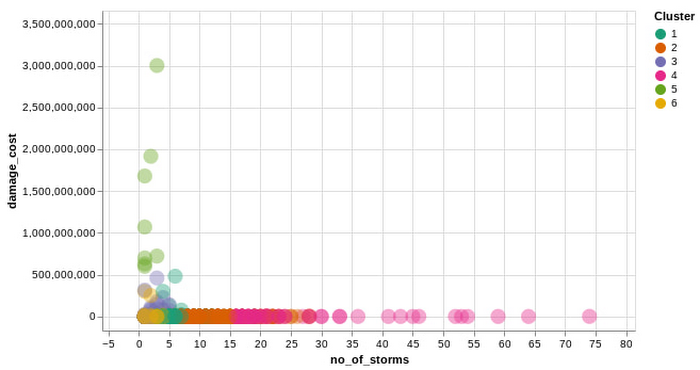
Another Google Cloud resource for insurers is BigQuery ML, which allows them to create and execute machine learning models on their data using standard SQL queries. In this notebook, with a K-Means Clustering algorithm, we have used BigQuery ML to generate different clusters of zip codes in the top five states impacted by severe storms. These clusters show different levels of impact by the storms, indicating different risk groups.
The example notebook is a reference guide to enable analysts to easily incorporate and leverage public datasets to augment their analysis and streamline the journey to business insights. Instead of having to figure out how to access and use this data yourself, the public datasets, coupled with BigQuery and other solutions, provide a well-lit path to insights, leaving you more time to focus on your own business solutions.
Making an impact with big data
Google Cloud’s Public Datasets is just one resource within the broader Google Cloud ecosystem that provides data science teams within the financial services with flexible tools to gather deeper insights for growth. The severe storm dataset is a part of our environmental, social, and governance (ESG) efforts to organize information about our planet and make it actionable through technology, helping people make a positive impact together.
To learn more about this public dataset collaboration between Google Cloud and NOAA, attend the Dynamic Pricing in Insurance: Leveraging Datasets To Predict Risk and Price session at the Google Cloud Financial Services Summit on May 27. You can also check out our recent blog and explore more about BigQuery and BigQuery ML.
Google Launches Open Saves To Power Gaming Platforms Scale to User Demands

5496
Of your peers have already read this article.
1:30 Minutes
The most insightful time you'll spend today!
Many of today’s games are rich, immersive worlds that engage the audience in ways that make a gamer a part of a continuing storyline. To create these persistent experiences, numerous storage technologies are required to ensure game data can scale to the standards of gamers’ demands. Not only do game developers need to store different types of data—such as saves, inventory, patches, replays, and more—but they also must keep the storage system high-performing, available, scalable, and cost-effective.
Enter Open Saves, a brand-new, purpose-built single interface for multiple storage back ends that’s powered by Google Cloud and developed in partnership with 2K. Now, development teams can store game data without having to make the technical decisions on which storage solution to use, whether that’s Cloud Storage, Memorystore, or Firestore.
“Open Saves demonstrates our commitment to partnering with top developers on gaming solutions that require a combination of deep industry expertise and Google scale,” said Joe Garfola, Vice President of IT and Security at 2K. “We look forward to continued collaboration with Google Cloud.”
Game development teams can save game data against Open Saves without having to worry about the optimal back-end storage solution, while operations teams can focus on needed scalability and storage options. Here’s how it looks in practice:
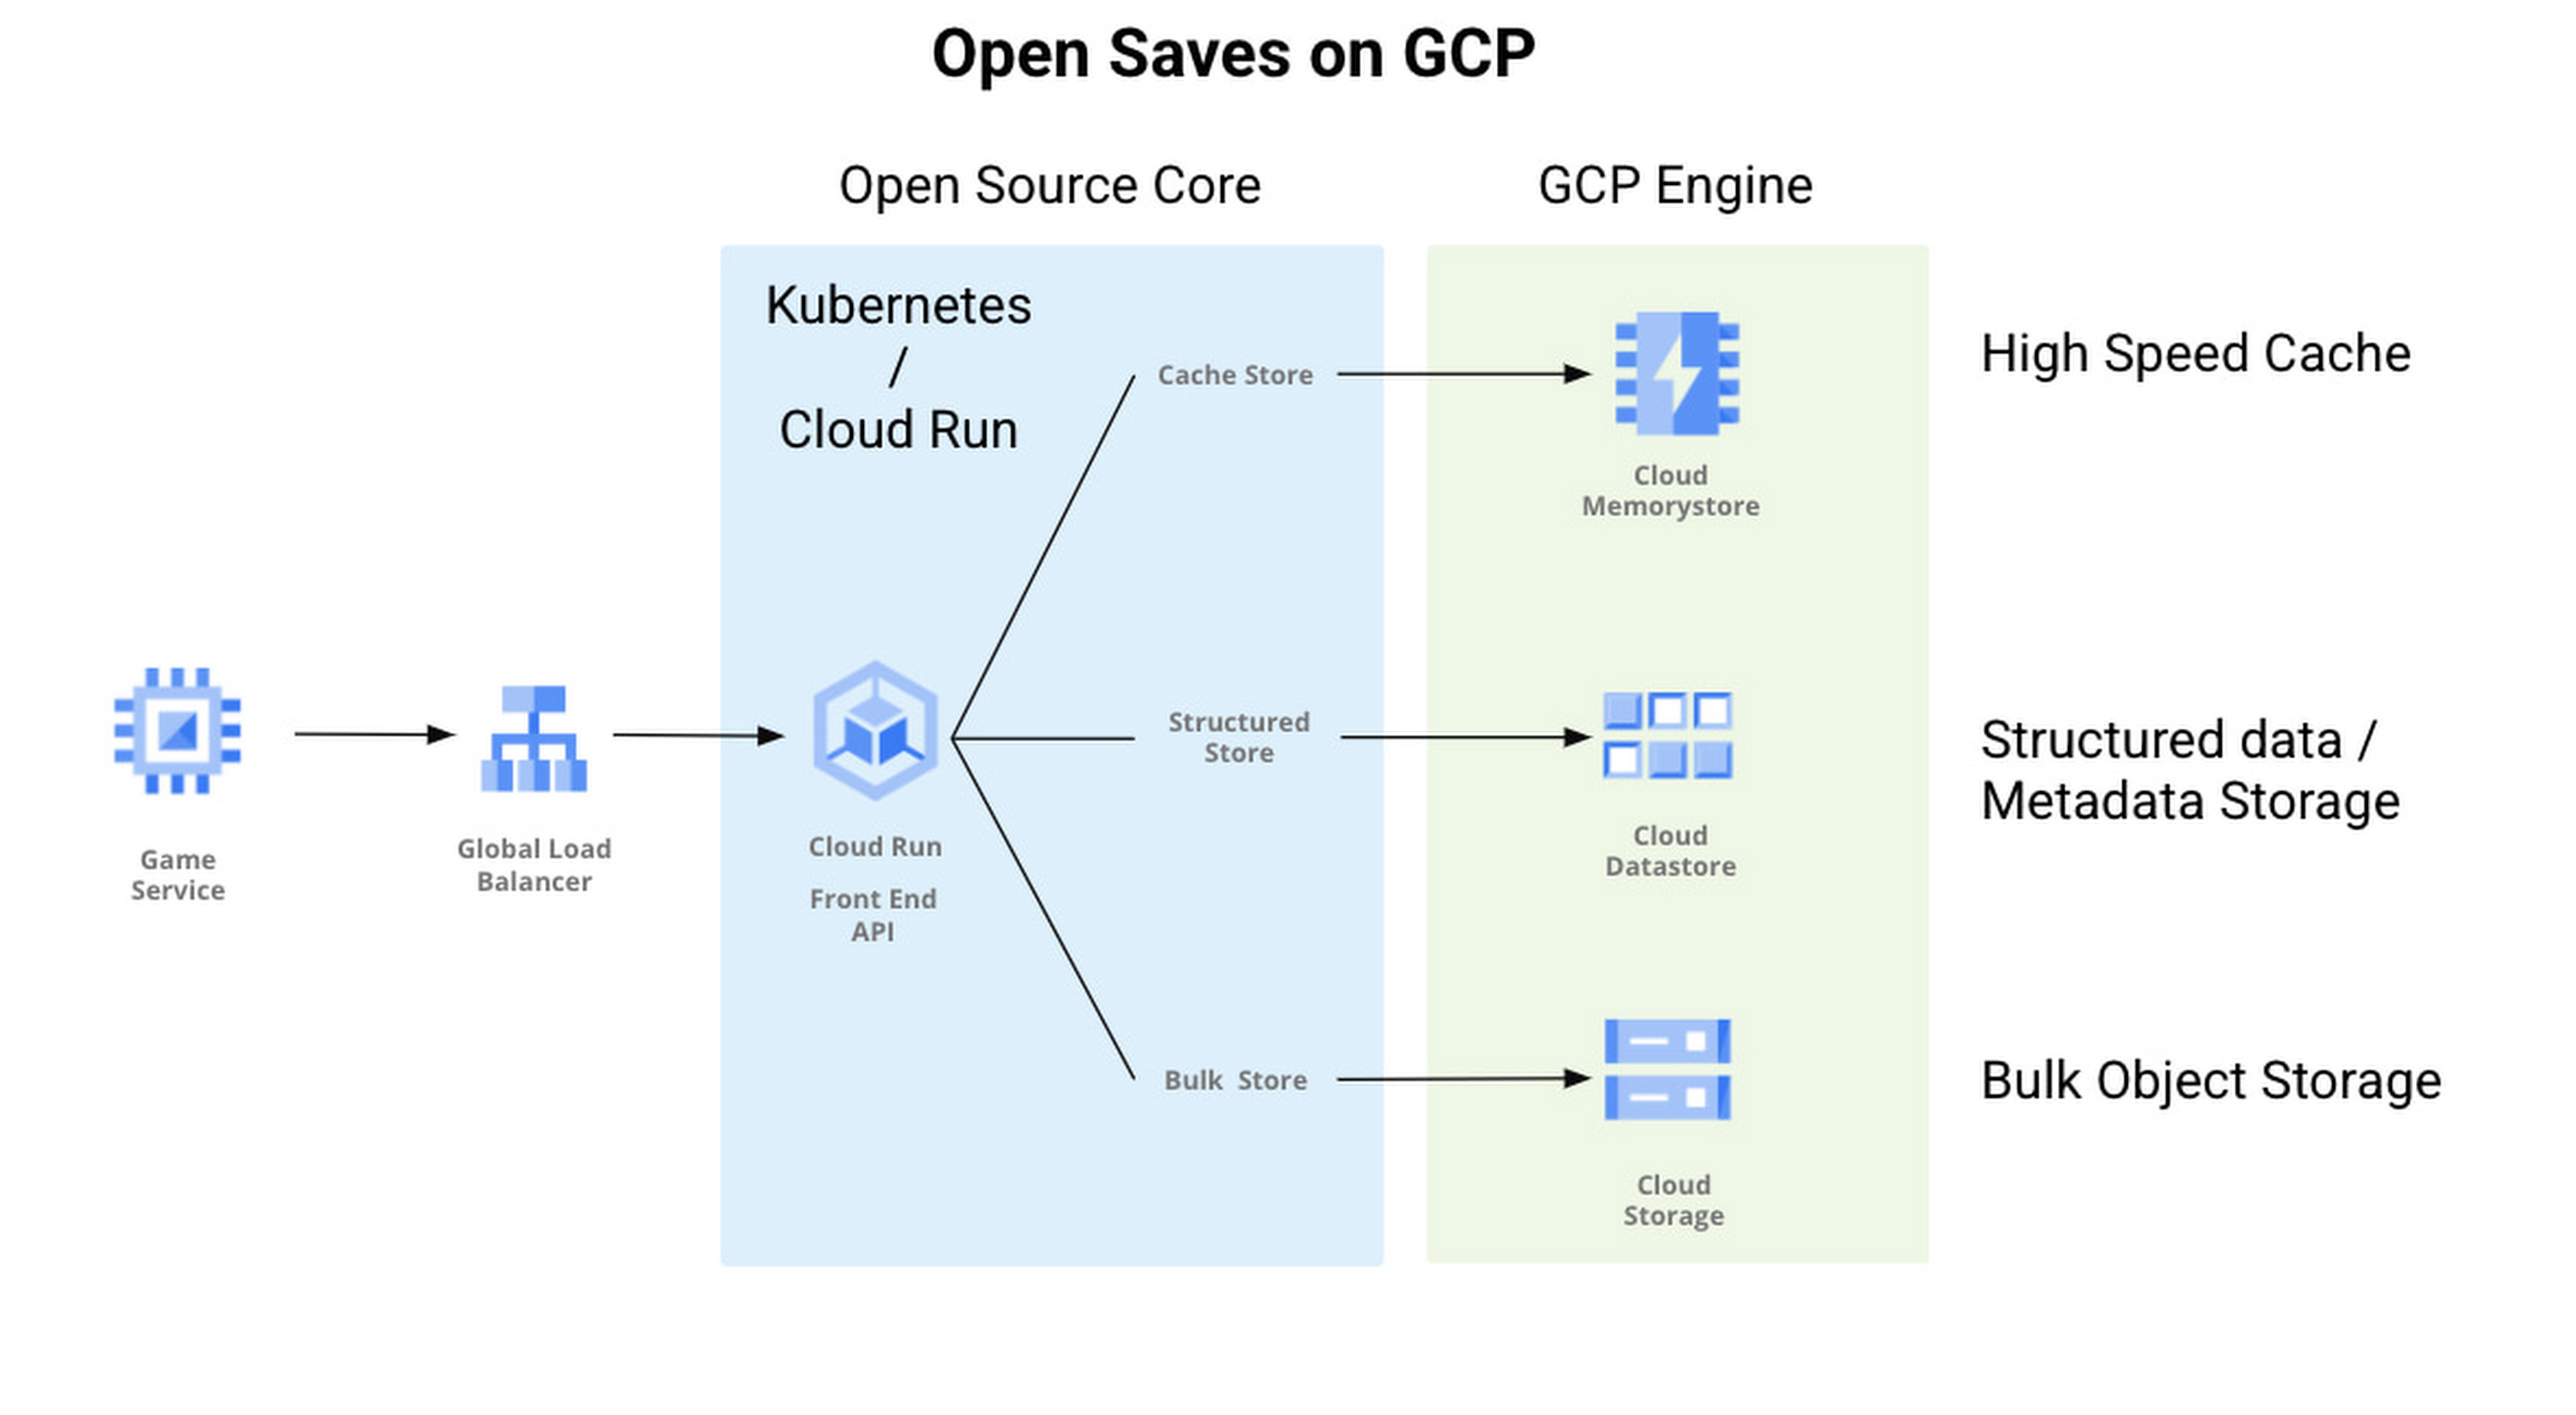
With Open Saves, game developers can run a cloud-native game storage system that is:
- Simple: Open Saves provides a unified, well-defined gRPC endpoint for all operations for metadata, structured, and unstructured objects.
- Fast: With a built-in caching system, Open Saves optimizes data placements based on access frequency and data size, all to achieve both low latency for smaller binary objects and high throughput for big objects.
- Scalable: The Open Saves API server can run on either Google Kubernetes Engine or Cloud Run. Both platforms can scale out to handle hundreds of thousands of requests per second. Open Saves also stores data in Firestore and Cloud Storage, and can handle hundreds of gigabytes of data and up to millions of requests per second.
Open Saves is designed with extensibility in mind, and can be integrated into any game—whether mobile or console, multiplayer or single player—running on any infrastructure, from on-prem to cloud or a hybrid. The server is written in Go, but you can use many programming languages and connect from client or server since the API is defined in gRPC.
Writing to and reading from Open Saves is as simple as the following code:
// To writerecord := &pb.Record{Key: uuid.New().String(),Tags: []string{"tag1", "tag2"},OwnerId: "owner",}createReq := &pb.CreateRecordRequest{StoreKey: storeKey,Record: record,}_, err := client.CreateRecord(ctx, createReq)if err != nil {t.Fatalf("CreateRecord failed: %v", err)}// To readgetReq := &pb.GetRecordRequest{StoreKey: storeKey, Key: recordKey}response, err := client.GetRecord(ctx, getReq)if err != nil {t.Errorf("GetRecord failed: %v", err)}
We are actively developing Open Saves in partnership with 2K Games, and would love for you to come join us on GitHub. There are a few ways to get involved:
- Install and deploy your Open Saves service
- Check out the API reference
- Read the development guide and start contributing
- Join the open-saves-discuss mailing list
11240
Of your peers have already watched this video.
1:30 Minutes
The most insightful time you'll spend today!
Indian Retailer Figures Optimizes Hyperlocal Delivery to Increase Customer Experience
Anyone who follows the Indian e-commerce scene knows that one of the largest challenges these companies face is hyperlocal delivery.
That was a problem facing Wellness Forever, a retail chain of pharmacies with 150-plus stores across India.
“Exactly a year ago, we started our journey of hyperlocal deliveries. This optimization was a big time challenge for us to understand how to optimize this,” Palani Subbiah, CTO, Wellness Forever.
The problem in front of Wellness Forever was to identify which customer could can be sold from which store, so that a delivery could be made within 90 minutes.
“We handle a large amount of customer data and we wanted to use insights to help and improve the customer satisfaction index,” says Subbiah.
To do that Wellness Forever leveraged Google Big Query to run massive amount of data to come up with the operational insights. They also used Firebase and Google Maps.
“By 2021, we are going to have about 450 stores. Those stores are going to be not only a physical store, which is a digital store.
6377
Of your peers have already watched this video.
2:15 Minutes
The most insightful time you'll spend today!
What’s Google Cloud Firestore Database and What are its Benefits for Business and Developers?
Cloud Firestore is a NoSQL document database that simplifies storing, syncing, and querying data for your mobile and web apps at global scale.
Cloud Firestore is a fast, fully managed, serverless, cloud-native NoSQL document database that simplifies storing, syncing, and querying data for your mobile, web, and IoT apps at global scale.
Its client libraries provide live synchronization and offline support, while its security features and integrations with Firebase and Google Cloud Platform (GCP) accelerate building truly serverless apps.
Here’s other stuff it’s good at:
Sync data across devices, on or offline
With Cloud Firestore, your applications can be updated in near real time when data on the back end changes. This is not only great for building collaborative multi-user mobile applications, but also means you can keep your data in sync with individual users who might want to use your app from multiple devices.
With Firebase Realtime Database, we felt we had built the best force-plate testing software on the market. Thanks to Cloud Firestore, in only two weeks, we built a system that’s significantly better and includes features we never thought possible to ship on Day 1.
Chris Wales, CTO, Hawkin Dynamics
Cloud Firestore has full offline support, so you can access and make changes to your data, and those changes will be synced to the cloud when the client comes back online. Built-in offline support leverages local cache to serve and store data, so your app remains responsive regardless of network latency or internet connectivity.
Simple and effortless
Cloud Firestore’s robust client libraries make it easy for you to update and receive new data while worrying less about establishing network connections or unforeseen race conditions. It can scale effortlessly as your app grows. Cloud Firestore allows you to run sophisticated queries against your data. This gives you more flexibility in the way you structure your data and can often mean that you have to do less filtering on the client, which keeps your network calls and data usage more efficient.
Enterprise-grade, scalable NoSQL
Cloud Firestore is a fast and fully managed NoSQL cloud database. It is built to scale and takes advantage of GCP’s powerful infrastructure, with automatic horizontal scaling in and out, in response to your application’s load. Security access controls for data are built in and enable you to handle data validation via a configuration language.
Why Data Cloud Matters for Business Transformation
3804
Of your peers have already read this article.
2:00 Minutes
The most insightful time you'll spend today!
I’m so excited to be part of Google Cloud. Data has been a longstanding part of my career and it is at the heart of business transformation. Many companies have mastered the ability to collect data and have mechanisms in place to draw on some of it to solve business problems. But most data collected piles up and is never put to a useful purpose. Accessing it and mining it for helpful insights is practically impossible at many companies. It’s always stuck in hard to reach places, fragmented across departments and unavailable when you need it the most.
Our mission at Google Cloud is to accelerate your ability to digitally transform your business with data. Solving data challenges is in our DNA, and over the last two decades we’ve been in a unique position to help our customers get the most out of data to drive real business value.
Google products are used and loved by billions of people across the globe. These products bring together the complex web of disconnected, disparate, and rapidly changing data that makes up the internet. When you get an answer in milliseconds from google.com via a simple search bar, you know we have this down to a science. Google Cloud brings this expertise in data and software together for businesses of all sizes so that you can gain advantage from your data. We call this the data cloud.
Enter the data cloud
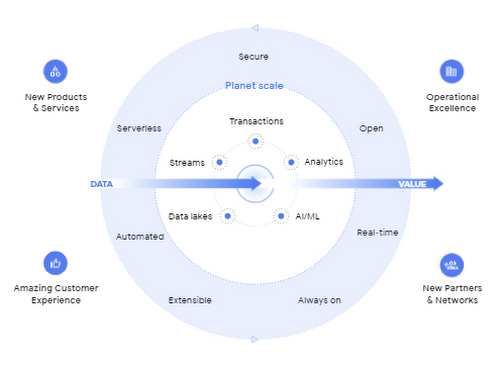
A data cloud offers a comprehensive and proven approach to cloud and embraces the full data lifecycle, from the systems that run your business, where data is born, to analytics that support decision making, to AI and machine learning (ML) that predict and automate the future. A data cloud allows you a way to securely unify data across your entire organization, so you can break down silos, increase agility, innovate faster, get value from your data, and support business transformation. This is the heart of the data cloud.
Why a data cloud is essential
Building a data cloud using Google Cloud’s technologies helps organizations accelerate business transformation by giving everyone access to the right information at the right time so that they can act more intelligently based on it.
Since I’ve joined Google, I’ve been not only inspired by the work that the team has done to build products with a user-first mindset, but our customers have been an inspiration to each of us in what’s possible.
- The Home Depot built a data cloud using Google Cloud technologies to help keep 50,000+ items stocked at over 2,000 locations. They’re making their 400,000+ associates smarter by giving them visibility into the things each customer needs, like item location within a local store. By leveraging BigQuery, their query performance dropped from hours and days to seconds and minutes. The Home Depot also uses Cloud SQL, Spanner, and Bigtable for their operational use cases and AI to help locate goods using their mobile apps for in-store navigation.
- Major League Baseball (MLB) is reimagining the fan experience with their data cloud. To build engagement with today’s fans, drive engagement with future generations, and lay the groundwork for future innovation, MLB consolidated its infrastructure and migrated to Google Cloud’s Anthos, Google Kubernetes Engine, Cloud SQL, and BigQuery. MLB tracks every moment of every game for an audience on seven continents with Cloud SQL, this valuable data to drive deeper engagement with fans.
- Vodafone is using their data cloud to offer their customers new, personalized products and services across multiple markets. By identifying more than 700 use cases to deliver new products and services, Vodafone can support fact-based decision-making, reduce costs, remove duplication of data sources, and simplify operations. With Google Cloud, Vodafone’s operating companies in multiple countries can access improved data analytics, intelligence, and machine-learning capabilities.
Here are four reasons why customers trust Google Cloud to build their data cloud strategy:
First, Google delivers insights at planet scale
Customers often gravitate to Google Cloud for our specific data tools that were built for Google’s internal data needs and are unmatched for speed, scale, security, and capability for any size organization. BigQuery is the leading solution for analytics and allows you to run analytics at scale with a 99.99% SLA and up to 34% lower TCO than cloud data warehouse alternatives. Spanner provides unlimited scale, global consistency across regions, and high availability up to 99.999%, at a TCO that is 78% lower compared to on-prem databases and 37% lower than other cloud options. Firestore continues to see rapid adoption with over 2M databases created to power mobile, web, and IoT applications across customer environments. And finally Looker, an API for all your data, offers a single shared place for people and apps to interact with it, no matter the cloud environment.
Second, Google’s AI helps your business be more intelligent
Google was built on pioneering AI research and the principle of making the world’s information useful to people and businesses everywhere. AI powers some of Google’s most popular products, such as Search, Maps, Ads, and YouTube. We have leveraged this expertise to deliver a new, unified AI platform that gives every data scientist, data analyst, and ML engineer access to the same AI toolkit Google uses. Automated machine learning, accelerated experimentation and custom training, and more deployed models than any other platform enable your entire data team to drive business outcomes at any scale.
Third, Google is the open data platform
Google Cloud’s open platform gives customers maximum flexibility for managing transactional, analytical, and AI-based applications. Customers can choose from a wide range of transactional, processing, and analytics engines, open source tools, open APIs, and ML services to eliminate lock-in. This includes choice of deployment across multi-cloud and hybrid environments and easy interoperability with existing partner solutions and investments. With BigQuery Omni, organizations can choose to deploy their data warehousing solution to work natively with AWS or with Azure (coming soon). Looker supports 50+ distinct SQL dialects across multiple clouds and our database services like Cloud SQL, one of the fastest growing services at Google Cloud, offers familiar open source MySQL and PostgreSQL standard connection drivers, so you can work with your preferred tools and stay up-to-date with the latest community enhancements. In addition, Google offers an unrivaled developer community across the fields of AI, machine learning, mobile, application development, microservices, and access to third party solutions and open source systems.
Fourth, Google offers a trusted platform for your data needs
Customers can take advantage of the same secure-by-design infrastructure, built-in data protection, and global network that Google uses to ensure compliance, redundancy, and reliability. All of Google’s data is encrypted in transit and at rest, by default. Google offers industry-leading reliability across regions so you’re always up and running. Spanner offers a 99.999% SLA and BigQuery offers a 99.99% SLA. For BI and embedded analytics, Looker supports data governance via a semantic layer that organizes your data and stores your business logic centrally, delivering consistent and trusted KPIs. And finally, our multi-layered security approach across hardware, services, user identity, storage, internet communication and operations provides peace of mind that your data is protected.
Learn more at Data Cloud Summit
We are committed to helping you build a data cloud that gives you deep insights into your business and process automation. Join me as I welcome Anders Gustafsson, CEO of Zebra and
Gil Perez, CIO of Deutsche Bank at the Data Cloud Summit on May 26, 2021 to learn and share new ways to use data for good. I can’t wait to hear what you accomplish.
More Relevant Stories for Your Company

Boost Database Performance with AlloyDB Index Advisor: The Ultimate Optimization Tool
Intro One of the time consuming tasks for DBAs is to maximize query performance. To optimize slow-running queries, they often have to do detailed analysis, understand optimizer plans, and go through a lot of trial and error before getting to the best set of indexes that help with improved query

How Constellation Brands’ Direct-to-Customer Tech Delivers Economic Impact across Business Portfolio
Editor’s note: Today we’re hearing from Ryan Mason, Director, Head of DTC Growth & Strategy, at alcoholic beverage firm, Constellation Brands on the company’s shift to Direct-to-Consumer (DTC) sales and how Google Cloud’s powerful technology stack helped with this transformation. It’s no secret that consumer businesses have been up-ended in

Updating Twitter’s Ad Engagement Analytics Platform for the Modern Age
As part of the daily business operations on its advertising platform, Twitter serves billions of ad engagement events, each of which potentially affects hundreds of downstream aggregate metrics. To enable its advertisers to measure user engagement and track ad campaign efficiency, Twitter offers a variety of analytics tools, APIs, and
Google Cloud Announces General Availability of BigQuery Row-level Security
Data security is an ongoing concern for anyone managing a data warehouse. Organizations need to control access to data, down to the granular level, for secure access to data both internally and externally. With the complexity of data platforms increasing day by day, it's become even more critical to identify
