





New Capabilities in BigQuery to Ease Anomalies Detection in the Absence of Labeled Data

6319
Of your peers have already read this article.
4:00 Minutes
The most insightful time you'll spend today!
When it comes to anomaly detection, one of the key challenges that many organizations face is that it can be difficult to know how to define what an anomaly is. How do you define and anticipate unusual network intrusions, manufacturing defects, or insurance fraud? If you have labeled data with known anomalies, then you can choose from a variety of supervised machine learning model types that are already supported in BigQuery ML. But what can you do if you don’t know what kind of anomaly to expect, and you don’t have labeled data? Unlike typical predictive techniques that leverage supervised learning, organizations may need to be able to detect anomalies in the absence of labeled data.
Today we are announcing the public preview of new anomaly detection capabilities in BigQuery ML that leverage unsupervised machine learning to help you detect anomalies without needing labeled data. Depending on whether or not the training data is time series, users can now detect anomalies in training data or on new input data using a new ML.DETECT_ANOMALIES function (documentation), with the following models:
- Autoencoder model, now in Public Preview (documentation)
- K-means model, already GA (documentation)
- ARIMA_PLUS time series model, already GA (documentation)
How does anomaly detection with ML.DETECT_ANOMALIES work?
To detect anomalies in non-time-series data, you can use:
- K-means clustering models: When you use
ML.DETECT_ANOMALIESwith a k-means model, anomalies are identified based on the value of each input data point’s normalized distance to its nearest cluster. If that distance exceeds a threshold determined by the contamination value provided by the user, the data point is identified as an anomaly. - Autoencoder models: When you use
ML.DETECT_ANOMALIESwith an autoencoder model, anomalies are identified based on the reconstruction error for each data point. If the error exceeds a threshold determined by the contamination value, it is identified as an anomaly.
To detect anomalies in time-series data, you can use:
- ARIMA_PLUS time series models: When you use
ML.DETECT_ANOMALIESwith an ARIMA_PLUS model, anomalies are identified based on the confidence interval for that timestamp. If the probability that the data point at that timestamp occurs outside of the prediction interval exceeds a probability threshold provided by the user, the datapoint is identified as an anomaly.
Below we show code examples of anomaly detection in BigQuery ML for each of the above scenarios.
Anomaly detection with a k-means clustering model
You can now detect anomalies using k-means clustering models, by running ML.DETECT_ANOMALIES to detect anomalies in the training data or in new input data. Begin by creating a k-means clustering model:
Language: SQL
CREATE MODEL `mydataset.my_kmeans_model`OPTIONS(MODEL_TYPE = 'kmeans',NUM_CLUSTERS = 8,KMEANS_INIT_METHOD = 'kmeans++') ASSELECT* EXCEPT(Time, Class)FROM`bigquery-public-data.ml_datasets.ulb_fraud_detection`;
With the k-means clustering model trained, you can now run ML.DETECT_ANOMALIES to detect anomalies in the training data or in new input data.
To detect anomalies in the training data, use ML.DETECT_ANOMALIES with the same data used during training:
Language: SQL
SELECT*FROMML.DETECT_ANOMALIES(MODEL `mydataset.my_kmeans_model`,STRUCT(0.02 AS contamination),TABLE `bigquery-public-data.ml_datasets.ulb_fraud_detection`);

To detect anomalies in new data, use ML.DETECT_ANOMALIES and provide new data as input:
Language: SQL
SELECT*FROMML.DETECT_ANOMALIES(MODEL `mydataset.my_kmeans_model`,STRUCT(0.02 AS contamination),(SELECT * FROM `mydataset.newdata`));

How does anomaly detection work for k-means clustering models?
Anomalies are identified based on the value of each input data point’s normalized distance to its nearest cluster, which, if exceeds a threshold determined by the contamination value, is identified as an anomaly. How does this work exactly? With a k-means model and data as inputs, ML.DETECT_ANOMALIES first computes the absolute distance for each input data point to all cluster centroids in the model, then normalizes each distance by the respective cluster radius (which is defined as the standard deviation of the absolute distances of all points in this cluster to the centroid). For each data point, ML.DETECT_ANOMALIES returns the nearest centroid_id based on normalized_distance, as seen in the screenshot above. The contamination value, specified by the user, determines the threshold of whether a data point is considered an anomaly. For example, a contamination value of 0.1 means that the top 10% of descending normalized distance from the training data will be used as the cut-off threshold. If the normalized distance for a datapoint exceeds the threshold, then it is identified as an anomaly. Setting an appropriate contamination will be highly dependent on the requirements of the user or business.
For more information on anomaly detection with k-means clustering, please see the documentation here.
Anomaly detection with an autoencoder model
You can now detect anomalies using autoencoder models, by running ML.DETECT_ANOMALIES to detect anomalies in the training data or in new input data.
Begin by creating an autoencoder model:
Language: SQL
CREATE MODEL `mydataset.my_autoencoder_model`OPTIONS(model_type='autoencoder',activation_fn='relu',batch_size=8,dropout=0.2,hidden_units=[32, 16, 4, 16, 32],learn_rate=0.001,l1_reg_activation=0.0001,max_iterations=10,optimizer='adam') ASSELECT* EXCEPT(Time, Class)FROM`bigquery-public-data.ml_datasets.ulb_fraud_detection`;
To detect anomalies in the training data, use ML.DETECT_ANOMALIES with the same data used during training:
Language: SQL
SELECT*FROMML.DETECT_ANOMALIES(MODEL `mydataset.my_autoencoder_model`,STRUCT(0.02 AS contamination),TABLE `bigquery-public-data.ml_datasets.ulb_fraud_detection`);

To detect anomalies in new data, use ML.DETECT_ANOMALIES and provide new data as input:
Language: SQL
SELECT*FROMML.DETECT_ANOMALIES(MODEL `mydataset.my_autoencoder_model`,STRUCT(0.02 AS contamination),(SELECT * FROM `mydataset.newdata`));

How does anomaly detection work for autoencoder models?
Anomalies are identified based on the value of each input data point’s reconstructed error, which, if exceeds a threshold determined by the contamination value, is identified as an anomaly. How does this work exactly? With an autoencoder model and data as inputs, ML.DETECT_ANOMALIES first computes the mean_squared_error for each data point between its original values and its reconstructed values. The contamination value, specified by the user, determines the threshold of whether a data point is considered an anomaly. For example, a contamination value of 0.1 means that the top 10% of descending error from the training data will be used as the cut-off threshold. Setting an appropriate contamination will be highly dependent on the requirements of the user or business.
For more information on anomaly detection with autoencoder models, please see the documentation here.
Anomaly detection with an ARIMA_PLUS time-series model

With ML.DETECT_ANOMALIES, you can now detect anomalies using ARIMA_PLUS time series models in the (historical) training data or in new input data. Here are some examples of when might you want to detect anomalies with time-series data:
Detecting anomalies in historical data:
- Cleaning up data for forecasting and modeling purposes, e.g. preprocessing historical time series before using them to train an ML model.
- When you have a large number of retail demand time series (thousands of products across hundreds of stores or zip codes), you may want to quickly identify which stores and product categories had anomalous sales patterns, and then perform a deeper analysis of why that was the case.
Forward looking anomaly detection:
- Detecting consumer behavior and pricing anomalies as early as possible: e.g. if traffic to a specific product page suddenly and unexpectedly spikes, it might be because of an error in the pricing process that leads to an unusually low price.
- When you have a large number of retail demand time series (thousands of products across hundreds of stores or zip codes), you would like to identify which stores and product categories had anomalous sales patterns based on your forecasts, so you can quickly respond to any unexpected spikes or dips.
How do you detect anomalies using ARIMA_PLUS? Begin by creating an ARIMA_PLUS time series model:
Language: SQL
CREATE OR REPLACE MODEL mydataset.my_arima_plus_modelOPTIONS(MODEL_TYPE='ARIMA_PLUS',TIME_SERIES_TIMESTAMP_COL='date',TIME_SERIES_DATA_COL='total_amount_sold',TIME_SERIES_ID_COL='item_name',HOLIDAY_REGION='US') ASSELECTdate,item_description AS item_name,SUM(bottles_sold) AS total_amount_soldFROM`bigquery-public-data.iowa_liquor_sales.sales`GROUP BYdate,item_nameHAVINGdate BETWEEN DATE('2016-01-04') AND DATE('2017-06-01')AND item_name IN ("Black Velvet", "Captain Morgan Spiced Rum","Hawkeye Vodka", "Five O'Clock Vodka", "Fireball Cinnamon Whiskey");
To detect anomalies in the training data, use ML.DETECT_ANOMALIES with the model obtained above:
Language: SQL
SELECT*FROMML.DETECT_ANOMALIES(MODEL `mydataset.my_arima_plus_model`,STRUCT(0.8 AS anomaly_prob_threshold));

To detect anomalies in new data, use ML.DETECT_ANOMALIES and provide new data as input:
Language: SQL
WITHnew_data AS (SELECTdate,item_description AS item_name,SUM(bottles_sold) AS total_amount_soldFROM`bigquery-public-data.iowa_liquor_sales.sales`GROUP BYdate,item_nameHAVINGdate BETWEEN DATE('2017-06-02')AND DATE('2017-10-01')AND item_name IN ('Black Velvet','Captain Morgan Spiced Rum','Hawkeye Vodka',"Five O'Clock Vodka",'Fireball Cinnamon Whiskey') )SELECT*FROMML.DETECT_ANOMALIES(MODEL `mydataset.my_arima_plus_model`,STRUCT(0.8 AS anomaly_prob_threshold),(SELECT*FROMnew_data));

For more information on anomaly detection with ARIMA_PLUS time series models, please see the documentation here.
Thanks to the BigQuery ML team, especially Abhinav Khushraj, Abhishek Kashyap, Amir Hormati, Jerry Ye, Xi Cheng, Skander Hannachi, Steve Walker, and Stephanie Wang.
Leverage the Power of Looker to Extract Data Value at Web Scale

4436
Of your peers have already read this article.
3:00 Minutes
The most insightful time you'll spend today!
Data science can be applied to business problems to improve practices and help to strengthen customer satisfaction. In this blog, we address how the addition of Looker extends the value of your Google Cloud investments to help you understand your customer journey, unlock value from first-party data, and optimize existing cloud infrastructure.
Data is a powerful tool
While everyone doesn’t need to understand the nuts and bolts of data technologies, most people do care about the value data can create for them — how it can help them do their jobs better. Within the data space, we are seeing a trend of ongoing failure to make data accessible to “humans” – the industry still hasn’t figured out how to put data into the hands of people when and where they need it, how they need it.
What if everyone in your organization could analyze data at scale, and make more-informed, fact-based decisions? Data and insights derived from data are valuable but only if your users see it. We think Looker helps solve that.
Solutions tell a larger story of how it all fits together
Across all verticals and industries, businesses benefit from knowing and understanding their customers better. Many business goals are to increase revenue by improving product recommendations and pricing optimization, improving the user experience through targeted marketing and personalization, and reducing churn while improving retention rates. To help reach these goals, key strategies should focus on understanding customer needs, their motivations, likes and dislikes, and using all available data – in other words, put yourself in the shoes of your customer.
Our goal with Looker solutions is to offer the right level of out-of-box support that allows customers to get to value quickly, while maintaining the necessary flexibility. We aim to offer a library of data-driven solutions that accelerate data projects. Many solutions include Looker Blocks (pre-built pieces of code that accelerate data exploration environments) and Actions (custom integrations) that get customers up and running quickly and lets you build business-friendly access points for Google Cloud functionality like BQML, App Engine and Cloud Functions.
Below, you’ll find a sampling of the newest Looker solutions.
Listening to customers by looking at the data
Looker’s solution for Contact Center AI (CCAI), helps businesses gain a deeper understanding and appreciation of their customers’ full journey by unlocking insights from all their company’s first-party data. Call centers can converse naturally with customers and deliver outstanding experiences by leveraging artificial intelligence. CCAI‘s newest product —CCAI Insights — reviews conversations support agents are having, finding and annotating the data with the important information, and identifying the calls that need review. We’ve partnered with the product teams at CCAI to build Looker’s Block for CCAI Insights, which sets you on the path to integrating the advanced insights into your first-party data in Looker, overlaying business data with the customer experience.

Businesses can better understand contact center experiences and take immediate action when necessary to make sure the most valuable customers receive the best service.
Realizing full business value of First-Party data
Looker for Google Marketing Platform (GMP) provides marketers the power to unlock the value of their company’s first-party data to more effectively target audiences. The Looker Blocks and Actions for GMP offer interactive data exploration, slices of data with built-in ML predictions and activation paths back to the GMP. This strategic solution continues to evolve with the Looker Action for Google Ads (Customer Match), the Looker Action for Google Analytics (Data Import) and the Looker Block for Google Analytics 4 (GA4).
- The Looker Action for Customer Match allows marketers to send segments and audiences based on first-party data directly into Google Ads. Reach users cross-device and across the web’s most powerful channels such as Display, Video, YouTube, and Gmail. The entire process is performed within a single screen in Looker, and is able to be completed in a few minutes by a non-technical user.
- The Looker Action for Data Import can be used to enhance user segmentation and remarketing audiences in Google Analytics by taking advantage of user information accessible in Looker, such as in CRM systems or transactional data warehouses.
- The Looker Block for Google Analytics 4 (GA4) expands the solution’s support with out-of-the-box dashboards and pre-baked BigQuery ML models for the newest version of Google Analytics.The Looker Block offers up reports with flexible configuration capabilities to unlock custom insights beyond the standard GA reporting. Customize audience segments, define custom goals to track and share these reports with teams who do not have access to the GA console.
From clinical notes to patient insights at scale
Taking a look at the Healthcare vertical, the Looker Healthcare NLP API Block serves as a critical bridge between existing care systems and applications hosted on Google Cloud providing a managed solution for storing and accessing healthcare data in Google Cloud. The Healthcare NLP API uses natural language models to extract healthcare information from medical text, rapidly unlocking insights from unstructured medical text and providing medical providers with simplified access to intelligent insights. Healthcare providers, payers, and pharma companies can quickly understand the context and relationships of medical concepts within the text, such as medications, procedures, conditions, clinical history, and begin to link this to other clinical data sources for downstream AI/ML.
Specifically, the natural language processing (NLP) Patient View (pictured below) allows you to review a single selected patient of interest, surfacing their clinical notes history over time. It informs clinical diagnosis with family history insights, which is not currently captured in claims, and captures additional procedure coding for revenue cycle purposes.

The dashboard below shows the NLP Term View which allows users to focus on chosen medical terms across the entire patient population in the dataset so they can start to view trends and patterns across groups of patients.

This data can be used to:
- Enhance patient matching for clinical trials
- Identify re-purposed medications
- Drive advancements for research in cancer and rare diseases
- Identify how social determinants of health impact access to care
Managing Costs Across Clouds
Effective cloud cost management is important for reasons beyond cost control — it provides you the ability to reduce waste and predictably forecast both costs and resource needs. Looker’s solution for Cloud Cost Management offers quick access to necessary reporting and clear insights into cloud expenditures and utilization.
This solution brings together billing data from different cloud providers in a phased approach: get up and running quickly with Blocks optimized for where the data is today (Google Cloud, AWS or Azure) as you work towards more sophisticated analysis for cross-platform planning and even cloud spend optimization with the mapping of tags, labels and cost centers across clouds.
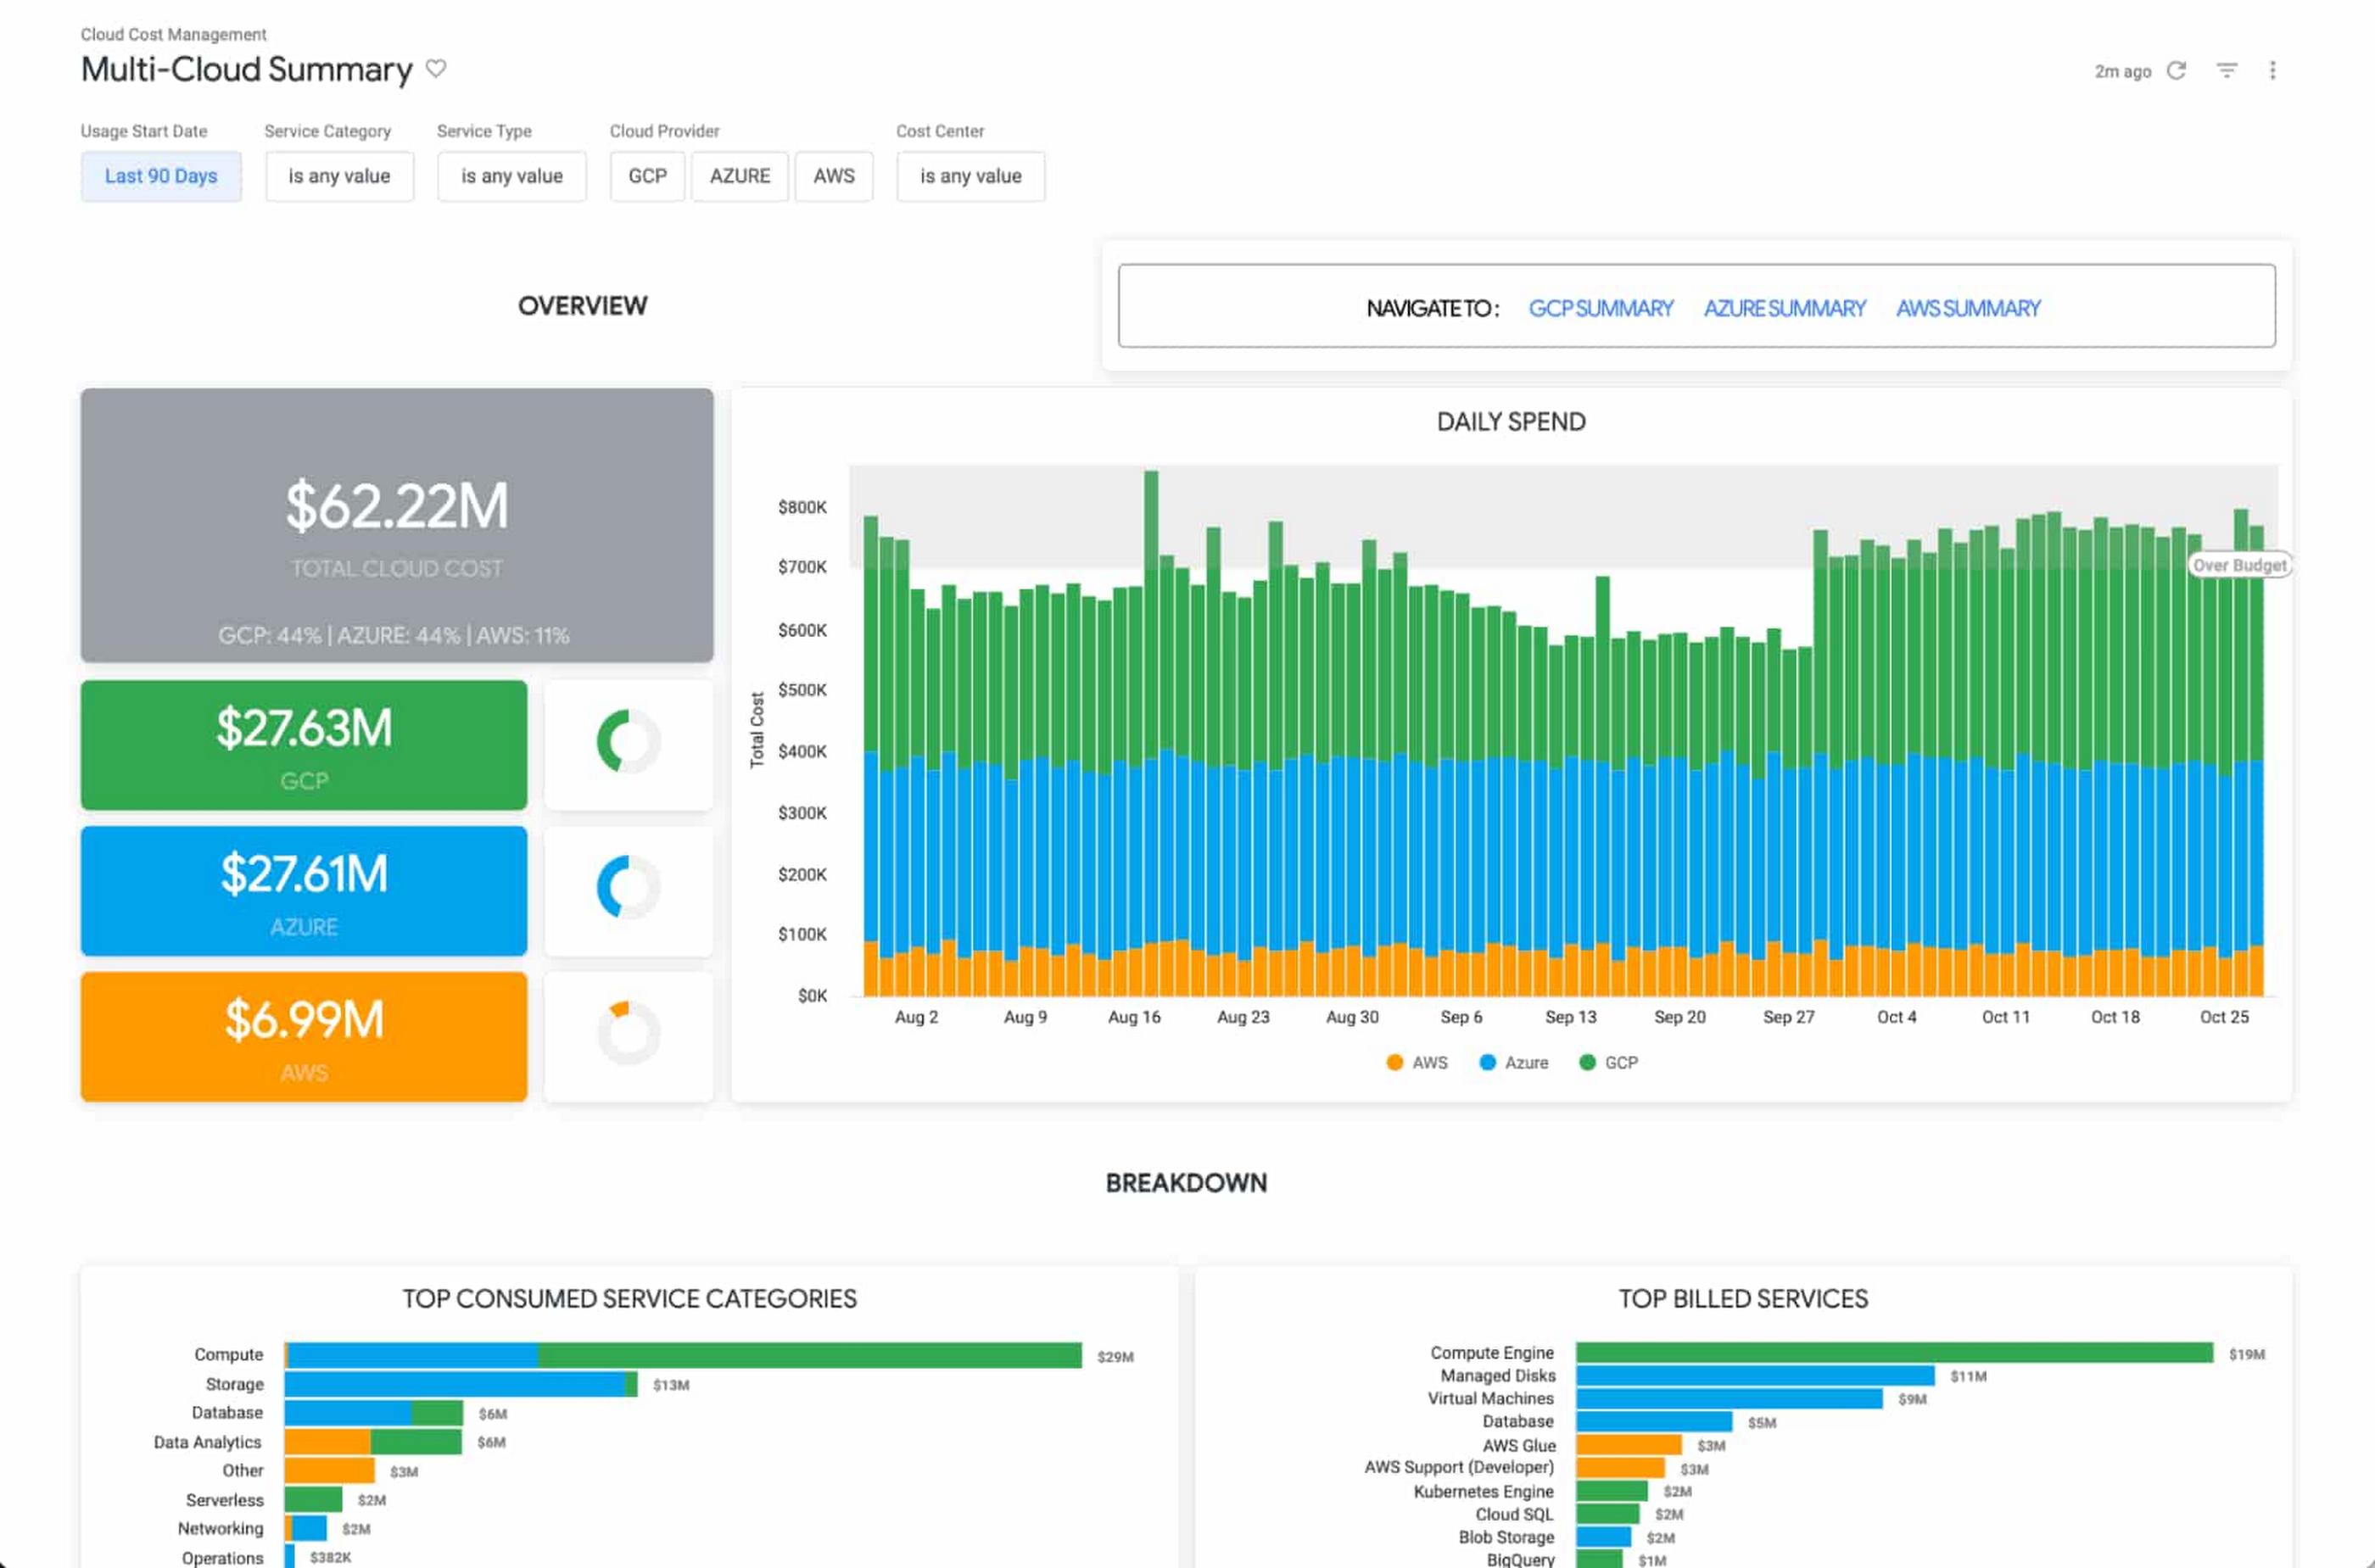
The Looker Cloud Cost Management solution provides operational teams struggling to monitor, understand, and manage the costs and needs associated with their cloud technology with a comprehensive view into what, where and why they are spending money.
Making better decisions with Looker-powered data
Leading companies are discovering ways to get value from all of that data beyond displaying it in a report or a dashboard. They want to enable everyone to make better decisions but that’s only going to happen if everyone can ask questions of the data, and get reliable, correct answers without using outdated or incomplete data and without waiting for it. People and systems need to have data available to them in the way that makes the most sense for them at that moment.
It’s clear that successful data-driven organizations will lead their respective segments not because they use data to create reports, but because they use it to power data experiences tailored to every part of the business, including employees, customers, operational workflows, products and services.
As people’s way of experiencing data has evolved, more than ever before, dashboards alone are not enough. You can use data as fuel for data-driven business workflows, and to power digital experiences that improve customer engagement, conversions, and advocacy.
From Nov. 9 – 11th, Looker is hosting its annual conference JOIN, where we’ll be showing new features, including how we help to:
- Build data experiences at the speed of business
- Accelerate the business value with packaged experiences
- Unleash more insights for more people in the right way – Deliver data experiences at scale
There is no cost to attend JOIN. Register here and learn how Looker helps organizations build and deliver custom data-driven experiences that goes beyond just reports and dashboards, scales and grows with your business, allows developers to build innovative data products faster, and ensures data reaches everyone.
How Vertex AI NAS is Suitable for Most Advanced ML Workloads

4460
Of your peers have already read this article.
3:00 Minutes
The most insightful time you'll spend today!
Vertex AI launched with the premise “one AI platform, every ML tool you need.” Let’s talk about how Vertex AI streamlines modeling universally for a broad range of use cases.
The overall purpose of Vertex AI is to simplify modeling so that enterprises can fast track their innovation, accelerate time to market, and ultimately increase return on ML investments. Vertex AI facilitates this in several ways. Features like Vertex AI Workbench, for example, speed up training and deployment of models by five times compared to traditional notebooks. Vertex AI Workbench’s native integration with BigQuery and Spark means that users without data science expertise can more easily perform machine learning work. Tools integrated into the unified Vertex AI platform, such as state of the art pre-trained APIs and AutoML, make it easier for data scientists to build models in less time. And for modeling work that lends itself best to custom modeling, Vertex AI’s custom model tooling supports advanced ML coding, with nearly 80% fewer lines of code required (compared to competitive platforms) to train a model with custom libraries. Vertex AI delivers all this while maintaining a strong focus on Explainable AI.
Yet organizations with the largest investments in AI and machine learning, with teams of ML experts, require extremely advanced toolsets to deliver on their most complex problems. Simplified ML modeling isn’t relegated to simple use cases only.
Let’s look at Vertex AI Neural Architecture Search (NAS), for instance.
Vertex AI NAS enables ML experts at the highest level to perform their most complex tasks with higher accuracy, lower latency, and low power requirements. Vertex AI NAS originates from the deep experience Alphabet has with building advanced AI at scale. In 2017, the Google Brain team recognized we need a better way to scale AI modeling, so they developed Neural Architecture Search technology to create an AI that generates other neural networks, trained to optimize their performance in a specific task the user provides. To the astonishment of many in the field, these AI-optimized models were able to beat a number of state of the art benchmarks, such as ImageNet and SOTA mobilenets, setting a new standard for many of the applications we see in use today, including many Google-internal products. Google Cloud saw the potential of such a technology and shipped in less than a year a productized version of the technique (under the brand AutoML). Vertex AI NAS is the newest and most powerful version of this idea, using the most sophisticated innovation that has emerged since the initial research.
Customer organizations are already implementing Vertex AI NAS for their most advanced workloads. Autonomous vehicle company Nuro is using Vertex AI NAS, and Jack Guo, Head of Autonomy Platform at the company, states, “Nuro’s perception team has accelerated their AI model development with Vertex AI NAS. Vertex AI NAS have enabled us to innovate AI models to achieve good accuracy and optimize memory and latency for the target hardware. Overall, this has increased our team’s productivity for developing and deploying perception AI models.”
And our partner ecosystem is growing for Vertex AI NAS. Google Cloud and Qualcomm Technologies have collaborated to bring Vertex AI NAS to the Qualcomm Technologies Neural Processing SDK, optimized for Snapdragon 8. This will bring AI to different device types and use cases, such as those involving IoT, mixed reality, automobiles, and mobile.
Google Cloud’s commitments to making machine learning more accessible and useful for data users, from the novice to the expert, and to increasing the efficacy of machine learning for enterprises are at the core of everything we do. With the suite of unified machine learning tools within Vertex AI, organizations can take advantage of every ML tool they need on one AI platform.
Ready to start ML modeling with Vertex AI? Start building for free. Want to know how Vertex AI Platform can help your enterprise increase return on ML investments? Contact us.
3370
Of your peers have already watched this video.
16:30 Minutes
The most insightful time you'll spend today!
Scaling Data-Driven Insights Across a Complex Global Organization with Looker and BigQuery
In this video, SpringML and Iron Mountain share how migrating data to Google Cloud not only saved hundreds of thousands of dollars in licensing consolidation but allows stakeholders across a complex global organization to:
- Consolidate 1,200 data management applications into one data lake
- Unify information governance practices across disparate corporate verticals and departments
- Provide a single view of operational and customer data for enhanced decision making across 43 countries and 200 acquisitions
- Unlock the power of data science and predictive analytics
Standardizing across varying systems and processes onto one platform took just a matter of weeks for a project that could have taken about a year.
SpringML and Iron Mountain share how this was done, lessons learned and next steps for their collaboration adopting Looker and BigQuery into Iron Mountain.
3629
Of your peers have already watched this video.
5:00 Minutes
The most insightful time you'll spend today!
Quick Demo: How to Push Data to PubSub, Dataflow, and BigQuery to Improve Customer Experience
How can you use big data to raise your business’ customer experience levels? It’s a question many
Imagine for
Here’s an example: Customers taking a Monday morning flights from certain hubs would indicate that they are business users. These customers would appreciate being offered in-flight Wifi. Such a targetted offer would increase both customer experience and revenues.
In this five-minute demo, you’ll learn how easy it is to query data sets to reveal, for example, which passengers have connecting flights—and also have checked-in luggage—and would
Watch it now!
Home Depot’s Interconnected Retail Experience by Virtue of Google Cloud Migration for SAP Applications

8248
Of your peers have already read this article.
1:30 Minutes
The most insightful time you'll spend today!
With nearly 2,300 stores, The Home Depot is the world’s largest home-improvement chain — a brand that professional contractors and DIYers alike have come to depend on. The home improvement industry continues to experience unprecedented demand and dramatic increases in online ordering accompanied by expanding consumer expectations for things like curbside pickup and same day delivery. The Home Depot’s decision to migrate to cloud-based infrastructure, including the migration of the company’s SAP applications on Google Cloud which began in 2017, has set it up for success in an increasingly digital world, and helped the company adapt to changing market conditions quickly.
Interconnected retail at scale
Building on a strong customer-first philosophy, The Home Depot aims to create what it calls interconnected retail—allowing customers to shop however, whenever, and wherever they want. “So many companies are focused on omni-channel retail,” explains Sam Moses, Vice President of Corporate Systems. “At The Home Depot, we wanted to take it to the next level. Interconnected retail puts the customer at the center of everything and enables them to shop in store, online, or both. Customers can begin a transaction online and continue in-store, or vice-versa.”
To support this strategy, the company’s SAP environment needed to be more agile. Running everything on-premises, from central finance to POS systems, meant that The Home Depot’s IT teams experienced redundancy and repetitive, manual processes. Their data warehouse needed an upgrade to process and analyze growing and increasingly diverse data sets. The Home Depot chose to migrate its SAP environment to Google Cloud to support both the velocity and scale needed for the business as well as critical analytics capabilities needed for its bold digital initiatives. “We chose Google Cloud to support our SAP implementation. Our decision had a lot to do with the relationship between Google Cloud and SAP and also for the applications and services that are offered by Google Cloud, like BigQuery, which are helping to enable data and analytics within our organization,” Moses explains.
After migrating its SAP applications—including S/4HANA, its customer activity repository (CAR), general ledger, e-commerce system, enterprise data warehouse and more to Google Cloud, the company now has the speed, scale and flexibility to tackle enormous spikes in the business, all while staying fully available for their customers. Additionally, The Home Depot was able to transform its financial systems and make them more agile to deliver critical information across multiple business functions in real time.
Maximizing data insights to support customer experiences
By migrating to Google Cloud, The Home Depot is leveraging Google Cloud analytics to build the industry’s most efficient supply chain including more robust demand forecasting, supplier lead times, estimated delivery times and more, all while maintaining better security than before. “We experienced unprecedented change in our customers’ behavior and their buying patterns, which puts a lot of pressure on our supply chain,” explains Moses. “So having the ability to leverage data and analytics gives us insights to know exactly what it is that our customers need.”
The company’s analysts now use BigQuery ML for machine learning directly against the company’s BigQuery data and use AutoML to determine the best model for predictions. The Home Depot’s engineers have also adapted BigQuery to monitor, analyze, and act on application performance data across all its stores and warehouses in real time—capabilities that were not as seamless in the on-premises environment.
With hundreds of projects on Google Cloud, The Home Depot’s cloud journey is well on track, but the company is always looking to the future. “As our customers’ needs have continued to evolve, and as technology has continued to evolve, our relationship with Google will continue to advance — to be able to innovate together, to be able to find new solutions together, to better serve our customers.”
Learn more about how The Home Depot is renovating its retail operation with SAP on Google Cloud.
More Relevant Stories for Your Company

3 AI Tools You Can Deploy Immediately
AI has the power to revolutionize every industry—from retail to agriculture, and education to healthcare. Yet many businesses still haven’t begun to adopt AI. There are a number of factors, including the need for specialized talent and hardware, the right types and quantities of data for training and refining machine

Build Open Data Platform on GCP with Delta Lake, Presto and Dataproc
Organizations today build data lakes to process, manage and store large amounts of data that originate from different sources both on-premise and on cloud. As part of their data lake strategy, organizations want to leverage some of the leading OSS frameworks such as Apache Spark for data processing, Presto as a query engine and

Beyond Traditional Learning: AI-based Online Learning Platform and Google Cloud Solutions Push Learners to Get Ahead
The combination of a vital need for IT experts among businesses and a digital skills gap is making lifelong learning increasingly critical. Beyond professional development, learning new skills offers additional rewards from building peer connections to boosting your creativity. That’s why in 2020 Krishna Deepak Nallamilli and I launched KIMO.ai to reimagine how people

How Google Cloud Solutions Help Retail Firms to ABP(Always Be Pivoting)
For years, retailers have been told that they must embrace a litany of new technologies, trends, and imperatives like online shopping, mobile apps, omnichannel, and digital transformation. In search of growth and stability, retailers adopted many of these, only to realize that for every box they ticked, there was another
