






7679
Of your peers have already downloaded this article
4:30 Minutes
The most insightful time you'll spend today!
4409
Of your peers have already watched this video.
28:30 Minutes
The most insightful time you'll spend today!
Data Leaders in 2021 and Beyond: How to Prepare
As technologies and workplace environments are quickly evolving, how people and businesses leverage data in their day-to-day workflow is also changing.
Data leaders are an emerging force navigating and charting pathways forward towards new horizons for how people and organizations experience data.
In this presentation, Pedro Arellano, Product Marketing Director, Looker, will cover three areas:
- Underline that the value of data within an organization is no longer up for debate. Everybody needs data, and everybody’s job has the potential to be improved with data.
- Three trends that will help put into context how we’ve arrived at this particular moment of such great potential for data.
- Why data leaders, almost regardless of their title, are now in a position to really influence the direction of organization like never before.
Learn what’s guiding the thinking of data leaders in 2021 and beyond.
3745
Of your peers have already watched this video.
5:00 Minutes
The most insightful time you'll spend today!
What’s BigQuery and Why Should IT Managers Care?
Today it’s impossible for anyone working in IT teams to have a day go by without a discussion about data, analytics, and big data.
Often these conversations veer towards BigQuery. Many IT managers are unsure what BigQuery is and what it does. If you are one of them, you aren’t alone.
Google BigQuery is a fast, highly-scalable, cost-effective, and fully managed cloud data warehouse for analytics, with built-in machine learning.
To better understand what the benefits of BigQuery are, it’s important to grasp some of the challenges that
These are some of the challenges that Google BigQuery fixes. To get a quick snapshot of what Google BigQuery does, watch this short video.
7680
Of your peers have already downloaded this article
4:30 Minutes
The most insightful time you'll spend today!
AI has the power to revolutionize every industry—from retail to agriculture, and education to healthcare. Yet many businesses still haven’t begun to adopt AI.
There are a number of factors, including the need for specialized talent and hardware, the right types and quantities of data for training and refining machine learning models, and of course, the broader complexities of introducing a new way of working inside an organization.
But above all, AI can be challenging to apply to very specific business needs.
Google wants to change that, which is why it’s introducing a number of AI solutions aimed at making it easier for businesses to use AI to address many of these specific use cases.
Google’s AI solutions fall into two categories. The first is a set of pre-packaged AI solutions that can be easily integrated into existing workflows. To make these solutions as easy to implement as possible, Google works with popular, trusted enterprise partners who have deep-domain expertise in these workflows.
The majority of Google’s pre-packaged solutions will be delivered through these partners, although it will be offering some
The second category of AI solutions is comprised of reference architectures that businesses can use to create highly-custom AI tools. These require more development work than Google’s pre-packaged
Additionally, businesses can build on these architectures and deploy them to market more quickly, helping your business take advantage of AI, faster.
Learn more about all Google’s AI solutions. Download the whitepaper now!
2984
Of your peers have already watched this video.
39:00 Minutes
The most insightful time you'll spend today!
Verizon Media Shows the Solution Architecture it Uses for a 100+ PB Analytics Platform
Verizon Media owns and operates more than a dozen brands including Yahoo Mail, Yahoo News, AOL, Huffington Post, TechCrunch, and Engadget among others.
These web properties are visited by millions of users on a daily basis.
In this session, Shakil Memon, Customer Engineer, Google Cloud and Nikhil Mishra, Sr Director, Engineering, Verizon Media, present how Verizon Media is generating actionable insights from the wealth of data that they have.
They will discuss:
- Challenge with large scale and large volumes of data
- Basic principles of a data warehousing and data analytics project
- Showcase a reference architecture
- A complete end-to-end solution architecture for building a 100+ PB internet-scale analytics platform on Google Cloud, including how Looker fits in the end-to-end solution and how actionable insights are generated from data.
They will also provide unique perspectives, behind-the-scenes thinking, and some insight on how the architecture has evolved in its current form over the years.
How AI and ML Helps Interpret Baseball Fandom during this MLB Season

4545
Of your peers have already read this article.
1:30 Minutes
The most insightful time you'll spend today!
The game of baseball has no shortage of statistics — from batting average to exit velocity, strikeouts to wins above replacement. Among all sports, Major League Baseball (MLB) arguably contains the most analytical and data-driven participants and fan base. Subconsciously or viscerally, players and managers on the field and those following from anywhere are constantly assessing and making decisions based off of game play trends and expectations — whether a batter will come through with a hit in an important situation, when a pitcher should be pulled. Less analyzed, however, is what leads fans to become engaged with certain players or teams, and what factors drive their love of the game. This is the motivation behind the problem being posed by Major League Baseball in their Kaggle competition for Player Digital Engagement Forecasting. Can you use machine learning to deconstruct baseball fandom?
This competition asks you to predict measures of digital engagement for each active player on a daily basis during the MLB season. So, how large was the surge in fan interest after Joe Musgrove threw the first no-hitter in Padres history? Is Shohei Ohtani’s engagement higher when he pitches well, when he hits a monster home run…or when he does both? You’re provided a wealth of game, team and player information – detailed stats, awards, rosters, and transaction information – as well as social and digital engagement data as your inputs. Data scientists will recognize this as an exciting forecasting problem with both traditional regression and time series components, where having this input data just prior to the prediction date is critical to determining which players will receive the most engagement.
With so many variables in the game, there are an endless number of vectors which could possibly influence fan engagement. Eleven-time All-Star Miguel Cabrera delighted fans by hitting the first home run of the season – in the snow! Occasionally a lesser-known player like Musgrove or Carlos Rodón “wins the day” with an unlikely no-hitter. And sometimes just getting traded to an iconic franchise like the Yankees generates a ton of fan interest, like it did for Rougned Odor in early April.
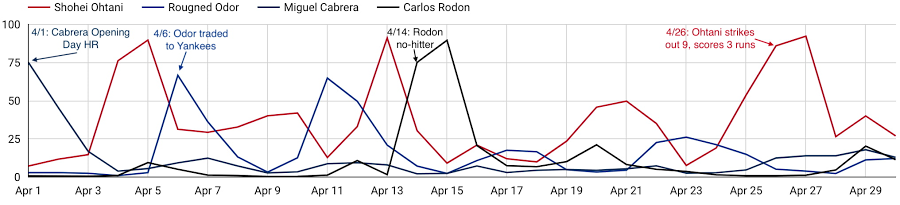
As these examples show, a player’s digital engagement can be pretty dynamic during the season, with many different potential contributors to who is “trending” on a given day. How can you use data to uncover which factors are the most influential of engagement with each player’s digital content?
Ready to play ball? Check out the competition on Kaggle for all the details. $50,000 in prizes is up for grabs in two prize categories. The code competition puts your machine learning skills to the test, to see who can build the most accurate forecasting models to predict daily digital engagement for every active player. You’ll have until July 31st to build your models and then be evaluated on a future time frame, which will determine the winners. For data visualization and exploration experts out there, the explainability prizes give you an opportunity to analyze more broadly which factors, even those outside of what we’re providing directly, most influence digital engagement. You’ll be evaluated on how well you can use what the data is telling you to support your findings.
And if you’re looking to get started, we’ve provided an introductory video and some notebook tutorials, including a starting point for harnessing the power of Vertex AI through tools including Cloud Notebooks, Explainable AI, and Vizier.
With the second half of the season upon us, it’s an exciting time to be an MLB fan. With this Kaggle competition, it’s also a perfect opportunity to use data science to help understand baseball fandom and potentially earn some of your own accolades in the process. Step up to the plate!
Major League Baseball trademarks and copyrights are used with permission of Major League Baseball. Visit MLB.com.
More Relevant Stories for Your Company

The Data Scientist Guide to Preparing and Curating Data for AI
To design and implement a successful machine learning (ML) project, you often need to collaborate with multiple teams, including those in business, sales, research, and engineering. Understanding the essentials of gathering and preparing your data is crucial to align teams, and getting a project off the ground. Building an ML

What is Dataflow?
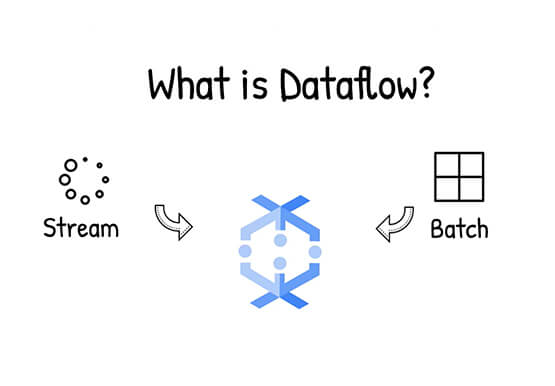
What is Dataflow, and how can you use it for your data processing needs? In this episode of Google Cloud Drawing Board, Priyanka Vergadia walks you through Dataflow, a serverless system for processing and enriching data, supporting both streaming and batch models. Here's what's inside: 0:00 - 0:14 Video snapshot0:15

Ahead of the Curve: 5 Data and AI Trends Set to Shape 2023
How will your organization manage this year's data growth and business requirements? Your actions and strategies involving data and AI will improve or undermine your organization's competitiveness in the months and years to come. Our teams at Google Cloud have an eye on the future as we evolve our strategies

This Chart, from Home Depot, Dramatically Demonstrates the Power of a Cloud Data Warehouse
The Home Depot (THD) is the world’s largest home-improvement chain, growing to more than 2,200 stores and 700,000 products in four decades. Much of that success was driven through the analysis of data. This included developing sales forecasts, replenishing inventory through the supply chain network, and providing timely performance scorecards. However,
