





New Capabilities in BigQuery to Ease Anomalies Detection in the Absence of Labeled Data

6322
Of your peers have already read this article.
4:00 Minutes
The most insightful time you'll spend today!
When it comes to anomaly detection, one of the key challenges that many organizations face is that it can be difficult to know how to define what an anomaly is. How do you define and anticipate unusual network intrusions, manufacturing defects, or insurance fraud? If you have labeled data with known anomalies, then you can choose from a variety of supervised machine learning model types that are already supported in BigQuery ML. But what can you do if you don’t know what kind of anomaly to expect, and you don’t have labeled data? Unlike typical predictive techniques that leverage supervised learning, organizations may need to be able to detect anomalies in the absence of labeled data.
Today we are announcing the public preview of new anomaly detection capabilities in BigQuery ML that leverage unsupervised machine learning to help you detect anomalies without needing labeled data. Depending on whether or not the training data is time series, users can now detect anomalies in training data or on new input data using a new ML.DETECT_ANOMALIES function (documentation), with the following models:
- Autoencoder model, now in Public Preview (documentation)
- K-means model, already GA (documentation)
- ARIMA_PLUS time series model, already GA (documentation)
How does anomaly detection with ML.DETECT_ANOMALIES work?
To detect anomalies in non-time-series data, you can use:
- K-means clustering models: When you use
ML.DETECT_ANOMALIESwith a k-means model, anomalies are identified based on the value of each input data point’s normalized distance to its nearest cluster. If that distance exceeds a threshold determined by the contamination value provided by the user, the data point is identified as an anomaly. - Autoencoder models: When you use
ML.DETECT_ANOMALIESwith an autoencoder model, anomalies are identified based on the reconstruction error for each data point. If the error exceeds a threshold determined by the contamination value, it is identified as an anomaly.
To detect anomalies in time-series data, you can use:
- ARIMA_PLUS time series models: When you use
ML.DETECT_ANOMALIESwith an ARIMA_PLUS model, anomalies are identified based on the confidence interval for that timestamp. If the probability that the data point at that timestamp occurs outside of the prediction interval exceeds a probability threshold provided by the user, the datapoint is identified as an anomaly.
Below we show code examples of anomaly detection in BigQuery ML for each of the above scenarios.
Anomaly detection with a k-means clustering model
You can now detect anomalies using k-means clustering models, by running ML.DETECT_ANOMALIES to detect anomalies in the training data or in new input data. Begin by creating a k-means clustering model:
Language: SQL
CREATE MODEL `mydataset.my_kmeans_model`OPTIONS(MODEL_TYPE = 'kmeans',NUM_CLUSTERS = 8,KMEANS_INIT_METHOD = 'kmeans++') ASSELECT* EXCEPT(Time, Class)FROM`bigquery-public-data.ml_datasets.ulb_fraud_detection`;
With the k-means clustering model trained, you can now run ML.DETECT_ANOMALIES to detect anomalies in the training data or in new input data.
To detect anomalies in the training data, use ML.DETECT_ANOMALIES with the same data used during training:
Language: SQL
SELECT*FROMML.DETECT_ANOMALIES(MODEL `mydataset.my_kmeans_model`,STRUCT(0.02 AS contamination),TABLE `bigquery-public-data.ml_datasets.ulb_fraud_detection`);

To detect anomalies in new data, use ML.DETECT_ANOMALIES and provide new data as input:
Language: SQL
SELECT*FROMML.DETECT_ANOMALIES(MODEL `mydataset.my_kmeans_model`,STRUCT(0.02 AS contamination),(SELECT * FROM `mydataset.newdata`));

How does anomaly detection work for k-means clustering models?
Anomalies are identified based on the value of each input data point’s normalized distance to its nearest cluster, which, if exceeds a threshold determined by the contamination value, is identified as an anomaly. How does this work exactly? With a k-means model and data as inputs, ML.DETECT_ANOMALIES first computes the absolute distance for each input data point to all cluster centroids in the model, then normalizes each distance by the respective cluster radius (which is defined as the standard deviation of the absolute distances of all points in this cluster to the centroid). For each data point, ML.DETECT_ANOMALIES returns the nearest centroid_id based on normalized_distance, as seen in the screenshot above. The contamination value, specified by the user, determines the threshold of whether a data point is considered an anomaly. For example, a contamination value of 0.1 means that the top 10% of descending normalized distance from the training data will be used as the cut-off threshold. If the normalized distance for a datapoint exceeds the threshold, then it is identified as an anomaly. Setting an appropriate contamination will be highly dependent on the requirements of the user or business.
For more information on anomaly detection with k-means clustering, please see the documentation here.
Anomaly detection with an autoencoder model
You can now detect anomalies using autoencoder models, by running ML.DETECT_ANOMALIES to detect anomalies in the training data or in new input data.
Begin by creating an autoencoder model:
Language: SQL
CREATE MODEL `mydataset.my_autoencoder_model`OPTIONS(model_type='autoencoder',activation_fn='relu',batch_size=8,dropout=0.2,hidden_units=[32, 16, 4, 16, 32],learn_rate=0.001,l1_reg_activation=0.0001,max_iterations=10,optimizer='adam') ASSELECT* EXCEPT(Time, Class)FROM`bigquery-public-data.ml_datasets.ulb_fraud_detection`;
To detect anomalies in the training data, use ML.DETECT_ANOMALIES with the same data used during training:
Language: SQL
SELECT*FROMML.DETECT_ANOMALIES(MODEL `mydataset.my_autoencoder_model`,STRUCT(0.02 AS contamination),TABLE `bigquery-public-data.ml_datasets.ulb_fraud_detection`);

To detect anomalies in new data, use ML.DETECT_ANOMALIES and provide new data as input:
Language: SQL
SELECT*FROMML.DETECT_ANOMALIES(MODEL `mydataset.my_autoencoder_model`,STRUCT(0.02 AS contamination),(SELECT * FROM `mydataset.newdata`));

How does anomaly detection work for autoencoder models?
Anomalies are identified based on the value of each input data point’s reconstructed error, which, if exceeds a threshold determined by the contamination value, is identified as an anomaly. How does this work exactly? With an autoencoder model and data as inputs, ML.DETECT_ANOMALIES first computes the mean_squared_error for each data point between its original values and its reconstructed values. The contamination value, specified by the user, determines the threshold of whether a data point is considered an anomaly. For example, a contamination value of 0.1 means that the top 10% of descending error from the training data will be used as the cut-off threshold. Setting an appropriate contamination will be highly dependent on the requirements of the user or business.
For more information on anomaly detection with autoencoder models, please see the documentation here.
Anomaly detection with an ARIMA_PLUS time-series model

With ML.DETECT_ANOMALIES, you can now detect anomalies using ARIMA_PLUS time series models in the (historical) training data or in new input data. Here are some examples of when might you want to detect anomalies with time-series data:
Detecting anomalies in historical data:
- Cleaning up data for forecasting and modeling purposes, e.g. preprocessing historical time series before using them to train an ML model.
- When you have a large number of retail demand time series (thousands of products across hundreds of stores or zip codes), you may want to quickly identify which stores and product categories had anomalous sales patterns, and then perform a deeper analysis of why that was the case.
Forward looking anomaly detection:
- Detecting consumer behavior and pricing anomalies as early as possible: e.g. if traffic to a specific product page suddenly and unexpectedly spikes, it might be because of an error in the pricing process that leads to an unusually low price.
- When you have a large number of retail demand time series (thousands of products across hundreds of stores or zip codes), you would like to identify which stores and product categories had anomalous sales patterns based on your forecasts, so you can quickly respond to any unexpected spikes or dips.
How do you detect anomalies using ARIMA_PLUS? Begin by creating an ARIMA_PLUS time series model:
Language: SQL
CREATE OR REPLACE MODEL mydataset.my_arima_plus_modelOPTIONS(MODEL_TYPE='ARIMA_PLUS',TIME_SERIES_TIMESTAMP_COL='date',TIME_SERIES_DATA_COL='total_amount_sold',TIME_SERIES_ID_COL='item_name',HOLIDAY_REGION='US') ASSELECTdate,item_description AS item_name,SUM(bottles_sold) AS total_amount_soldFROM`bigquery-public-data.iowa_liquor_sales.sales`GROUP BYdate,item_nameHAVINGdate BETWEEN DATE('2016-01-04') AND DATE('2017-06-01')AND item_name IN ("Black Velvet", "Captain Morgan Spiced Rum","Hawkeye Vodka", "Five O'Clock Vodka", "Fireball Cinnamon Whiskey");
To detect anomalies in the training data, use ML.DETECT_ANOMALIES with the model obtained above:
Language: SQL
SELECT*FROMML.DETECT_ANOMALIES(MODEL `mydataset.my_arima_plus_model`,STRUCT(0.8 AS anomaly_prob_threshold));

To detect anomalies in new data, use ML.DETECT_ANOMALIES and provide new data as input:
Language: SQL
WITHnew_data AS (SELECTdate,item_description AS item_name,SUM(bottles_sold) AS total_amount_soldFROM`bigquery-public-data.iowa_liquor_sales.sales`GROUP BYdate,item_nameHAVINGdate BETWEEN DATE('2017-06-02')AND DATE('2017-10-01')AND item_name IN ('Black Velvet','Captain Morgan Spiced Rum','Hawkeye Vodka',"Five O'Clock Vodka",'Fireball Cinnamon Whiskey') )SELECT*FROMML.DETECT_ANOMALIES(MODEL `mydataset.my_arima_plus_model`,STRUCT(0.8 AS anomaly_prob_threshold),(SELECT*FROMnew_data));

For more information on anomaly detection with ARIMA_PLUS time series models, please see the documentation here.
Thanks to the BigQuery ML team, especially Abhinav Khushraj, Abhishek Kashyap, Amir Hormati, Jerry Ye, Xi Cheng, Skander Hannachi, Steve Walker, and Stephanie Wang.
Dataplex Data Lineage: Leverage the Complete Data Story for Better Business Decisions

1460
Of your peers have already read this article.
3:30 Minutes
The most insightful time you'll spend today!
Today, we are excited to announce the general availability of Dataplex data lineage — a fully managed Dataplex capability that helps you understand how data is sourced and transformed within the organization. Dataplex data lineage automatically tracks data movement across BigQuery, BigLake, Cloud Data Fusion (Preview), and Cloud Composer (Preview), eliminating operational hassles around manual curation of lineage metadata.
With rising data volume spread across data silos, it can be challenging for organizations to ensure users have a self-service mechanism to discover, understand and trust the data. Organizations constantly struggle with questions such as:
- Is the data extracted from an authoritative source?
- What is the impact if I drop this table?
- The data in this table seems corrupted – where did this data come from, and when was it last refreshed?
- How is sensitive information being moved or copied? Is it in adherence to data governance practices?
To answer the above questions, organizations need to track how data is sourced and transformed, which can be complex and requires significant effort.
Dataplex data lineage describes each lineage relationship by detailing what happened and when it happened in an interactable lineage graph, providing data observability.
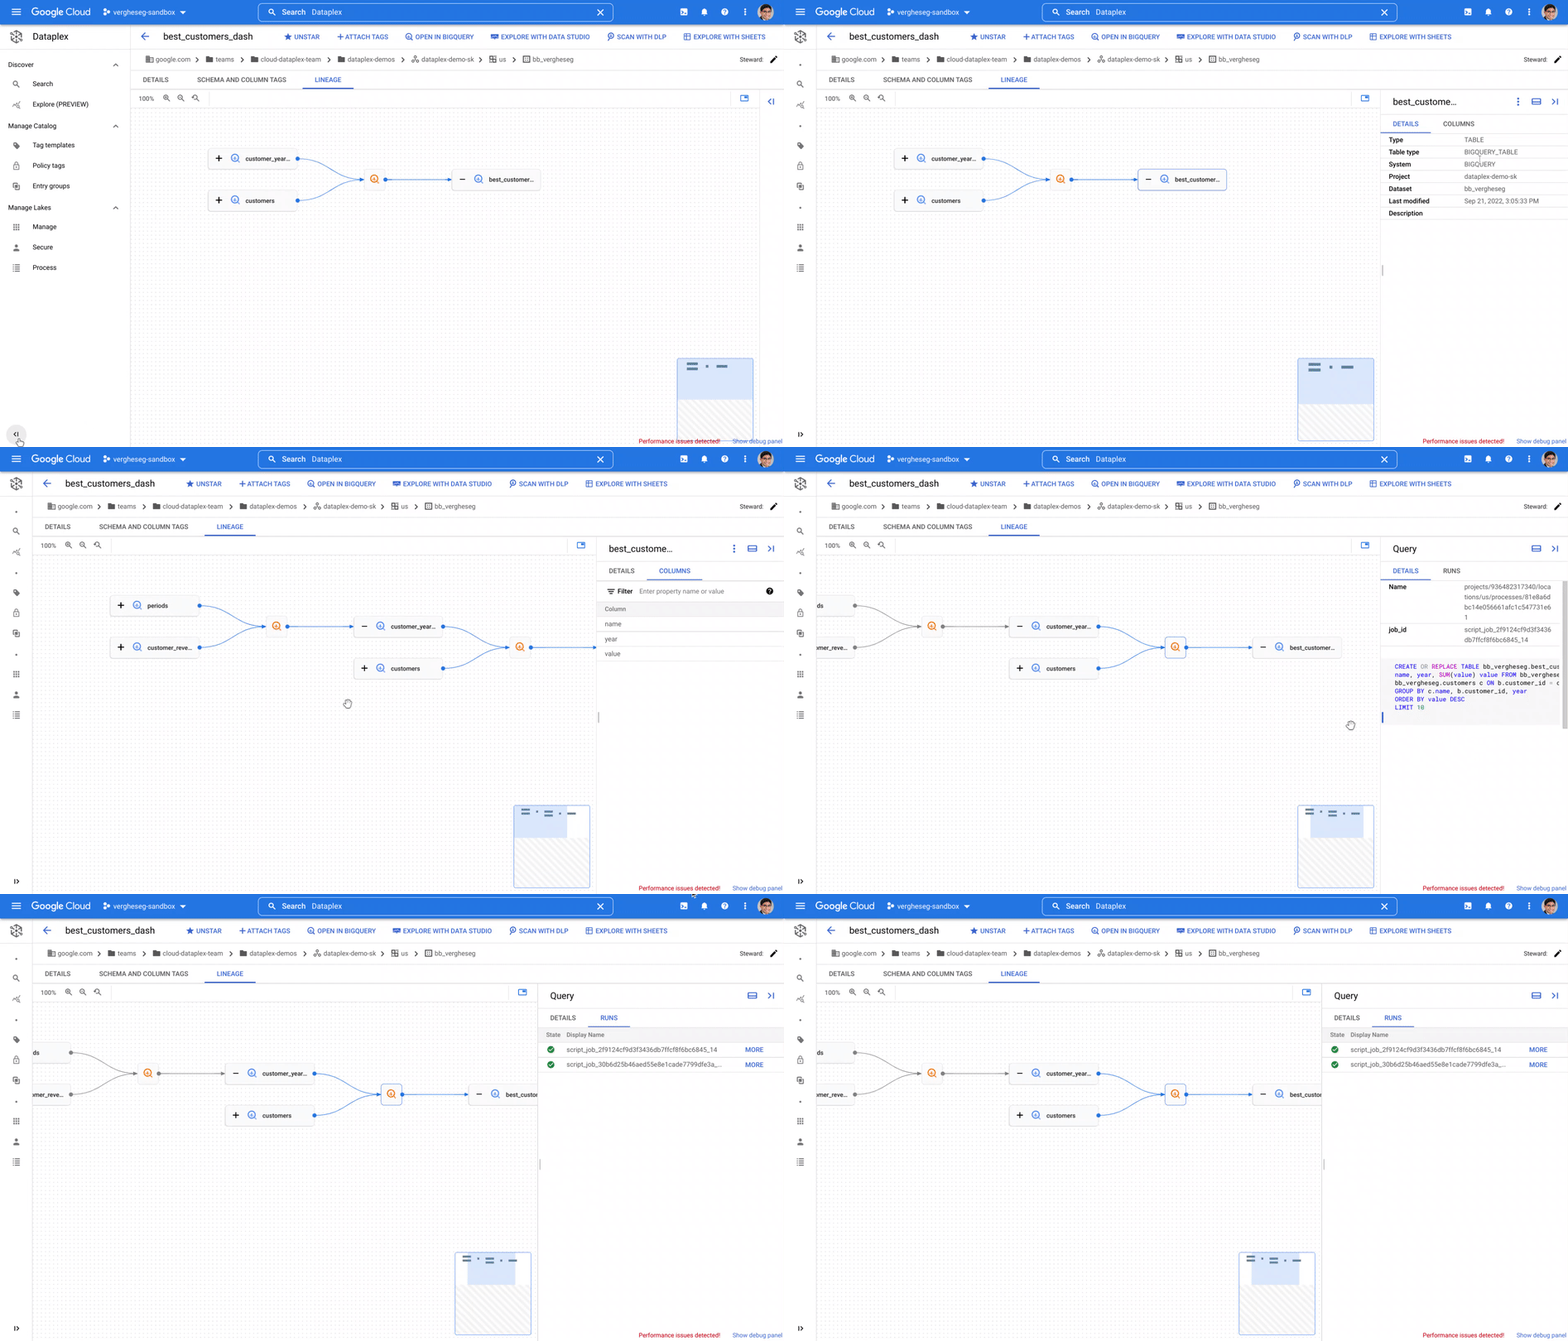
Data analysts who want to know if a table originates from an authoritative source can now answer this in a self-service manner with a simple look-up of lineage for the concerned table — available in Dataplex and in BigQuery for in-context analysis.
Data engineers can reduce time to identify and resolve data issues through root cause analysis using the operational metadata trace asserting a lineage relationship. Data lineage also aids deterministic change management by providing the ability to evaluate the impact of a change and collaborate with the corresponding stakeholders to minimize any adverse impact.
Finally, data lineage provides a map of data movement which can become the foundation for data governance practice. It enables data stewards and owners to evaluate and enforce adherence to governance requirements, especially when tracking the movement of sensitive information.
Dataplex data lineage provides APIs for extensibility so that organizations can report lineage from various systems and have a single map of how data entries are related.
What our customers are saying
L’Oréal, the world’s largest cosmetics company, is on a mission to ‘create the beauty that moves the world.’ “Dataplex data lineage helps us understand how data moves across our organization,” said Sébastien Morand, Head of Data Engineering team, L’Oréal. “As a fully managed solution, it becomes the main entry point to diagnose data issues and evaluate the impact of a change or incident — providing insight on what happened and when it happened, including reference to the execution metadata. Directly integrated into our beauty tech data platform, data lineage helps us reduce data issues and also enables us to mitigate issues faster when it does happen.”
“At Wayfair, we treat data-as-a-product and are building a robust data platform that provides self-service access and compliance constructs,” said Vinit Rajopadhye, Associate Director on Data Infrastructure & Data Enablement at Wayfair. “We are excited about Dataplex data lineage as it helps our data consumers trust data based on where it originates and the transformations applied.”
Hurb is an online travel agency in Brazil with a mission to optimize travel through technology. “Hurb has a rapidly growing data platform, with new data assets created and registered daily to support business decision-making and Machine Learning models,” said Vinícius dos Santos Mello, Senior Data Engineer. “Thanks to Dataplex data lineage features, we have end-to-end data observability across data in BigQuery. We can proactively address schema changes, data quality issues, and asset depreciation that could otherwise negatively affect the business.”
“As a company with many business domains and services, we handle a large volume of data and use it to power our decision making, so it is crucial to ensure data quality. Dataplex data lineage provides a visual understanding of the flow of data across our organization, improving efficiency of impact investigations when problems occur and increasing the reliability of the data.” said Mitsunori Fukase, Data Platform Department Group Manager, DeNA.
Get started with Dataplex data lineage
You can get started with Dataplex data lineage by enabling the Data Lineage API on your project. You can learn more here.
Additional Resources:
The Divercity Story: Using Google Cloud to Achieve a More Inclusive and Sustainable Workforce

4742
Of your peers have already read this article.
2:30 Minutes
The most insightful time you'll spend today!
Despite a growing number of diversity, equity, and inclusion (DEI) initiatives, Black and Latinx people remain highly underrepresented in tech. Although comprising 12.6% and 18% of the U.S. labor force respectively, Black professionals hold only 5% of tech positions, while Latinx professionals fill just 6% of tech roles.
Long-standing biases in hiring practices and non-inclusive work environments are the primary contributors to this lack of diversity. Even when underrepresented professionals are successfully recruited, invisible barriers to promotion and layoffs that disproportionally impact Black and Latinx employees make it extremely challenging for tech firms to retain top talent.
We founded Divercity to help employers build diverse workforces that are more inclusive and sustainable. With our comprehensive recruiting and retention platform, tech companies can accurately measure employee diversity and gender parity, seamlessly connect with underrepresented talent, and significantly reduce turnover.
As Divercity continues to grow, we’ll introduce new services and solutions that empower the tech world to build inclusive companies while improving compliance with state and federal equal opportunity laws. We also hope to expand the reach of Divercity to support DEI initiatives in non-tech industries and bolster recruiting underrepresented professionals in other countries as well.

Scaling Divercity with the help of the Google for Startups Black Founders Fund
Shortly after founding Divercity, we participated in the 2021 Techstars Workforce Development Accelerator. The incredible support and guidance we received during and after the program highlighted the importance of long-term collaboration with reliable technology partners who actively champion diversity and inclusion.
That’s why we became part of the Google for Startups Cloud Program. After completing the program, we used Google Cloud credits and Google for Startups Black Founders Fund funding to cost-effectively trial, deploy, and scale key Google Cloud solutions. In just months, we rolled out new inclusion tracking and recruiting tools on the highly secure-by-design infrastructure of Google Cloud to expedite the sourcing and hiring of underrepresented talent in the tech industry.
With the support and mentorship of the Google for Startups Cloud Program and the Black Founders Fund, Divercity is well on its way to becoming one of the industry’s most trusted sites for DEI measurement, recruitment, and retention.
Delivering predictive diversity analyses with a 99% accuracy rate
We rely on the expansive Google Cloud ecosystem to power all the services offered on the Divercity platform. Specifically, we leverage Colab to write and execute the sophisticated TensorFlow machine learning (ML) models that deliver our predictive diversity analyses with a 99% accuracy rate.
We also use BigQuery to democratize insights and run analytics at scale with 27% lower three-year TCO than cloud data warehouse alternatives. BigQuery seamlessly integrates with Looker and Data Studio to display company diversity and recruitment data on interactive dashboards—and automatically populate reports with detailed demographic information.
We also accelerate the development, launch, and management of new Divercity tools with Firebase, while taking advantage of key features such as A/B testing and messaging campaigns to boost user engagement.
In the future, we plan to explore how Google Cloud AI and machine learning products such as Vertex AI and AutoML can further refine our diversity score analyses and applicant recruiting pipeline. We’ll also continue leveraging the many resources provided by the Google Black Founders Fund, including opportunities for technical project partnerships, early access to new Google Cloud products and tools, and collaboration with dedicated Google experts.
The Google for Startups Cloud Program and Google Black Founders Fund have been invaluable to our success. Since completing the Black Founders Accelerator program, we’ve been named a top 10 HR tech product by HR Tech Outlook, significantly increased our subscriber base, and received positive feedback from investors. We can’t wait to see what we accomplish next as we empower tech companies to build more diverse, inclusive, and sustainable workforces.

If you want to learn more about how Google Cloud can help your startup, visit our page here to get more information about our program, and sign up for our communications to get a look at our community activities, digital events, special offers, and more.
How We Built a Brand New Bank on Google Cloud and Cloud Spanner: The First Scalable, Enterprise-grade, Database Service
6549
Of your peers have already read this article.
6:30 Minutes
The most insightful time you'll spend today!
Editor’s note: Technology today lets companies of any size take on entire industries simply with an innovative business model plus digital distribution. Take Shine, a French startup whose platform helps freelancers manage their finances — and their administrative commitments. Here, Raphael Simon, Shine’s CTO and co-founder, talks about why Shine built a new bank on Google Cloud Platform, and in particular Cloud Spanner.
More and more people are deciding to take the plunge and start a freelance career. Some of them by choice, others out of necessity. One of their biggest pain points is dealing with administrative tasks.
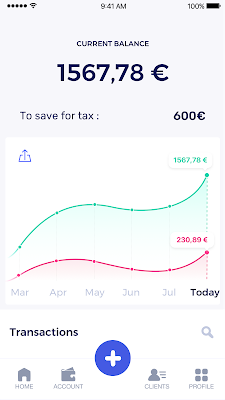
In some countries, especially in Europe, the administrative burden of being a freelancer is similar to what a company of 10 or more people deals with. A freelancer doesn’t necessarily have the time or skills to manage all this paperwork. So we are building a new bank for freelancers from the ground up that helps automate administrative tasks associated with their business.
Shine’s banking services and financial tools make it as easy to work as a freelancer as it is to work for a larger company. We deal with administrative tasks on behalf of the freelancer so that he or she can focus on their job: finding and wowing clients.

Building our infrastructure
As a new bank, we had the opportunity to build our infrastructure from the ground up. Designing an infrastructure and choosing a database presents tough decisions, especially in the financial services world. Financial institutions come under tremendous scrutiny to demonstrate stability and security. Even a tiny leak of banking data can have tremendous consequences both for the bank and its clients, and any service interruption can trigger a banking license to be suspended or a transaction to be declined.
At the same time, it’s vital for us to optimize our resources so we can maximize the time we spend developing user-facing features. In our first six months, we iterated and validated a prototype app using Firebase, and secured our seed funding round (one of the largest in Europe in 2017).
Based on our positive experience with Firebase, plus the ease-of-use and attractive pricing that Google Cloud offered, we decided to build our platform on Google Cloud Platform (GCP).
We were drawn to GCP because it has a simple, consistent interface that is easy to learn. We chose App Engine flexible environment with Google Cloud Endpoints for an auto-scaling microservices API. These helped us reduce the time, effort, and cost in terms of DevOps engineers, so we could invest more in developing features, while maintaining our agility.
We use Cloud Identity and Access Management (Cloud IAM) to help control developer access to critical parts of the application such as customer bank account data. It was quite a relief to lean on a reliable partner like Google Cloud for this.
Database decisions
Next came time to choose a database. Shine lives at the financial heart of our customers’ businesses and provides guidance on things like accounting and tax declaration. The app calculates the VAT for each invoice and forecasts the charges they must pay each quarter.
Due to the sensitivity of our customers’ data, the stakes are high. We pay careful attention to data integrity and availability and only a relational database with support for ACID transactions (Atomicity, Consistency, Isolation, Durability) can meet this requirement.
At the same time, we wanted to focus on the app and user experience, not on database administration or scalability issues. We’re trying to build the best possible product for our users, and administering a database has no direct value for our customers. In other words, we wanted a managed service.
Cloud Spanner combines a globally distributed relational database service with ACID transactions, industry-standard SQL semantics, horizontal scaling, and high availability. Cloud Spanner provided additional security, high-availability, and disaster recovery features out-of-the-box that would have taken months for us to implement on our own. Oh, and no need to worry about performance — Cloud Spanner is fast. Indeed, Cloud Spanner has been a real asset to the project, from the ease-of-use of creating an instance to scaling the database.
Cloud Spanner pro tips
We began working with Cloud Spanner and have learned a lot along the way. Here are some technical notes about our deployment and some best practices that may be useful to you down the road:
- Cloud Spanner allows us to change a schema in production without downtime. We always use a NOT NULL constraint, because we generally think that using NULL leads to more errors in application code. We always use a default value when we create an entity through our APIs and we use Cloud Dataflow to set values when we change a schema (e.g., adding a field to an entity).
- With microservices, it’s generally a good practice to make sure every service has its own database to ensure data isolation between the different services. However, we adopted a slightly different strategy to optimize our use of Cloud Spanner. We have an instance on which there are three databases — one for production, one for staging and one for testing our continuous integration (CI) pipeline. Each service has one or more interleaved tables that are isolated from others services’ tables (we do not use foreign-keys between tables from different services). This way our microservices data are not tightly “coupled”.
- We created an internal query service that performs read-only queries to Cloud Spanner to generate a dashboard or do complex queries for analytics. It is the only service where we allow joins between tables across services.
- We take advantage of Cloud Spanner’s scalability, and thus don’t delete any data that could one day be useful and/or profitable.
- We store all of our business logs on Cloud Spanner, for example connection attempts to the application. We append the ‘-Logs’ suffix to them.
- When possible, we always create an interleave.
In short, implementing Cloud Spanner has been a good choice for Shine:
- It’s saved us weeks, if not months, of coding.
- We feel we can rely on it since it’s been battle-tested by Google.
- We can focus on building a disruptive financial services product for freelancers and SMBs.
And because Cloud Spanner is fully managed and horizontally scalable, we don’t have to worry about hardware, security patches, scaling, database sharding, or the possibility of a long and risky database migration in the future. We are confident Cloud Spanner will grow with our business, particularly as we expand regionally and globally. I strongly recommend Cloud Spanner to any company looking for a complete database solution for business-critical, sensitive, and scalable data.
Data to Business Outcomes with Google’s Data Analytics Design Pattern

6728
Of your peers have already read this article.
1:30 Minutes
The most insightful time you'll spend today!
Companies today are inundated with vast amounts of data from various sources. This overwhelming amount of data is meant to benefit the company, but often leaves data teams feeling overwhelmed, which can create data bottlenecks and result in a slow time to value. In fact, only twenty seven percent of companies agree that data and analytics projects produce insights and recommendations that are highly actionable (Accenture). This means that nearly 3 in 4 companies are not unlocking value in their data, which poses a huge challenge for organizations trying to move the needle and drive real business results. We at Google Cloud, however, saw opportunity in this challenge, which is why we created Data Analytics Design Patterns: cross-product technical solutions designed to accelerate a customer’s path to value realization with their data. These industry solutions bring together product capabilities alongside design methodology, open source deployable code, data models, and reference architectures to accelerate your business outcomes.

With Data Analytics Design Patterns, you get access to more than 30 ready-to-deploy data analytics solutions. Design patterns leverage the best of Google and our rich partner ecosystem, including Technology Partners & System Integrators. In this blog, we will cover 3 examples on how a design pattern can be applied to unlock the value of data:
- Improve mobile app experience with Unified App Analytics
- Maximize digital shop’s revenue with Price Optimization
- Protect internal systems from security and malware threat with Anomaly Detection
Unified App Analytics
If mobile apps are part of your go-to-market strategy, you have several data sources that can provide invaluable customer insights. In addition to tools such as CRM (e.g. Salesforce) and customer care (e.g. Zendesk), you likely use Google Analytics to log app events and Firebase Crashlytics to gather data about app errors. But can you easily combine back-end server data with app front-end data to unlock customer insights?
The Unified App Analytics design pattern makes it easy to plug all the disparate data sources into a single warehouse (BigQuery) and start analyzing it with a Business Intelligence tool (Looker). Once you have a complete and real time view of your customer experience with your app, you can take action. For example, if you notice an increase in app errors, you can quickly combine your Crashlytics data with your CRM data to narrow down the crashes with the highest revenue impact and prioritize their resolution. Further, you can automate your issue resolution workflow by creating a rule for any future crash that impacts a subset of VIP customers.

With the Unified App Analytics design pattern, you’ll gain access to valuable insights about your user experience with your app so you can inform your future app strategy. For example, NPR, an American media company, increased user engagement by showing content that better mapped to listener interests and behaviors.
Price Optimization
In a competitive and hectic global marketplace, strategic pricing matters more than ever, but often projects are consumed by the tedium of standardizing, cleaning, and preparing data—from transactions, inventory, demand, among other sources.
Price Optimization solution allows retailers to build a data driven pricing model. The solution consists of three main components:
- Dataprep by Trifacta: integrates different data sources into a single Common Data Model (CDM). Dataprep is an intelligent data service for visually exploring, cleaning, and preparing structured and unstructured data for analysis, reporting, and machine learning.
- BigQuery: allows you to create and store pricing models in a consistent and scalable way as a serverless Cloud Data Warehouse service
- Looker dashboards: surface insights and enable business teams to take action with enterprise ready BI platform
With the Price Optimization design pattern from Google Cloud and our partner Trifacta, you’ll be able to rapidly unify multiple data sources and create a real-time and ML-powered analysis, leveraging predictive models to estimate future sales. For example, PDPAOLA, an online jewelry company, doubled sales with dynamic pricing adjustments enabled by a single data view.

Anomaly Detection
Organizations need to anticipate and act on risks and opportunities to stay competitive in a digitally transforming society. Anomaly detection helps organizations identify and respond to data points and data trends in high velocity, high volume data sets that deviate from historical standards and expected behaviors, allowing them to take action on changing user needs, mitigate malicious actors and behaviors, and prevent unnecessary costs and monetary losses.
The Anomaly Detection design pattern uses Google Pub/Sub, BigQuery, Dataflow, and Looker to:
- Stream events in real time
- Process the events, extract useful data points, train the detection algorithm of choice
- Apply the detection algorithm in near-real time to the events to detect anomalies
- Update dashboards and/or send alerts
The challenge of finding the important insights and anomalies in vast amounts of data applies to organizations across all industries and lines of business, but is especially important to protecting the security of an organization. For example, TELUS, a national communications company, modernized their security analytics platform leveraging this pattern, allowing them to detect anomalies in near real time to detect and mitigate suspicious activity.
Get started
Turn your data into business outcomes with Google Cloud and our broad partner ecosystem by deploying Data Analytics Design Patterns at your organization. There are more than 30 Data Analytics Design Patterns ready for you to use. We have more than 200+ more ideas in the pipeline, so be sure to check in regularly as new patterns will be added soon.
To dive deeper and find out more about how Data Analytics Design Patterns can help your organization accelerate use cases and create faster time to value, check out this video.
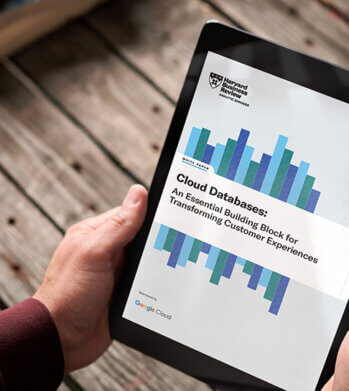
Cloud Databases: An Essential Building Block for Transforming Customer Experiences
DOWNLOAD RESEARCH REPORTS2757
Of your peers have already downloaded this article
11:30 Minutes
The most insightful time you'll spend today!
Around the globe, companies realize that iterating and innovating the customer experience (CX) is the key to their business transformation and success goals. Customers expect exceptional and speedy service from organizations through personalized experiences and easy-to-use apps.
However, while most companies want data-driven innovation, many of them overlook a key mechanism to do so: operational databases. These databases run a company’s day-to-day operations and power applications around the globe.
“Operational databases are often overlooked because they are behind the scenes,” says Kumar Menon, senior vice president of data fabric and decision science technology at Atlanta-based Equifax, the multinational consumer credit reporting agency. “Companies often focus on providing strong customer-facing applications, but the application will only achieve the desired results with a well-architected operational data capability that helps drive the real-time analytics needed to make the customer experience effective and memorable. It is the backbone of anything that you will build on top of it.”
Better customer experience is a business outcome of using cloud databases to build applications. This dictum stands to reason because moving from a traditional on-premises database to a modern database in the cloud, or simply building new applications in the cloud, allows companies to address operational overhead, unlock new possibilities, implement new features quickly, increase application reliability, and serve users across more regions—all the things that enhance CX and make it possible. Google Cloud sponsored this research by Harvard Business Review Analytic Services to understand how digital innovators are delighting their customers by using modern cloud databases. The report analyzes why operational databases are an essential building block for transformative experiences and highlights some of the critical capabilities leaders should prioritize. Through interviews with technology executives, data leaders, and industry experts, it provides real-world examples of benefits companies are realizing with cloud databases. We hope you find the findings and real-world examples in this report insightful and inspiring.
More Relevant Stories for Your Company


Indian Retailer Figures Optimizes Hyperlocal Delivery to Increase Customer Experience
Anyone who follows the Indian e-commerce scene knows that one of the largest challenges these companies face is hyperlocal delivery. That was a problem facing Wellness Forever, a retail chain of pharmacies with 150-plus stores across India. “Exactly a year ago, we started our journey of hyperlocal deliveries. This optimization

Tyson Foods’ Story of Unlocking Opportunities by Integrating Real-time Analytics with AI and BI
As data environments become more complex, companies are turning to streaming analytics solutions that analyze data as it’s ingested and deliver immediate, high-value insights into what is happening now. These insights enable decision makers to act in real time to take advantage of opportunities or respond to issues as they

How BigQuery’s Unique Features Support Your Data at Petabyte-scale
Organizations rely on data warehouses to aggregate data from disparate sources, process it, and make it available for data analysis in support of strategic decision-making. BigQuery is the Google Cloud enterprise data warehouse designed to help organizations to run large scale analytics with ease and quickly unlock actionable insights. You

Groww’s Google Cloud-Powered Platform: The Key to Secure and Successful Investing
Groww makes investments simple and accessible, using Google Kubernetes Engine to ensure a reliable platform for customers, and makes data-backed decisions to grow its business with BigQuery. Google Cloud results Reduces hardware costs with Preemptable Virtual Machines Enables a lean DevOps team with Google Cloud Analyzes data effectively and quickly
