





Manhattan Associates and Google Cloud: How the Partnership Accelerates Future of Digital Retail

4959
Of your peers have already read this article.
1:30 Minutes
The most insightful time you'll spend today!
While the shift to digital business and the cloud has been well under way for some years now, organizations today have a new sense of urgency due to COVID-19. Delivering digital transformation is no longer a ‘nice to have’ option, rather, it is an operational imperative. Taking advantage of the infrastructure, platform and solution gains that cloud and microservices architecture provide is a must for brands today.
At Google Cloud, we understand the pressures and challenges organizations of all sizes, across all industries are facing. The pandemic has dramatically impacted global commerce at-large, exposing (for many organizations across multiple sectors) gaps in omnichannel capabilities, business continuity and forecasting plans, not to mention spots in supply chain agility, resilience and responsiveness.
A rapidly evolving consumer-driven commerce landscape has put innovation squarely in the spotlight for supply chain teams all over the world, with the effects of the global pandemic making it increasingly difficult for manufacturers, wholesalers, third party logistics providers and retailers (in particular) to weather the perfect storm of fast-moving consumer trends and a need for ‘always on’ digital innovation.
These same effects have driven increasing interest and uptake of technology like the Manhattan Active® suite of solutions, as well as our own cloud platform; both of which afford organizations the levels of agility, flexibility and scalability needed to insulate their people, processes and long-term business strategies against unforeseen future obstacles such as global pandemics or international trade disputes.
An excellent example of this agility, flexibility and scalability in action is PVH’s response to the global pandemic. One of the most admired fashion and lifestyle companies with such iconic brands as Calvin Klein, TOMMY HILFIGER, Van Heusen, and IZOD, PVH was forced to temporarily close its physical stores and, as a result, experienced a sudden massive increase in online sales. The retailer was able to quickly pivot by adjusting its business rules in Manhattan Distributed Order Management (part of Manhattan Active Omni) to expose store inventory to online consumers and reroute its fulfillment processes. Thanks to Manhattan’s solution delivered through Google Cloud, in a matter of days, PVH was able to leverage both its distribution centers and vast store network to fulfill its online orders.
“The events of 2020 have accelerated retail and ecommerce operations forward,” said David Herridge, executive vice president of Global Value Chain Technologies for PVH. “With quick, creative thinking and the right partner, we were able to pivot operations, satisfy our customers and prepare for the future.”
Manhattan’s products have been recognized for their ability to solve real-world challenges through innovation, and used by many of the world’s top brands to solve some of their most complex commerce and supply chain challenges: the latest recognition is Manhattan’s position as sole leader in the 2021 Forrester Wave™ for Order Management Solutions.
Since December 2018, Google Cloud has been collaborating closely with the team at Manhattan and its ‘always on’, versionless approach to innovation. And, during the last two and a half years, Manhattan has significantly accelerated its cloud-first solutions and market adoption, resulting in tremendous growth in its overall cloud business efforts.
By building cloud native solutions on Google Cloud, the teams at Manhattan continue to deliver the high-performance, elastic, high-redundancy, secure solutions their customers rely on. Moreover, it means both Google Cloud and Manhattan continue to innovate and push the boundaries of what is possible in terms of the supply chain and omnichannel innovations that underpin global commerce – innovation that is needed more now than maybe ever before.
Our commitment to distributed cloud solutions and ongoing innovation, not to mention the fact Google Cloud operates a net carbon-neutral cloud, means that the working partnership between both industry leading teams continues to be a perfect match of brand values; not just from a technology perspective, but also a long-term sustainability and environmental one too.
More information on the partnership can be found here.
5361
Of your peers have already watched this video.
44:30 Minutes
The most insightful time you'll spend today!
How Go-Jek, Indonesia’s First Billion-dollar Startup, Improved the Productivity of Data Scientists
Go-Jek, Indonesia’s first billion-dollar startup, has seen an incredible amount of growth in both users and data over the past two years. Many of the ride-hailing company’s services are backed by machine learning models hosted on Google Cloud Platform.
Models range from driver
But senior executives at Go-Jek realized something: One of their most important and expensive resources, data scientists, were spending far too much time cleaning data. That wasn’t part of their remit and resulted in a waste of time and money.
As a COO, this a major concern for any company undertaking a machine learning initiative. Data scientists are hard to come by and their salaries have been on the rise for the last few years. Yet according to some reports data scientists spend upto 80% of their time just preparing data—not creating models.
Watch how operational teams at Go-Jek combined the right Google tools and processes to improve the productivity of their data scientists.
Revolutionizing Finance: Google Cloud’s Role in Auditoria.AI’s Success

1248
Of your peers have already read this article.
4:00 Minutes
The most insightful time you'll spend today!
Be it marketing, sales, or even security, most departments in large organizations today have a range of SaaS tools at their disposal to help make their work more efficient. But people in corporate finance and accounting have been underserved in that respect. Their days are still spent on routine, mundane tasks that keep them away from more stimulating work. Auditoria.AI aims to change that by automating those functions with AI and natural language technology.
We strive to improve the lives of finance and accounting professionals by automating the routine, repetitive, and laborious parts of the finance function, such as copy-and-pasting data, validating documents, and checking for errors on spreadsheets, freeing these teams to focus instead on providing valuable, strategic insights to the business.
To that end, the problems we’re solving affect three major finance functions:
- Accounts Payable, responsible for sending money out of the company, such as bill payments.
- Accounts Receivable, responsible for bringing money into the company, such as invoicing for services.
- General accounting, a broader term consisting of functions of the general ledger team and the CFO, including closing books.
Historically, making these processes more efficient entailed dedicating more personnel to them. But this didn’t necessarily mean more work was done faster and to the highest standards. Many finance professionals are often overworked, dedicating extra hours, weekends, and sometimes holidays to process invoices, collect payments, and close the books on time.
We created solutions for these three finance functions, with our SmartBots taking care of the back-and-forth communications between finance teams, vendors, and customers. In large companies, these micro-transactions add up to thousands per day, resulting in finance professionals spending entire days reading inquiries, interpreting requests, looking for relevant information, and answering as many as possible. But with our AR helpdesk, for example, accounts receivable tasks, such as a request for a copy of an invoice, get automated. Our technology reads emails and attachments to understand what is being requested. Then it connects to the Enterprise Resource Planning (ERP) software to grab the relevant information and attach it to the email, so the recipient gets a response within 60 seconds.
Building the smart assistant that finance teams need
In our automation flow, we constantly handle different types of documents, from invoices and tax forms to receipts and email messages. But processing the interaction between computers and human language is complex. You must detect intent and facts, and understand the context before finding the specific slots of information extraction that may be relevant to specific processes and requests. Our solution adds value by extracting the right information in the right context, from the right document, for the relevant finance function. Instead of building everything from scratch, we turned to Google Cloud’s Document AI to support extracting data from unstructured documents to understand and analyze them.
Document AI comes with pre-built models that help analyze specific parts of our post-production lifecycle. For example, Invoice Parser extracts text and values from invoices, including invoice number, supplier name, invoice amount, tax amount, and invoice due date, all of which are necessary for our SmartBots to execute an extraction workflow. These out-of-the-box features significantly accelerate our own product development process and time-to-market, which are critical for the performance of a startup such as ours.
To ensure a high quality of information extraction, we used to do document readings in-house. Having automated some of that with Document AI, we’re at 85% accuracy extracting files, and with some additional customization efforts, we will achieve 95%+ extraction accuracy.
Meanwhile, we have now streamlined internal processes, which ultimately translates into faster services for our customers. For example, assuming all the information has been provided, it generally took up to 15 minutes to process a tax form. We now do that in seconds.
The value of automation doesn’t stop there. Using DocumentAI to automate structured data extraction from documents, we have managed to:
- Speed up the collection of general ledger entries by 90%+
- Reduce errors and omissions by 85%+
- Close books 20% faster
- Improved the productivity of full-time employees by 60%+
- Reduce process workload by 75%+
- Improve vendor serviceability by 75%+
- Reduce vendor risk and fraud by 50%+
Leveraging automation to focus on more innovation
Automating some of our processes with Document AI also means we have more time to focus on developing new features and further improving our solution. 80-90% of the time used for extracting custom fields from documents has now been automated with an OCR metadata library.
With Document AI taking care of standard extraction, we focus on the intelligence we add to post-extraction. For example, when an invoice comes in from a vendor, our application needs to figure out which vendor it is to match it to the correct records in the ERP. But variations in the documents could interfere with that extraction process. The vendor’s trading name might be slightly different from the company’s name registered in our internal system, delaying the process. With more time on our hands, we’re now working on features enabling our models to leverage logos and other elements extracted from documents to swiftly match them to the correct company registered in our systems.
With the benefits we’ve seen thus far, we look forward to accelerating our international growth. We’ll be relying on Google Cloud’s Document AI to automate operations, potentially in different languages, as we continually remove friction from the work lives of finance and accounting people worldwide.
Trading and Investment Companies will Increase Consumption of Cloud Services: Study Confirms

4873
Of your peers have already read this article.
3:00 Minutes
The most insightful time you'll spend today!
While some traditional financial services companies have more slowly transitioned to the cloud, capital markets firms have embraced cloud computing across their entire value chains — front-, middle-, and back-office. We wanted to understand the dynamics behind this rapid adoption, the most common use cases, and the types of technology most in use, particularly as it relates to market data. Google Cloud commissioned Coalition Greenwich to survey 102 institutional capital markets professionals — at exchanges, trading systems, data aggregators, data producers, asset managers, hedge funds, and investment banks — in the United States, Canada, France, Germany, Italy, the Netherlands, Switzerland, and the United Kingdom.
Our research found that while there are many drivers, demand for easier accessibility is fueling widespread adoption of cloud-based market data services, and associated trading infrastructures, across the buy side and sell side. In fact, 68% of sell-side and buy-side users find it critical for market data providers to offer public cloud-based data services. At the same time, exchanges, market data providers, aggregators, and trading systems are embracing the cloud as a delivery model by offering access to data directly via their own cloud services, APIs or partners.
Here were five noteworthy takeaways from the study:
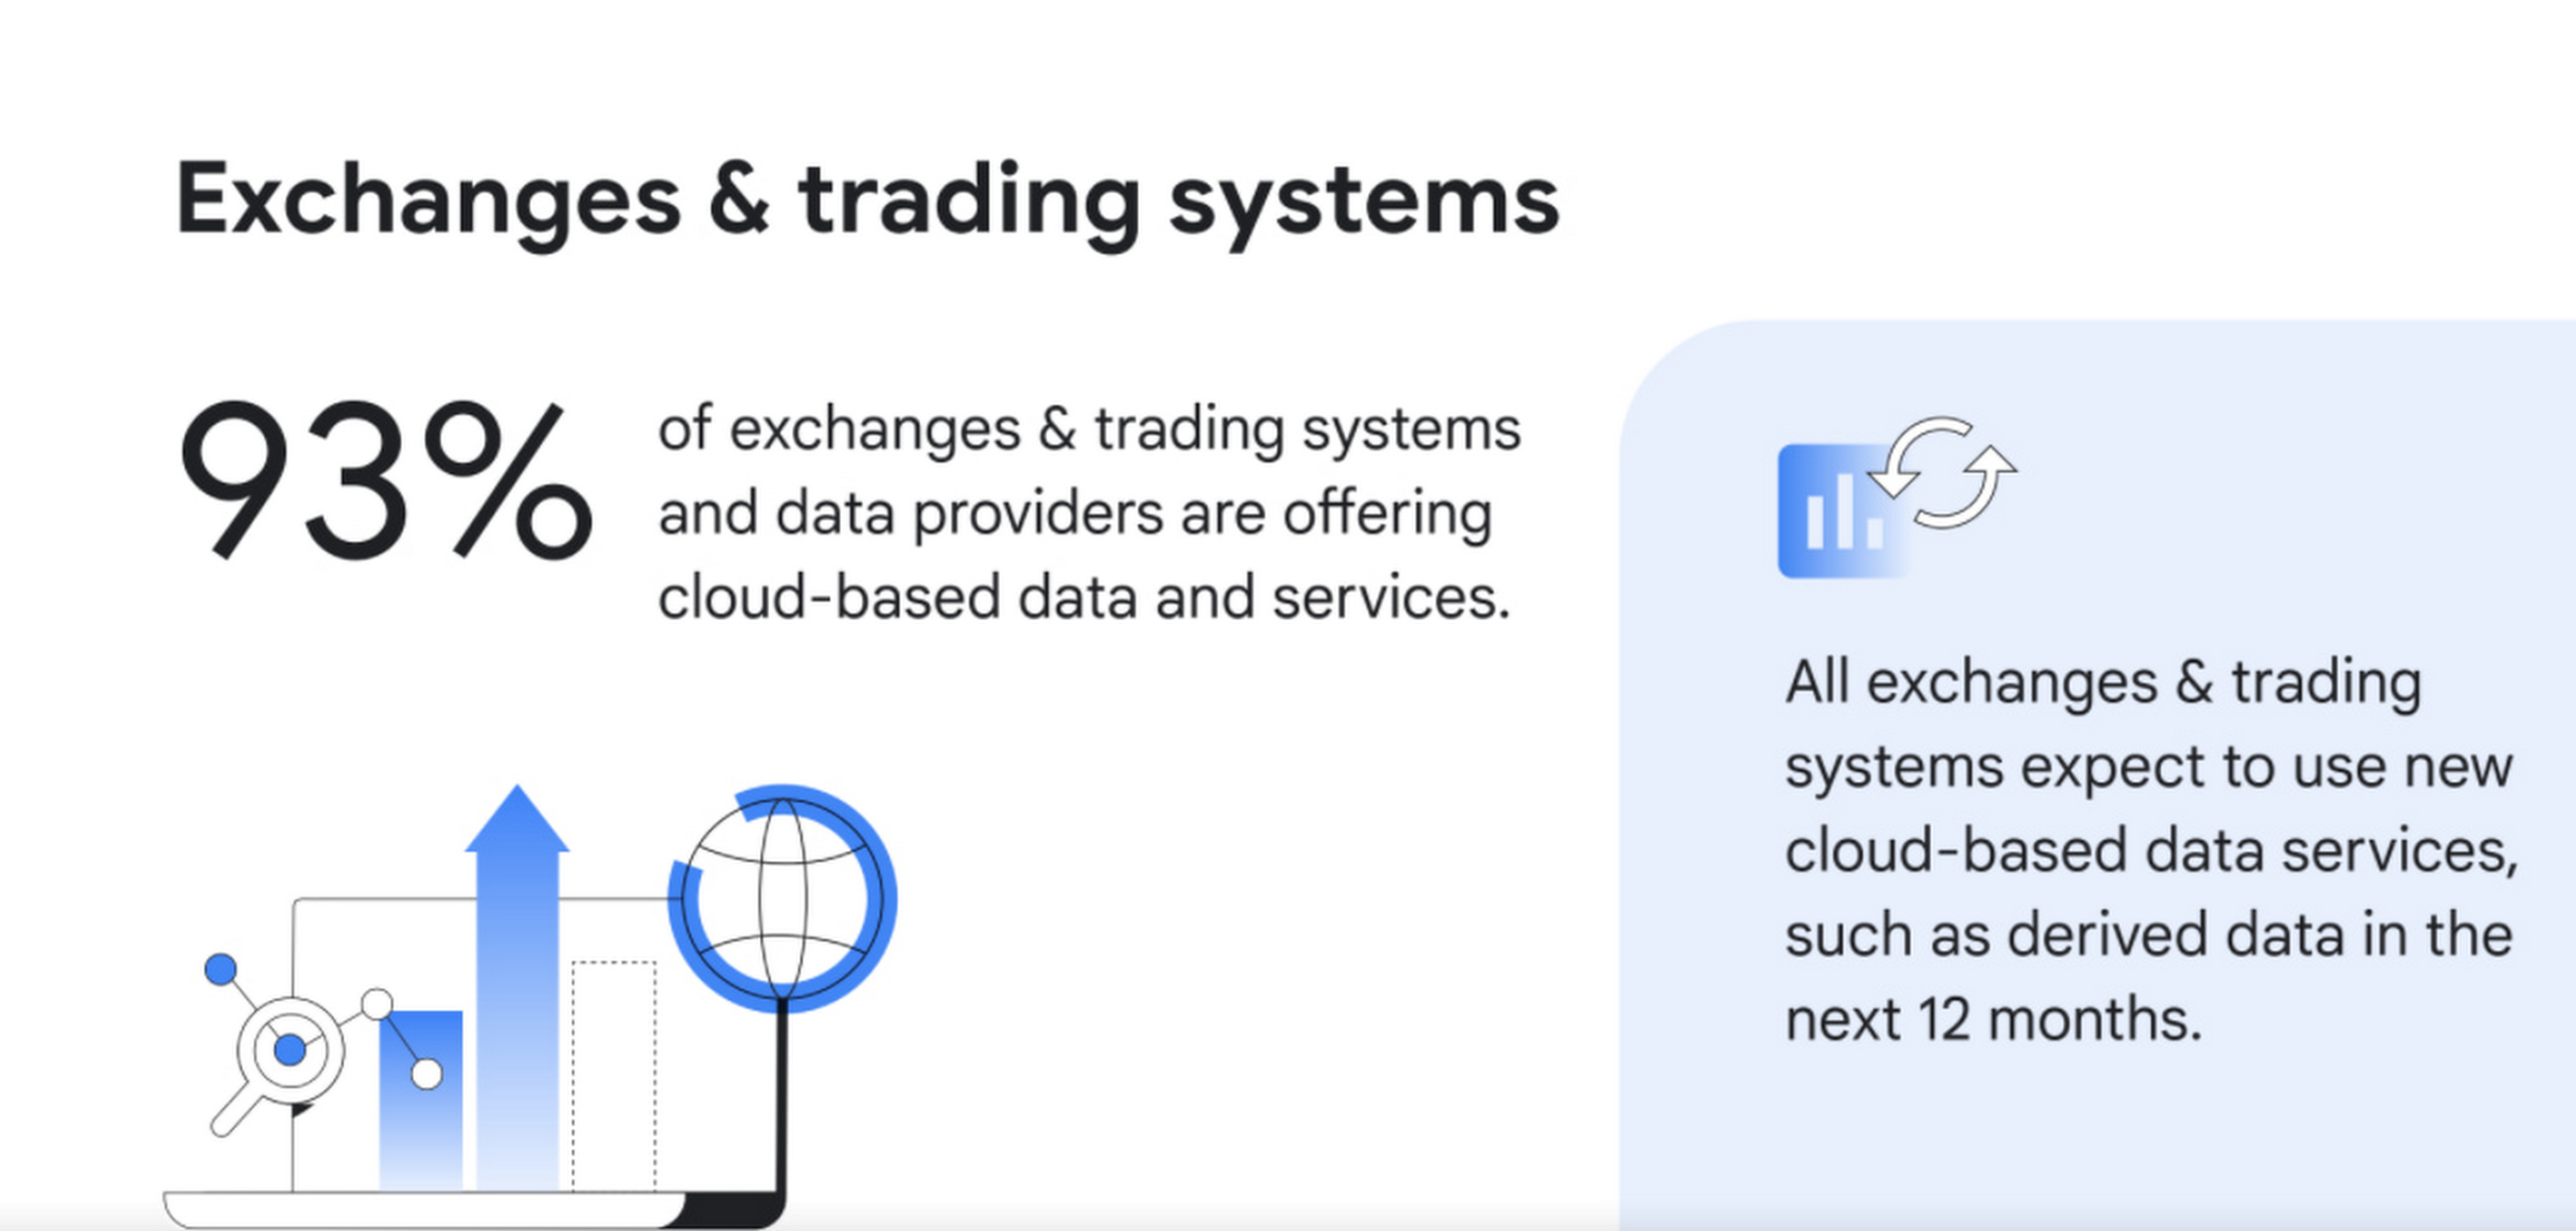
1. Cloud services are becoming ubiquitous for data delivery. Today, the cloud is pervasive, with 93% of exchanges, trading systems and data providers offering cloud-based data and services, according to surveyed executives. Moreover, 100% of those surveyed intend to offer new cloud-based services, such as derived data, in the next 12 months.
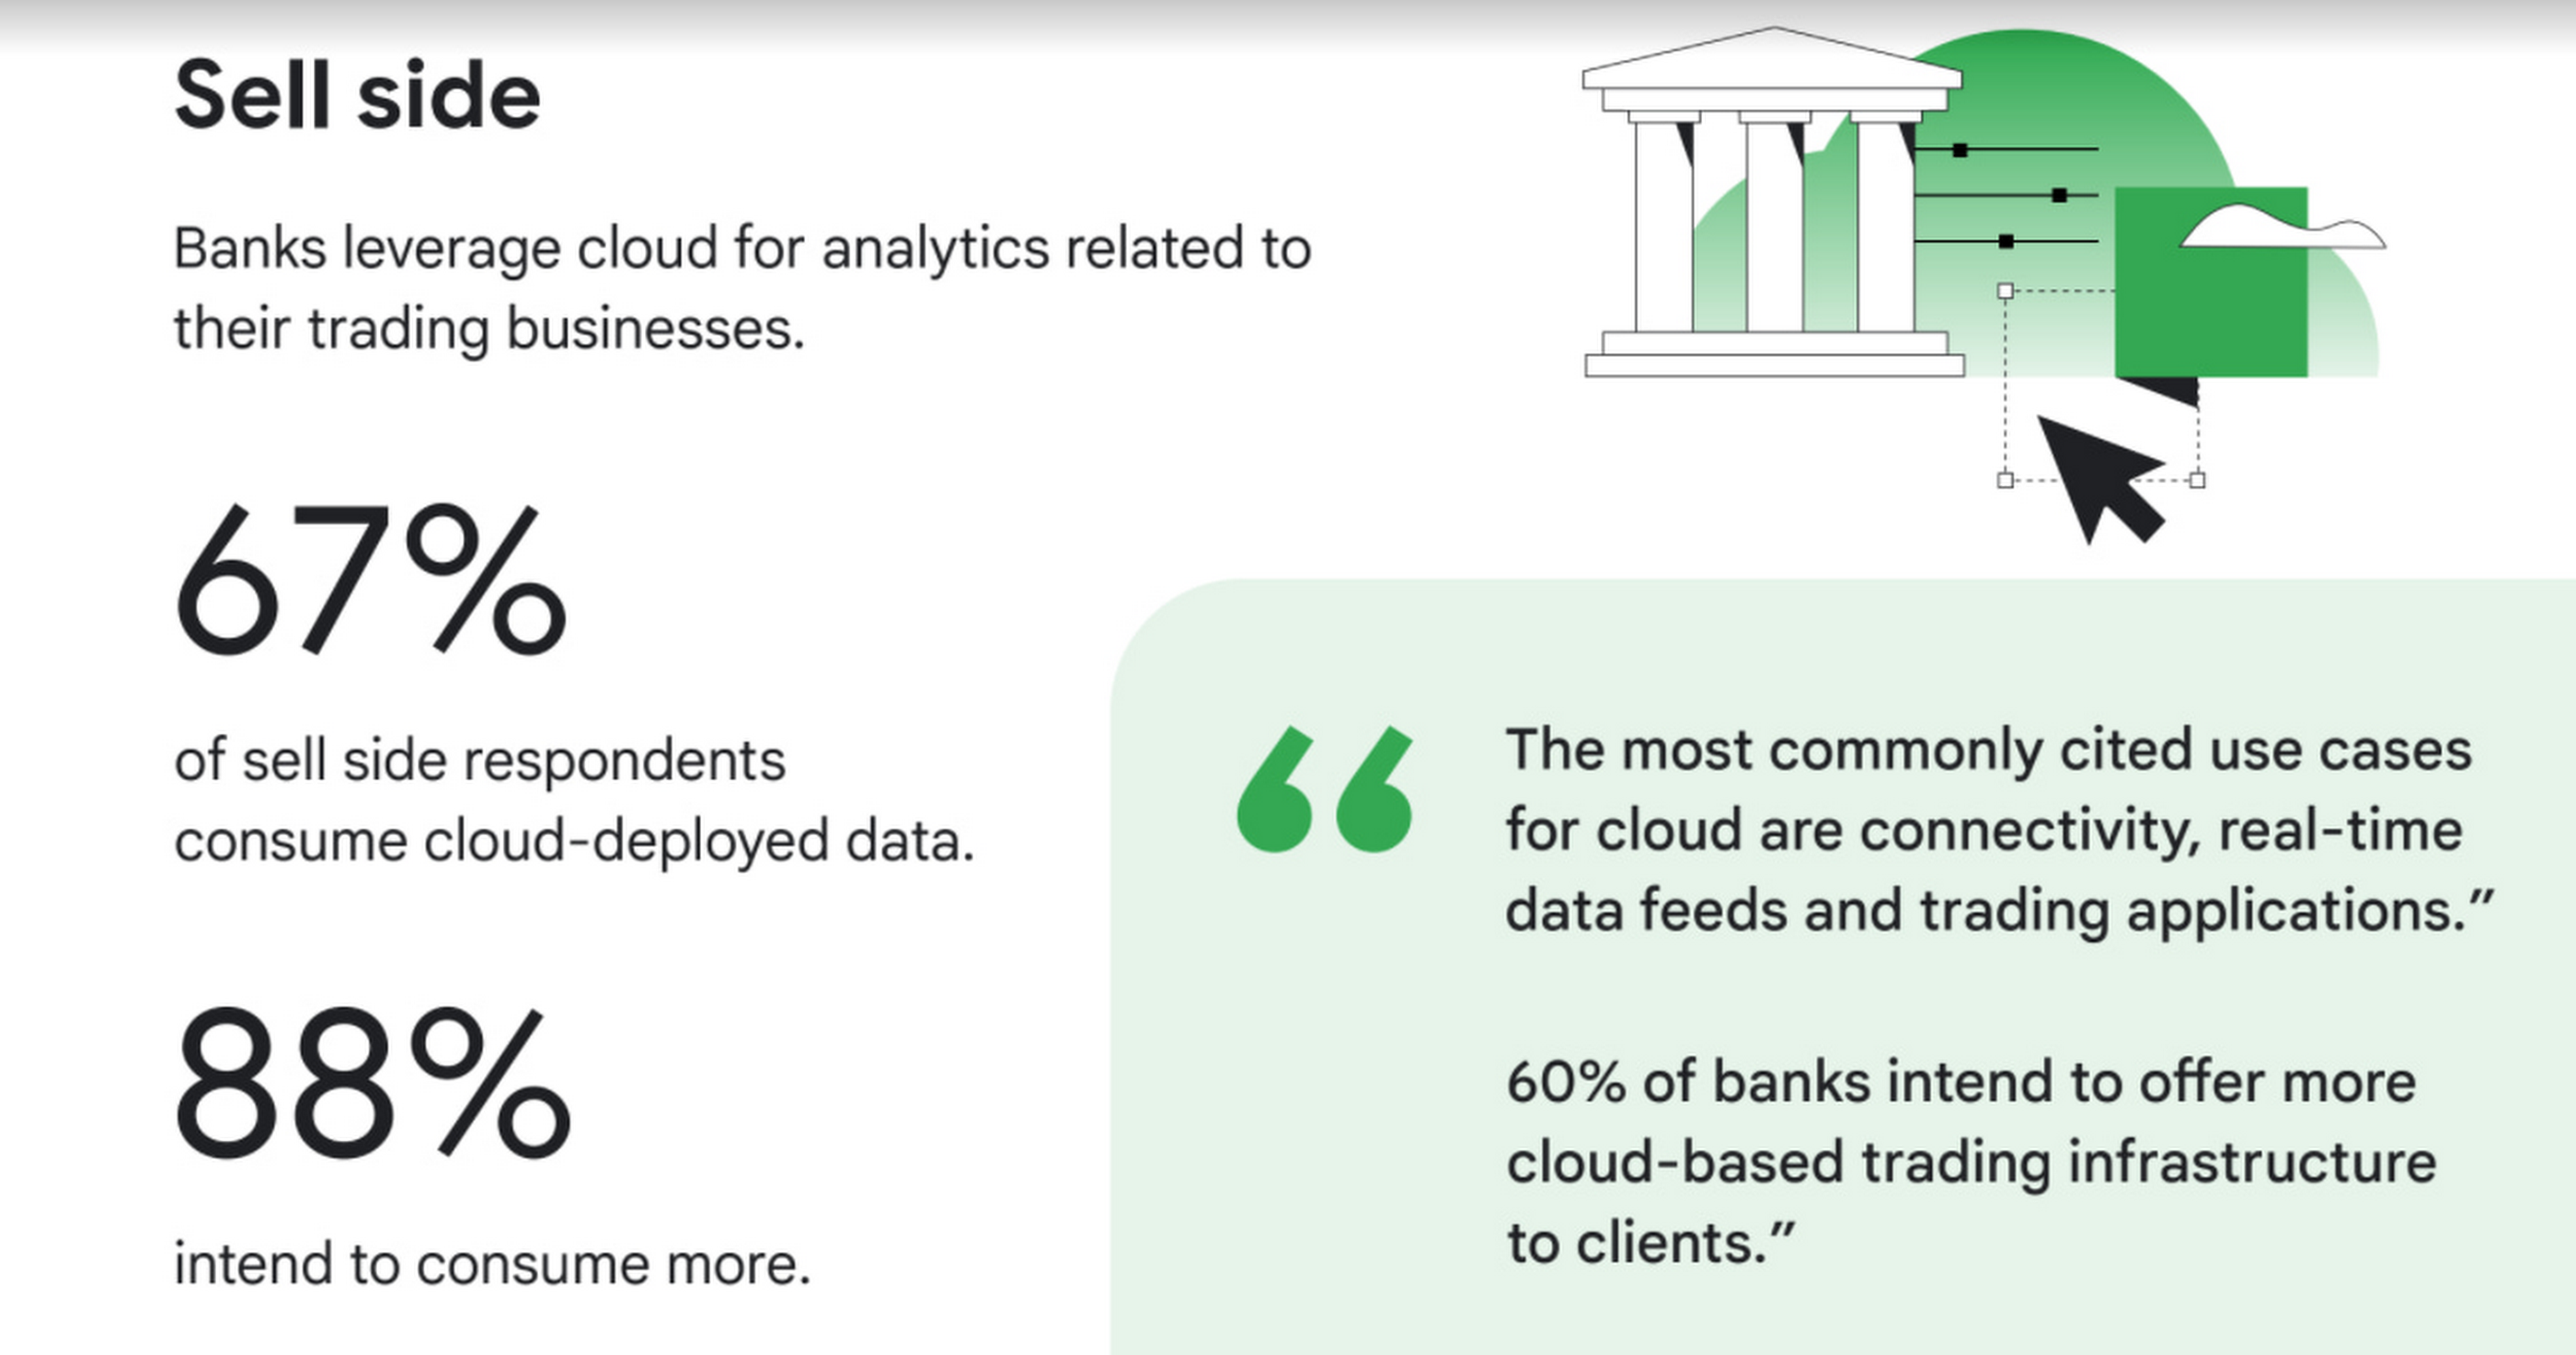
2. Commercial and investment banks are offering additional connectivity, real-time data feeds, and trading applications delivered via the cloud,demonstrating that it’s not only exchanges, trading systems, and data providers that are moving rapidly to the cloud. Internal use cases abound as well, with 67% of those surveyed consuming cloud-deployed market data, primarily for data analytics. 88% of surveyed sell-side firms intend to consume cloud-based market data services, with digital transformation, data science and quant research as the top use cases.
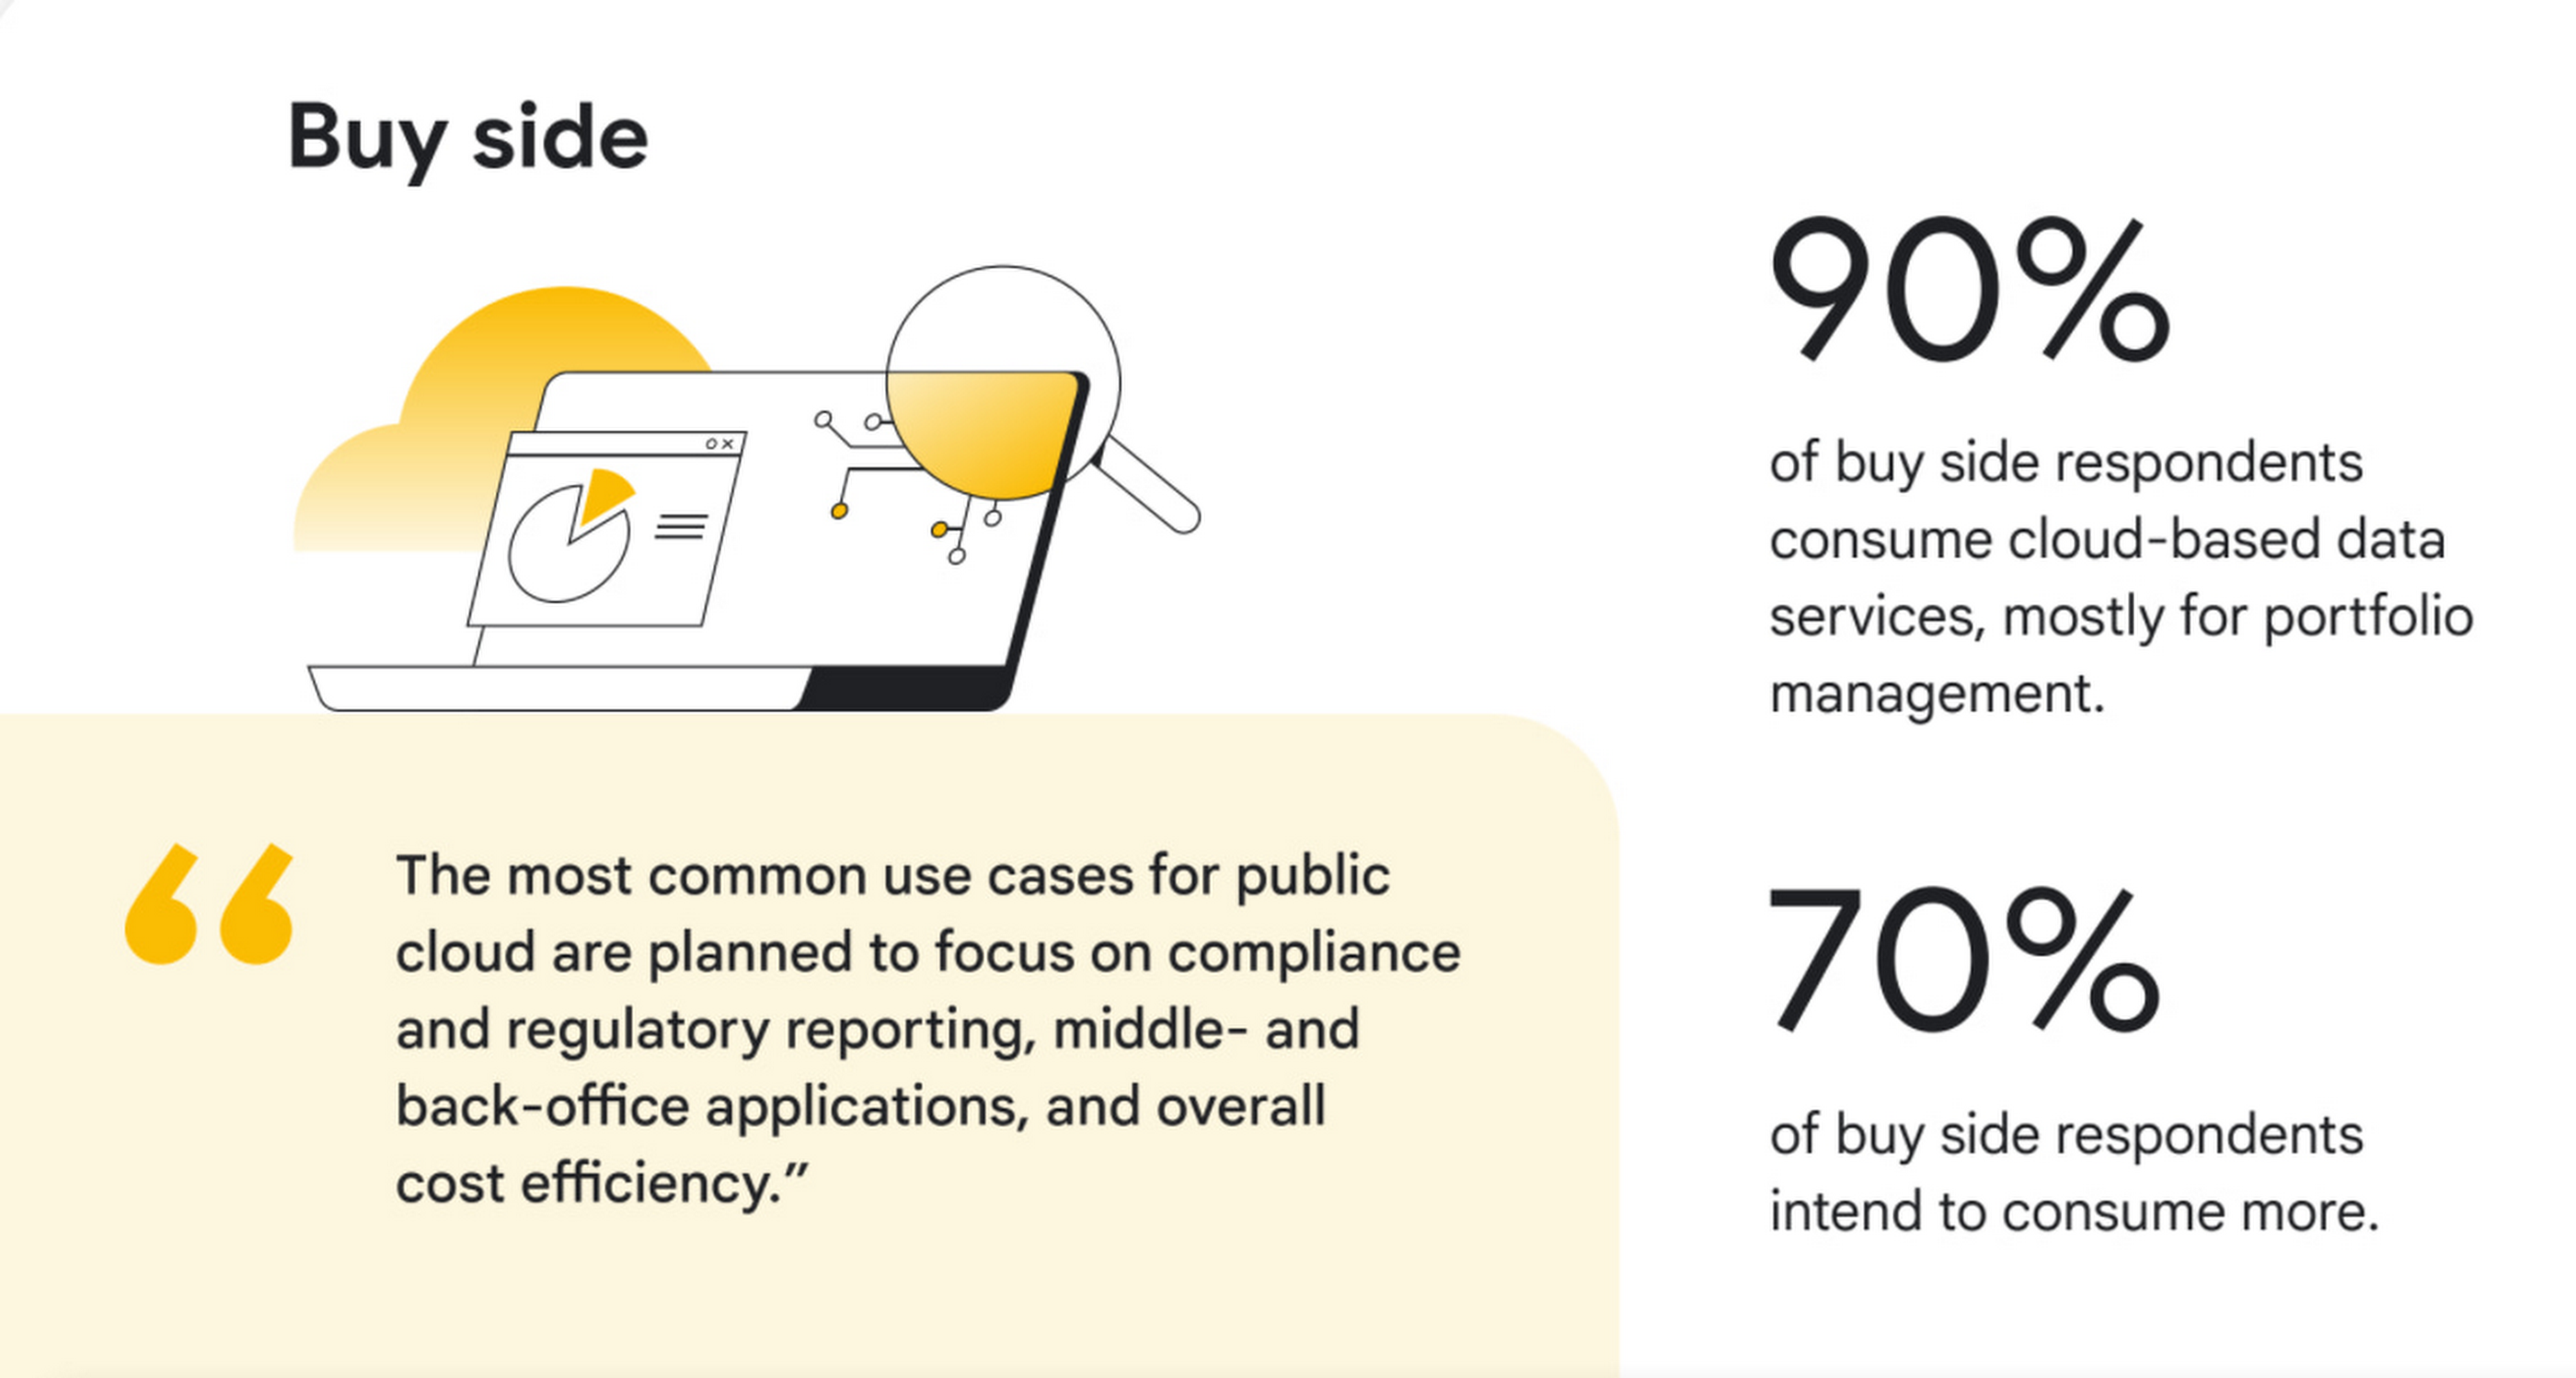
3. Buy side firms will consume even more cloud-deployed data. Today, 90% of surveyed buy-side firms are consuming cloud-deployed market data, mostly for portfolio management. 70% of buy-side firms intend to consume more public cloud-based market data services in the next 12 months, adding services such as compliance and regulatory reporting.
4. AI/ML, powered by cloud, is moving out of the pilot phase and into mainstream use. Today, 50% of exchanges, trading systems, and data providers are offering data products or services powered by AI/ML, and of those, 42% intend to offer AI-powered trade execution and trading analytics services in the next 12 months. Within commercial and investment banks, 55% said they are currently using AI/ML in the cloud, and while that was true for only 14% of overall buy-side respondents, 44% of large buy-side respondents are using it.

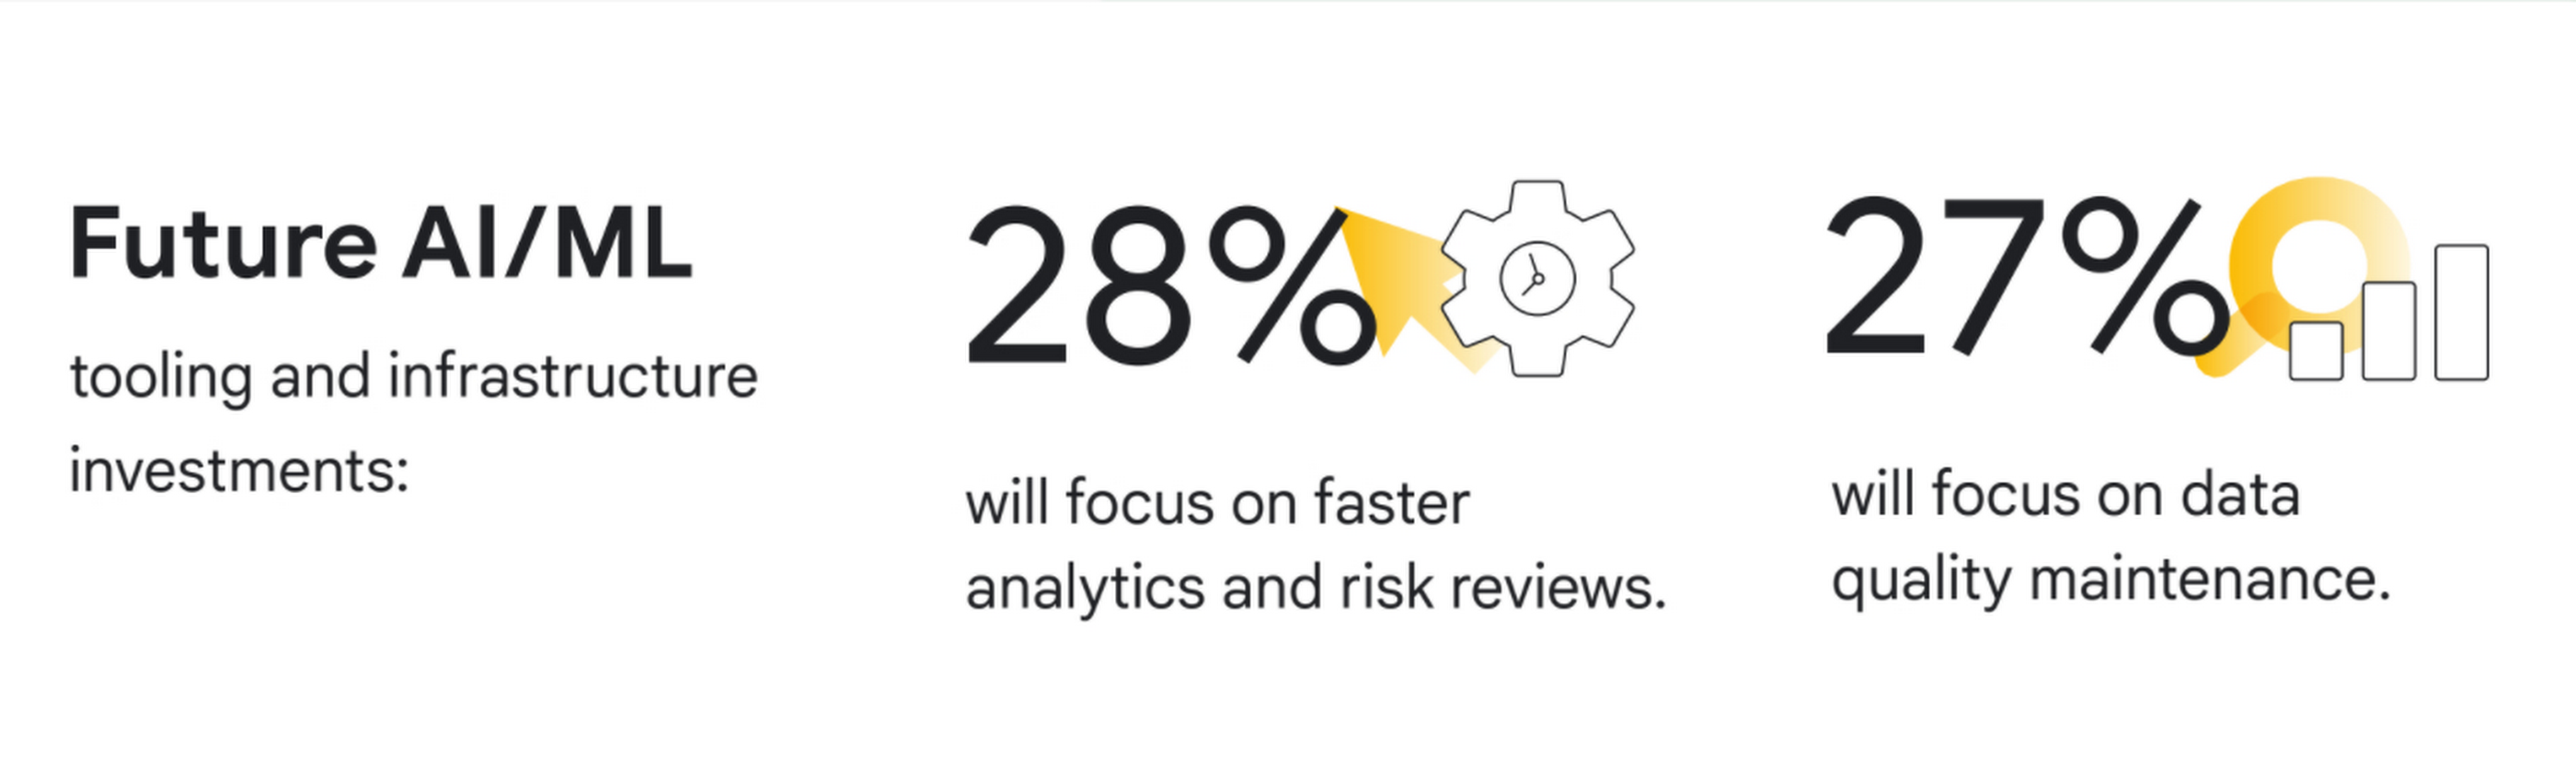
5. Exchanges, trading systems, and data providers are prioritizing public cloud for internal insights. 71% of these firms are using the public cloud, mostly for data transmission, processing, analysis, and long-term data storage. Over the next 12 months, 33% of new public cloud workloads will focus on data mining, data insights and advanced analytics, while 28% of new AI/ML tooling and infrastructure investments will focus on faster analytics and risk reviews, and 27% on data quality maintenance.
“We see new, dramatic shifts on the adoption of cloud across market data,” said David Easthope, Senior Analyst for Coalition Greenwich. “And we expect further proliferation of cloud-based services and greater consumption across the trading and investing lifecycle.”
Conclusions and future predictions
Based on the survey results, Coalition Greenwich predicts five following trends over the next 12 months:
- Exchanges and trading systems will continue to launch a wide array of new cloud-based and possibly cloud exclusive data services across derived data, end of day data, reference data and pricing data.
- Data providers will launch new data products such as pre-trade analytics powered by AI/ML in the cloud.
- Commercial and investment banks will offer additional connectivity, real-time data feeds, and trading applications delivered via the cloud.
- Buy-side firms will consume even more cloud-deployed data, including real-time market data, portfolio management data, and risk analytics.
- Exchanges, trading systems and data providers will explore proof-of-concepts around core systems on the cloud. Improvements to AI/ML tooling or infrastructure will ramp up as firms seek more rapid responses to risk initiatives.
To learn more about these findings, download our two full reports, The Future of market data: Distribution and consumption through cloud and AI and Exchanges and data providers: Prioritizing the cloud and AI for internal insights or our short infographic.
Research methodology
The survey was conducted online by Coalition Greenwich on behalf of Google Cloud from March 2021 to April 2021 among 102 executives in North America (n=82), EMEA (n=17) and other (n=3) who are employed full-time and who are participants or influencers in decisions around cloud and/or senior management with a role at a company which is an institutional asset manager, hedge fund, alternative investment manager, exchange and/or trading system, information provider, information aggregator, or other asset manager/asset owner. The survey included wide perspectives from a range of firm size and asset class focus, including equity, fixed income, FX, commodities, multi-asset, and other asset classes.
Foot Notes
1. We defined market data as direct feeds, consolidated feeds, terminal and desktop products, security and reference data, pricing data, historical data, alternative data, and index data.

3124
Of your peers have already downloaded this article
22:30 Minutes
The most insightful time you'll spend today!
Companies everywhere are seeking to leverage the power of AI. And rightly so. The smart applications of AI enable organizations to improve, to scale, and to accelerate the decision-making process across most business functions, so as to work both more efficiently and more effectively. It can also open up new avenues and new revenue streams, providing the organization with an additional competitive edge.
In short, many believe (as we do) that the enterprises that invest in building industry-specific AI solutions today are positioning themselves to be the global economic leaders of tomorrow. But the path to building an effective AI capability is not an easy one. There are many challenges to overcome. Challenges with the technology to develop platforms and solutions. With the people who will implement and manage that technology. With the data that fuels the technology. And with the processes that govern the whole of it. How do you harness the power inherent in AI, while avoiding any potential missteps?
That’s where Google Cloud comes in. Our framework for AI adoption provides a guide to technology leaders who want to build an effective AI capability, one that enables them to leverage the power of AI to enhance and streamline their business, smoothly and smartly. The framework is informed by Google’s own evolution, innovation, and leadership in AI, including experience deploying AI in production through products such as Gmail and Google Photos. It is also inspired by many years of experience helping cloud customers — from startups to enterprises, in various industries — to solve complex challenges.
With Google Cloud’s AI Adoption Framework, you’ll be able to create and evolve your own transformative AI capability. You’ll have a map for assessing where you are in the journey and where, at the end of it, you’d like to be. You’ll have a structure for building scalable AI capabilities to create better insights from big data with powerful algorithms across the entire business.
With Google Cloud as your guide, the path to AI is considerably smoother.
Download this whitepaper to find out:
- A map for assessing where you are in your AI journey and where you want to be
- A comprehensive structure for building an effective AI capability across your entire organisation to create actionable insights from data
- A technical deep dive for technology leaders
BigQuery Explainable AI for Demystifying the Inner Workings of ML Models. Now GA!

6555
Of your peers have already read this article.
2:00 Minutes
The most insightful time you'll spend today!
Explainable AI (XAI) helps you understand and interpret how your machine learning models make decisions. We’re excited to announce that BigQuery Explainable AI is now generally available (GA). BigQuery is the data warehouse that supports explainable AI in a most comprehensive way w.r.t both XAI methodology and model types. It does this at BigQuery scale, enabling millions of explanations within seconds with a single SQL query.
Why is Explainable AI so important? To demystify the inner workings of machine learning models, Explainable AI is quickly becoming an essential and growing need for businesses as they continue to invest in AI and ML. With 76% of enterprises now prioritizing artificial intelligence (AI) and machine learning (ML) over other initiatives in 2021 IT budgets, the majority of CEOs (82%) believe that AI-based decisions must be explainable to be trusted according to a PwC survey.
While the focus of this blogpost is on BigQuery Explainable AI, Google Cloud provides a variety of tools and frameworks to help you interpret models outside of BigQuery, such as with Vertex Explainable AI, which includes AutoML Tables, AutoML Vision, and custom-trained models.
So how does Explainable AI in BigQuery work exactly? And how might you use it in practice?
Two types of Explainable AI: global and local explainability
When it comes to Explainable AI, the first thing to note is that there are two main types of explainability as they relate to the features used to train the ML model: global explainability and local explainability.
Imagine that you have a ML model that predicts housing price (as a dollar amount), based on three features: (1) number of bedrooms, (2) distance to the nearest city center, and (3) construction date.
Global explainability (a.k.a. global feature importance) describes the features’ overall influence on the model and helps you understand if a feature had a greater influence than other features over the model’s predictions. For example, global explainability can reveal that the number of bedrooms and distance to city center typically has a much stronger influence than the construction date on predicting housing prices. Global explainability is especially useful if you have hundreds or thousands of features and you want to determine which features are the most important contributors to your model. You may also consider using global explainability as a way to identify and prune less important features to improve the generalizability of their models.
Local explainability (a.k.a. feature attributions) describes the breakdown of how each feature contributes towards a specific prediction. For example, if the model predicts that house ID#1001 has a predicted price of $230,000, local explainability would describe a baseline amount (e.g. $50,000) and how each of the features contributes on top of the baseline towards the predicted price. For example, the model may say that on top of the baseline of $50,000, having 3 bedrooms contributed an additional $50,000, close proximity to the city center added $100,000, and construction date of 2010 added $30,000, for a total predicted price of $230,000. In essence, understanding the exact contribution of each feature used by the model to make each prediction is the main purpose of local explainability.
What ML models does BigQuery Explainable AI apply to?
BigQuery Explainable AI applies to a variety of models, including supervised learning models for IID data and time series models. The documentation for BigQuery Explainable AI provides an overview of the different ways of applying explainability per model. Note that each explainability method has its own way of calculation (e.g. Shapley values), which are covered more in-depth in the documentation.

Examples with BigQuery Explainable AI
In this next section, we will show three examples of how to use BigQuery Explainable AI in different ML applications:
Regression models with BigQuery Explainable AI
Let’s use a boosted tree regression model to predict how much a taxi cab driver will receive in tips for a taxi ride, based on features such as number of passengers, payment type, total payment and trip distance. Then let’s use BigQuery Explainable AI to help us understand how the model made the predictions in terms of global explainability (which features were most important?) and local explainability (how did the model arrive at each prediction?).
The taxi trips dataset comes from the BigQuery public datasets and is publicly available in the table: bigquery-public-data.new_york_taxi_trips.tlc_yellow_trips_2018.
First, you can train a boosted tree regression model.
CREATE OR REPLACE MODEL bqml_tutorial.taxi_tip_regression_modelOPTIONS (model_type='boosted_tree_regressor',input_label_cols=['tip_amount'],max_iterations = 50,tree_method = 'HIST',subsample = 0.85,enable_global_explain = TRUE) ASSELECTvendor_id,passenger_count,trip_distance,rate_code,payment_type,total_amount,tip_amountFROM`bigquery-public-data.new_york_taxi_trips.tlc_yellow_trips_2018`WHERE tip_amount >= 0LIMIT 1000000
Now let’s do a prediction using ML.PREDICT, which is the standard way in BigQuery ML to make predictions without explainability.
SELECT *FROMML.PREDICT(MODEL bqml_tutorial.taxi_tip_regression_model,(SELECT"0" AS vendor_id,1 AS passenger_count,CAST(5.85 AS NUMERIC) AS trip_distance,"0" AS rate_code,"0" AS payment_type,CAST(55.56 AS NUMERIC) AS total_amount))

But you might wonder—how did the model generate this prediction of ~11.077?
BigQuery Explainable AI can help us answer this question. Instead of using ML.PREDICT, you use ML.EXPLAIN_PREDICT with an additional optional parameter top_k_features. ML.EXPLAIN_PREDICT extends the capabilities of ML.PREDICT by outputting several additional columns that explain how each feature contributes to the predicted value. In fact, since ML.EXPLAIN_PREDICT includes all the output from ML.PREDICT anyway, you may want to consider using ML.EXPLAIN_PREDICT every time instead.
SELECT *FROMML.EXPLAIN_PREDICT(MODEL bqml_tutorial.taxi_tip_regression_model,(SELECT"0" AS vendor_id,1 AS passenger_count,CAST(5.85 AS NUMERIC) AS trip_distance,"0" AS rate_code,"0" AS payment_type,CAST(55.56 AS NUMERIC) AS total_amount),STRUCT(6 AS top_k_features))

The way to interpret these columns is:
Σfeature_attributions + baseline_prediction_value = prediction_value
Let’s break this down. The prediction_value is ~11.077, which is simply the predicted_tip_amount. The baseline_prediction_value is ~6.184, which is the tip amount for an average instance. top_feature_attributions indicates how much each of the features contributes towards the prediction value. For example, total_amount contributes ~2.540 to the predicted_tip_amount.
ML.EXPLAIN_PREDICT provides local feature explainability for regression models. For global feature importance, see the documentation for ML.GLOBAL_EXPLAIN.
Classification models with BigQuery Explainable AI
Let’s use a logistic regression model to show you an example of BigQuery Explainable AI with classification models. We can use the same public dataset as before: bigquery-public-data.new_york_taxi_trips.tlc_yellow_trips_2018.
Train a logistic regression model to predict the bracket of the percentage of the tip amount out of the taxi bill.
CREATE OR REPLACE MODEL bqml_tutorial.taxi_tip_classification_modelOPTIONS(model_type='logistic_reg',input_label_cols=['tip_bucket'],enable_global_explain=true) ASSELECTvendor_id,passenger_count,trip_distance,rate_code,payment_type,total_amount,CASEWHEN tip_amount > total_amount*0.20 THEN '20% or more'WHEN tip_amount > total_amount*0.15 THEN '15% to 20%'WHEN tip_amount > total_amount*0.10 THEN '10% to 15%'ELSE '10% or less'END AS tip_bucketFROM`bigquery-public-data.new_york_taxi_trips.tlc_yellow_trips_2018`WHERE tip_amount >= 0LIMIT 1000000
Next, you can run ML.EXPLAIN_PREDICT to get both the classification results and the additional information for local feature explainability. For global explainability, you can use ML.GLOBAL_EXPLAIN. Again, since ML.EXPLAIN_PREDICT includes all the output from ML.PREDICT anyway, you may want to consider using ML.EXPLAIN_PREDICT every time instead.
SELECT *FROMML.EXPLAIN_PREDICT(MODEL bqml_tutorial.taxi_tip_classification_model,(SELECT"0" AS vendor_id,1 AS passenger_count,CAST(5.85 AS NUMERIC) AS trip_distance,"0" AS rate_code,"0" AS payment_type,CAST(55.56 AS NUMERIC) AS total_amount),STRUCT(6 AS top_k_features))

Similar to the regression example earlier, the formula is used to derive the prediction_value:
Σfeature_attributions + baseline_prediction_value = prediction_value
As you can see in the screenshot above, the baseline_prediction_value is ~0.296. total_amount is the most important feature in making this specific prediction, contributing ~0.067 to the prediction_value, though followed by trip_distance. The feature passenger_count contributes negatively to prediction_value by -0.0015. The features vendor_id, rate_code, and payment_type did not seem to contribute much to the prediction_value.
You may wonder why the prediction_value of ~0.389 doesn’t equal the probability value of ~0.359. The reason is that unlike for regression models, for classification models, prediction_value is not a probability score. Instead, prediction_value is the logit value (i.e., log-odds) for the predicted class, which you could separately convert to probabilities by applying the softmax transformation to the logit values. For example, a three-class classification has a log-odds output of [2.446, -2.021, -2.190]. After applying the softmax transformation, the probability of these class predictions is [0.9905, 0.0056, 0.0038].
Time-series forecasting models with BigQuery Explainable AI

Explainable AI for forecasting provides more interpretability into how the forecasting model came to its predictions. Let’s go through an example of forecasting the number of bike trips in NYC using the new_york.citibike_trips public data in BigQuery.
You can train a time-series model ARIMA_PLUS:
CREATE OR REPLACE MODEL bqml_tutorial.nyc_citibike_arima_modelOPTIONS(model_type = 'ARIMA_PLUS',time_series_timestamp_col = 'date',time_series_data_col = 'num_trips',holiday_region = 'US') ASSELECTEXTRACT(DATE from starttime) AS date,COUNT(*) AS num_tripsFROM`bigquery-public-data.new_york.citibike_trips`GROUP BY dateNext, you can first try forecasting without explainability using ML.FORECAST:SELECT*FROMML.FORECAST(MODEL bqml_tutorial.nyc_citibike_arima_model,STRUCT(365 AS horizon, 0.9 AS confidence_level))
This function outputs the forecasted values and the prediction interval. Plotting it in addition to the input time series gives the following figure.

But how does the forecasting model arrive at its predictions? Explainability is especially important if the model ever generates unexpected results.
With ML.EXPLAIN_FORECAST, BigQuery Explainable AI provides extra transparency into the seasonality, trend, holiday effects, level (step) changes, and spikes and dips outlier removal. In fact, since ML.EXPLAIN_FORECAST includes all the output from ML.FORECAST anyway, you may want to consider using ML.EXPLAIN_FORECAST every time instead.
SELECT*FROMML.EXPLAIN_FORECAST(MODEL bqml_tutorial.nyc_citibike_arima_model,STRUCT(365 AS horizon, 0.9 AS confidence_level))

Compared to the previous figure which only shows the forecasting results, this figure shows much richer information to explain how the forecast is made.
First, it shows how the input time series is adjusted by removing the spikes and dips anomalies, and by compensating the level changes. That is:
time_series_adjusted_data = time_series_data - spikes_and_dips - step_changes
Second, it shows how the adjusted input time series is decomposed into different components such as both weekly and yearly seasonal components, holiday effect component and trend component. That is
time_series_adjusted_data = trend + seasonal_period_yearly + seasonal_period_weekly + holiday_effect + residual
Finally, it shows how these components are forecasted separately to compose the final forecasting results. That is:
time_series_data = trend + seasonal_period_yearly + seasonal_period_weekly + holiday_effect
For more information on these time series components, please see the documentation here.
Conclusion
With the GA of BigQuery Explainable AI, we hope you will now be able to interpret your machine learning models with ease.
Thanks to the BigQuery ML team, especially Lisa Yin, Jiashang Liu, Amir Hormati, Mingge Deng, Jerry Ye and Abhinav Khushraj. Also thanks to the Vertex Explainable AI team, especially David Pitman and Besim Avci.
More Relevant Stories for Your Company

Wayfair: Carving the path towards MLOps excellence with Vertex AI
Editor’s note: In part one of this blog, Wayfair shared how it supports each of its 30 million active customers using machine learning (ML). Wayfair’s Vinay Narayana, Head of ML Engineering, Bas Geerdink, Lead ML Engineer, and Christian Rehm, Senior Machine Learning Engineer, take us on a deeper dive into

How the Telegraph is Reimagining Media with Google Cloud
Whether they’re reading the newspaper on the way to work, or catching up on the latest headlines on their smartphones, readers expect up-to-the-minute news wherever and whenever makes the most sense for them. As a result, media companies are increasingly looking for ways to improve, expand, and simplify their offerings,

Tackling Real-Time Bidding Challenges: Arpeely’s Fresh Approach with Google Cloud
At Arpeely, we’ve developed some of the world’s most advanced advertising technology. Our machine learning (ML) media acquisition platform and “win-win” business model enables customers to bring highly intentful users to their offerings with precision, peace of mind and minimal overhead. Real-time bidding is a dynamic and intricate process that involves

Data-first Digitization Helps Leverage the Cloud for Your Mainframe Assets
For many enterprises, the venerable mainframe is home to decades’ worth of data about the company’s customers, processes and operations. And it goes without saying that the business would like access to that mainframe data — to report on it, to analyze it with big data analysis tools, or to
