





How Vertex AI Helps Coca-Cola Bottlers Japan Analyze Billions of Data Records

6191
Of your peers have already read this article.
4:00 Minutes
The most insightful time you'll spend today!
Japan is home to millions of vending machines installed on streets and in buildings, sports stadiums and other facilities. Vending machine owners and operators, including beverage manufacturers, stock these machines with different product combinations depending on location and demand. For example, they primarily display coffee and energy drinks in machines placed in offices and sports drinks and mineral water in machines at sports facilities. The combinations also vary by season: for example, owners and operators may display cold beverages in summer and hot beverages in winter.
Traditionally, vending machine operators have relied on the intuition and experience of sales managers to determine the optimum product mix for each vending machine. However, in recent years, manufacturers such as Coca-Cola Bottlers Japan (CCBJ) have turned to data to analyze and make strategic decisions about when and where to locate products in machines.
CCBJ is the number one Coca-Cola bottler in Asia and vending machines comprise the bulk of its business. The organization operates about 700,000 machines across Tokyo, Osaka, Kyoto, and 35 prefectures. Minori Matsuda, Google Developer Expert and also Data Science Manager at CCBJ, says “The billions of data records collected from 700,000 physical devices are a great asset and a treasure trove we can take advantage of.”
Minori points out that when considering the mix of products in vending machines in sporting facilities, the managers naturally assume sports drinks would generally sell well. However, analysis of purchase data – including hot drinks and hot drinks plus sports drinks – found many parents purchased sweet drinks such as milk tea when they attended games or sessions involving their children. “Analyzing data gives us new discoveries and, by using catchy storytelling techniques from exploratory data analysis, we are instilling a data culture within our company,” he says. “It’s worth creating by looking at facts rather than making assumptions!”
Minori believes that to analyze the vast amount of data collected from more than 700,000 vending machines, the business needs a powerful analytical platform. However, until recently, CCBJ had to extract data for analysis from its core systems, load this data into a warehouse it created and perform the required analyses. The billions of records of data generated across the fleet – including transaction data – exposed some challenges for traditional analysis platforms. They could not efficiently process data at a considerable scale: it could take a day to return results and required extensive maintenance due to the size.
CCBJ considered building a machine learning (ML) platform as a layer on top of existing systems in August 2020 and opted for Google Cloud the following month. “I feel that Google Cloud has an edge in all products and is very well thought out,“ says Minori, noting the scalability and cost of the platform allow the business to take a ‘trial and error’ approach to achieve the best outcomes from ML. Google Cloud also delivered the required visibility and flexibility to help the business deliver change every day against key performance indicators.
MLOps platform streamlines ML pipeline development
CCBJ built its analysis platform using Vertex AI (formerly AI Platform) centered on a BigQuery analytics data warehouse, and partly using AutoML for tabular data. “We have created a prediction model of where to place vending machines, what products are lined up in the machines and at what price, how much they will sell, and implemented a mechanism that can be analyzed on a map,” says Minori, adding that building the platform with Google Cloud was not difficult. “We were able to realize it in a short period of time with a sense of speed, from platform examination to introduction, prediction model training, on-site proof of concept to rollout.”
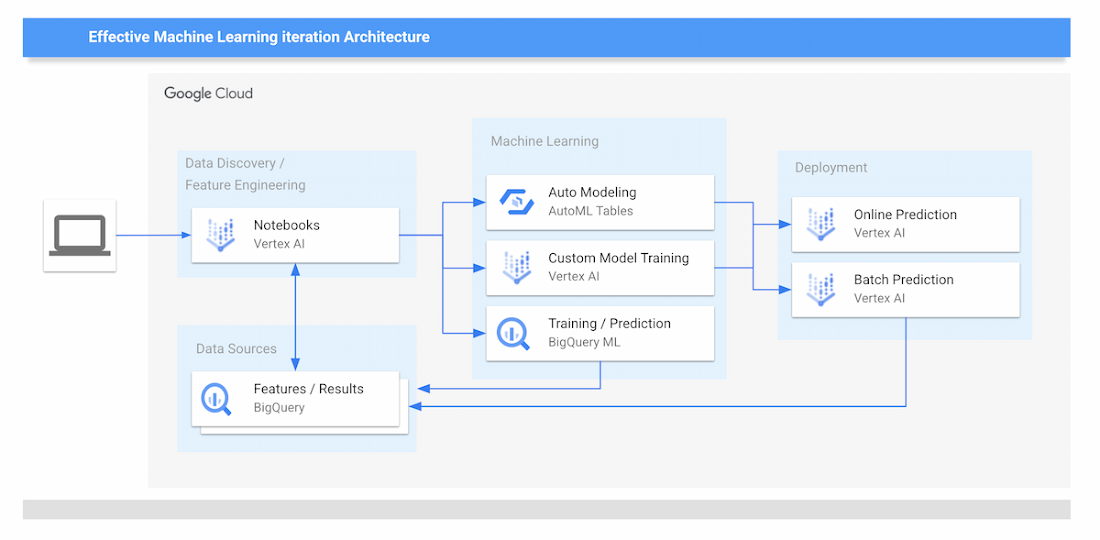
The new data analytics platform of CCBJ consists of the following parts:
Data Sources
- The data collected from the vending machines are all stored on BigQuery.
Data Discovery and Feature Engineering
- Minori and other data scientists at CCBJ are using Vertex Notebooks, where they access the data on BigQuery by executing SQL queries directly from the Notebooks. This environment is used for the data discovery process and feature engineering.
ML Training
- For ML training, CCBJ uses AutoML for Tabular data, Custom model training on Vertex AI, and BigQuery ML. AutoML gives model performance with AUC curves and also feature importance graphs.
ML Prediction and Serving
- For ML prediction, CCBJ uses Online Prediction for AutoML models and Online Prediction for custom models for real-time prediction when the salesperson finds the interesting point
- Batch Prediction is used for generating a large prediction map that covers the whole country
- The prediction results are distributed to sales managers’ tablets
CCBJ started constructing the platform in September 2020, and completed it within a month. The business has conducted proofs of concept at its base in Kyoto since February 2021, and since April, has rolled out the platform to sales managers in 35 prefectures in one metropolitan area. “Data analysis is built into the day-to-day routines of sales managers with 100% utilization,” says Minori. “They can utilize the prediction results on tablets that were able to achieve pretty high accuracy from the start.”
The hardest part was the education of sales managers in the field; having them understand the reasoning behind the ML prediction results for particular outcomes, so they could be convinced to make use of the results. “For example, regarding a new installation location predicted by the model, it seemed that there was no effective information for installation from the map information, but when I actually went there, there was a motorcycle shop and it was a place where young people who like motorcycles gathered,” says Minori. “Or there is a small meeting place where the elderly in the neighborhood are active.
“In many cases, new discoveries that cannot be understood from map information alone can be derived from the data.”
Minori also points to a phenomenon whereby humans pursued and confirmed factors inferred by the model – meaning that once they experienced analysis and it worked effectively, they asked why the same type of analysis or prediction could not be undertaken next time. The resulting cycle of more inquiries generated, more information gathered and more data captured for analysis meant the accuracy of results was improved.
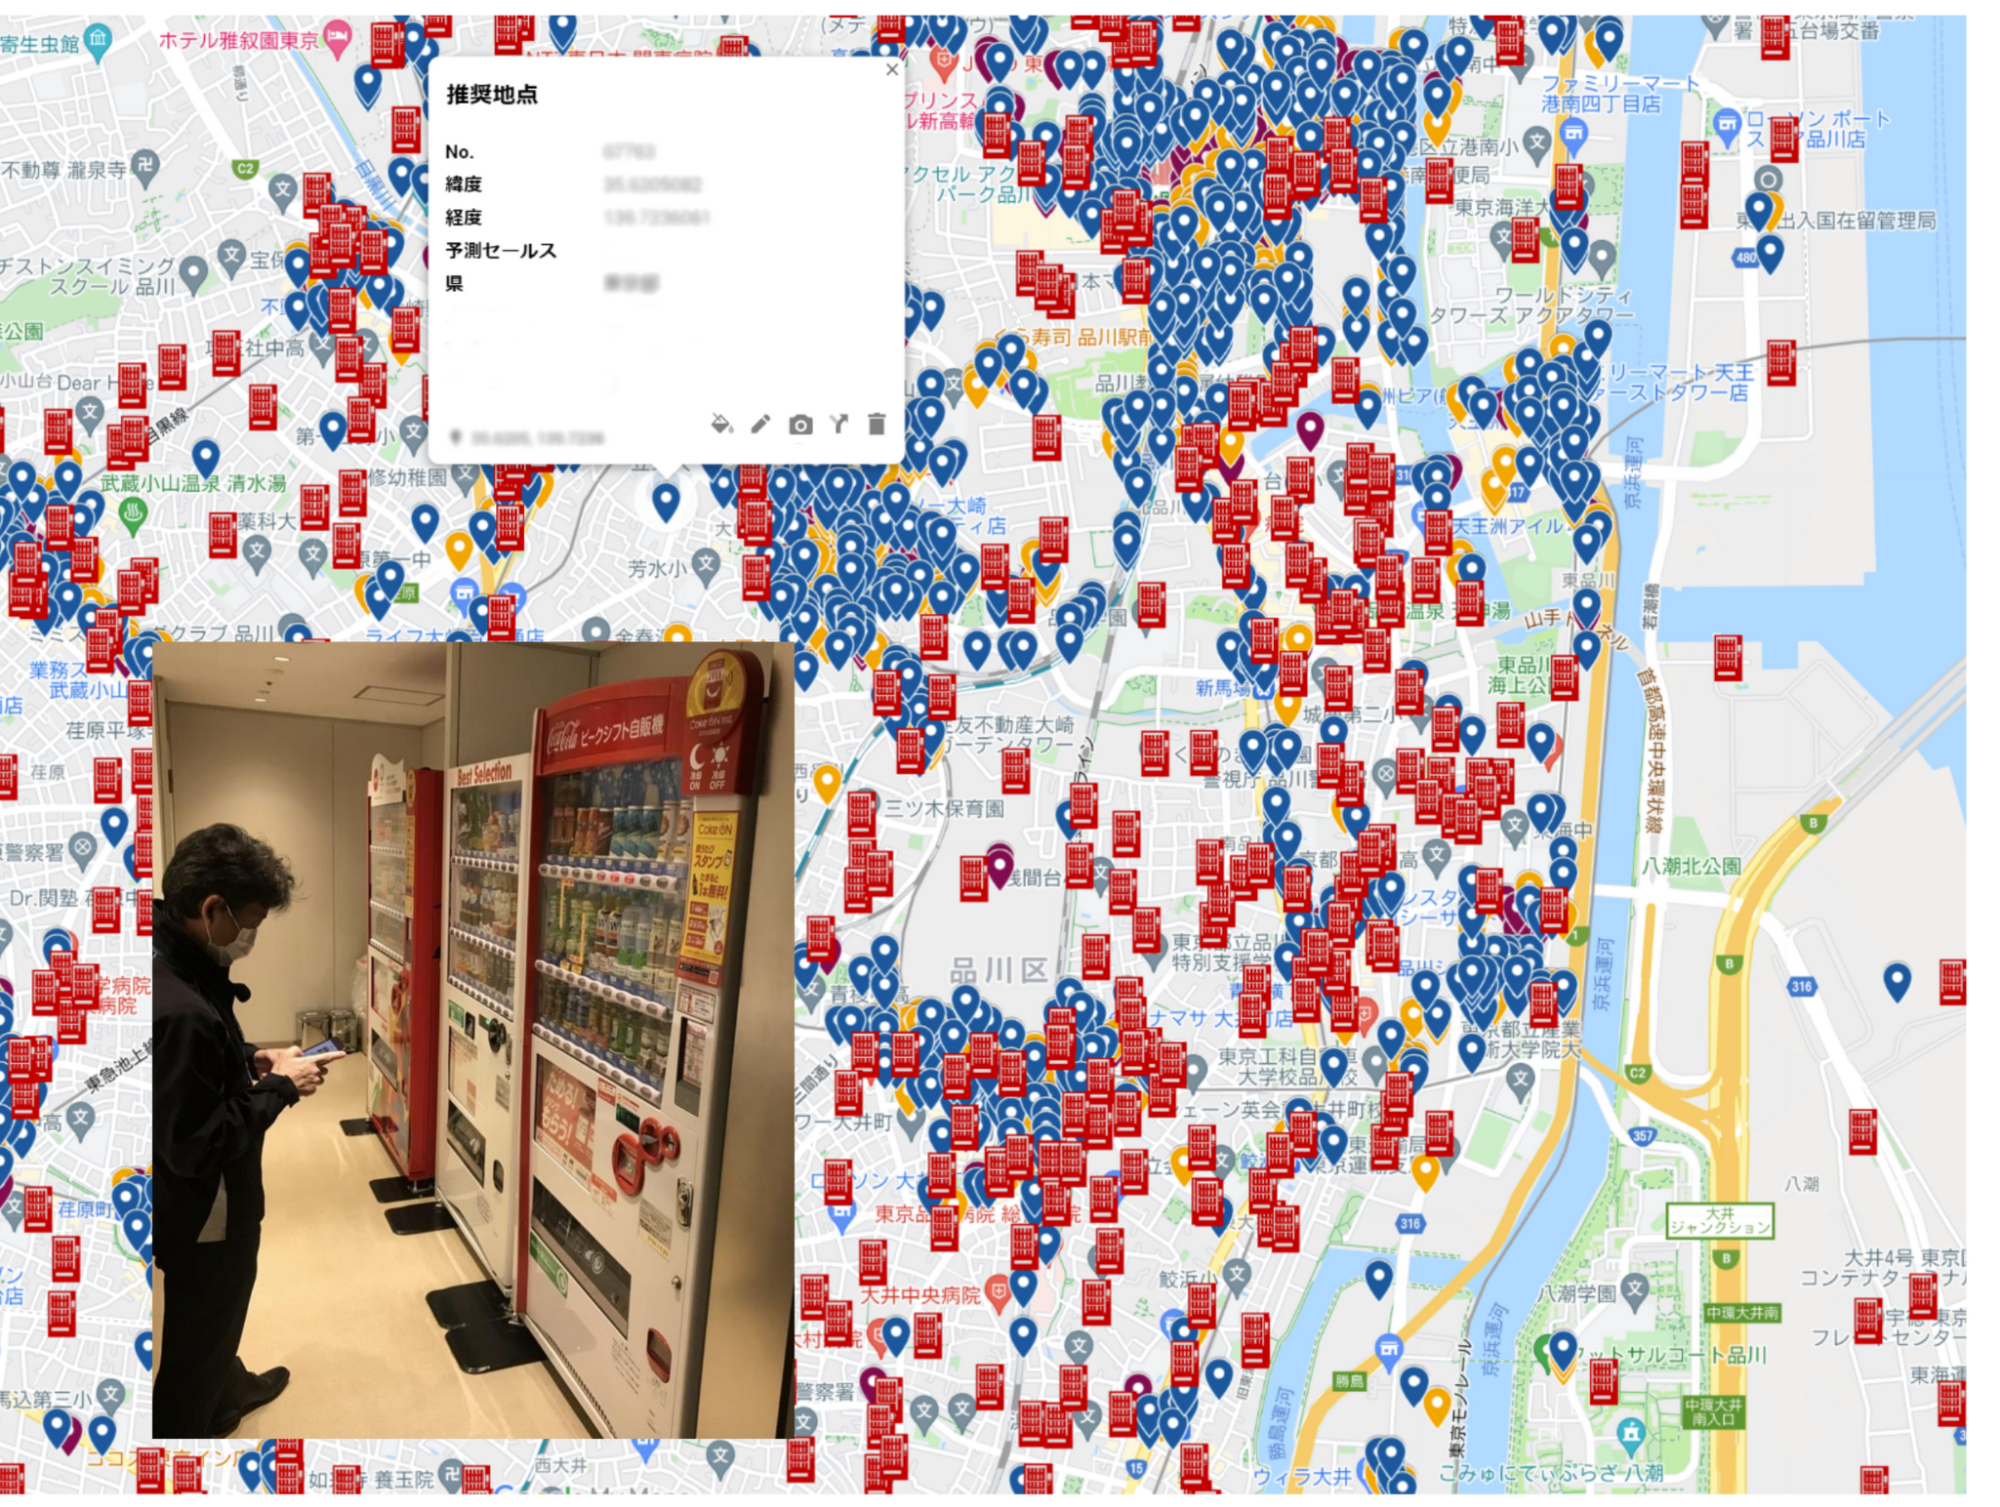
Minori describes Vertex AI as having a number of strengths in helping CCBJ build a ML data analysis platform. “One of the major merits of Vertex AI was that we were able to realize MLOps that streamlines the entire development life cycle from construction of the ML pipeline to its execution,” he says.
With near real-time data analysis through Google Cloud, CCBJ teams can spend time developing strategies rather than waiting for data requested from the IT systems department. Exploratory data analysis is also considerably easier as repeated trial and error has greatly improved the accuracy of analyses. Before we used Machine Learning, most machine placement processes were done by human senses, by looking at a map to find the suggestion points. By using Machine Learning to generate a massive number of placement point suggestions, the efficiency of routing of salespeople has been dramatically improved.
In the future, CCBJ aims to automate the continuous training pipeline with Vertex AI. “CCBJ is a tech company that operates in the food industry,” says Minori. With the organization operating a vending machine network of 700,000 units, it would like to create new businesses based on utilization and analyzing data. Some of these businesses may be based on Sustainable Development Goals (SDGs) initiatives such as the utilization of recycled PET bottles, measures to prevent food loss and ways of using vending machines to contribute to local communities, which we have been working on for some time. It would be interesting if we could collaborate with Google Cloud on these in the future.”

Turning the Tide: How PrestaShop Regained Trust in Data

4266
Of your peers have already read this article.
3:30 Minutes
The most insightful time you'll spend today!
Since 2007, PrestaShop has helped companies unlock the power of e-commerce through its open-source platform. Over 300,000 merchants worldwide use the PrestaShop platform to grow their business and serve online shoppers.
“Our open-source strategy to ecommerce enablement sets us apart,” says Rémi Paulin, Ph.D., Data Architect at PrestaShop. “Customization is becoming more crucial to retailers, and our open-source platform allows companies to continually evolve their sites and services to stand out from competitors.”
As PrestaShop grew, it wished to derive more value from its data, but the company ran into issues caused by a legacy, siloed architecture that negatively impacted data consistency and accessibility.
Let’s look at how PrestaShop works with Google Cloud and partners Fivetran and Hightouch to gain more control over data, enable a beyond-BI data strategy, and increase employee engagement from less than 10% to more than 40%.
Improving trust in data
Core systems at PrestaShop, including SQL and NoSQL databases, and SaaS Applications, were siloed; each presenting its own data, often captured from different sources such as support tickets, marketing engagement, purchase activity, and product usage. This setup made data overall inconsistent as no single system would contain a source of truth, resulting in many inefficiencies, poor collaboration across teams, and a reluctance to use data to support key decisions.
“Not long ago, less than 10% of the company regularly relied on data, so we were missing opportunities to make more data-driven decisions,” says Paulin. “Data was underutilized, and people were rapidly losing trust in data.”
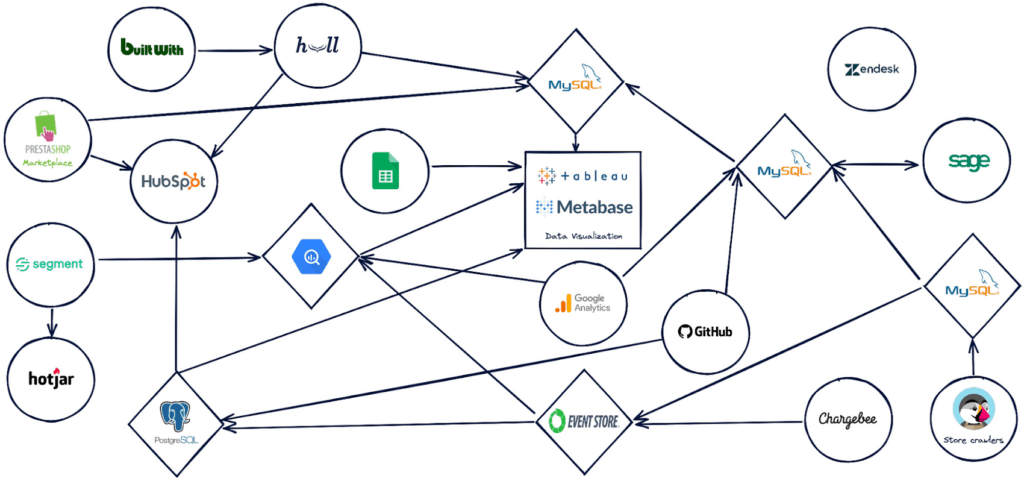
PrestaShop set out to design a new architecture to address past challenges, such as lack of data consistency, and improve data accessibility.
“Google Cloud, along with Hightouch and Fivetran, allowed us to build a modern stack to solve these challenges and support our beyond-BI data strategy.”
Building a modern data stack
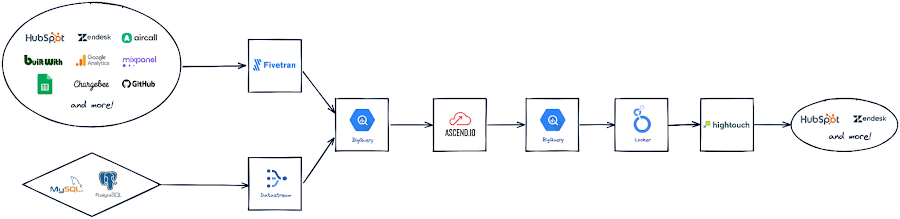
The first step was to build a robust data ingestion pipeline. After considering several vendors, PrestaShop chose to work with Fivetran to extract data from SaaS applications, including Zendesk, HubSpot, and GitHub, to load into BigQuery. They also use Datastream to stream Change Data Capture (CDC) data from transactional databases into BigQuery in real-time.
“Fivetran and Datastream are no-ops, efficient and highly reliable, and relieve our Data Engineers of management tasks. This brings us a high degree of confidence to build the rest of the stack atop these services,” says Paulin.
PrestaShop relies on several Google Cloud solutions, including Dataflow, and a managed Spark service by Ascend.io, for data transformation. It also uses Looker for its semantic modeling capacities and as a self-serve data platform.
As the company continued on its journey to transform how it manages and benefits from data, it engaged Hightouch to enable data accessibility through activation. Sitting on top of Looker, Hightouch unlocks all data models for operational intelligence. For example, in just a few days, the team built a customer knowledge model combining data from multiple sources and used Hightouch to sync data from the semantic layer to Zendesk via Reverse ETL. This allowed the care team to make more data-informed decisions, speeding up the time to resolve support tickets submitted through Zendesk by 33%.
“Hightouch feels like a natural extension of Looker and reinforces the position of the semantic data model as the single source of truth,” says Paulin. “It powers a variety of Data Activation use cases, supporting our beyond-BI strategy by providing teams with access to data when and where they need it to improve everyday operations. This has a big impact on the company, bolstering employee trust in available data.”
Becoming data-driven
In less than six months, PrestaShop managed to get the entire data stack up and running, build over 30 data models and engage over 120 employees with a small team of only two Data Engineers.
“Data is now accessible to every stakeholder within the company, regardless of their technical abilities,” says Paulin.
PrestaShop has already seen much progress in its shift to a more data-driven company and is excited to roll out more self-service intelligence capabilities in the future.
“Google Cloud drives home a culture of simplicity around our data stack, which is essential for us, especially given the small size of our engineering team,” says Paulin. “Fivetran and Hightouch share this culture of simplicity. Together, they offer strong foundations to support our data needs.”
Dashboards, which the company had always had an appetite for, are seamlessly created today. Before moving to Looker, a full-fledged dashboard would take an average of six weeks to develop. Now, it takes less than two days – and a simple dashboard can be created autonomously by business users in as little as 15 minutes.
Furthermore, data usage goes beyond dashboards. Thanks to Looker’s self-service exploration capabilities, many stakeholders can now glean insights surrounding product issues and business opportunities. Thanks to Hightouch, teams can activate their data to make better and smarter operational decisions.
“This is a big leap forward and one of many to come as we continue to add new models, activate our data, and onboard more users,” says Paulin. “Given our global reach and unique approach to e-commerce enablement, we know this is just the start of the great things we can accomplish with Google Cloud, Fivetran, and Hightouch.”
Check out Fivetran on Google Cloud Marketplace, or sign up for a free Hightouch workspace to learn more about what partners can do for your business.
3685
Of your peers have already watched this video.
61:30 Minutes
The most insightful time you'll spend today!
How to Move From Redshift to BigQuery Easily
Enterprise data warehouses are getting more expensive to maintain. Traditional data warehouses are hard to scale and often involve lots of data silos. Business teams need data insights quickly, but technology teams have to grapple with managing and providing that data using old tools that aren’t keeping up with demand. Increasingly, enterprises are migrating their data warehouses to the cloud to take advantage of the speed, scalability, and access to advanced analytics it offers.
With this in mind, we introduced the BigQuery Data Transfer Service to automate data movement to BigQuery, so you can lay the foundation for a cloud data warehouse without writing a single line of code. Earlier this year, we added the capability to move data and schema from Teradata and S3 to BigQuery via the BigQuery Data Transfer Service. To help you take advantage of the scalability of BigQuery, we’ve now added a service to transfer data from Amazon Redshift, in beta, to that list.
Data and schema migration from Redshift to BigQuery is provided by a combination of the BigQuery Data Transfer Service and a special migration agent running on Google Kubernetes Engine (GKE), and can be performed via UI, CLI or API. In the UI, Redshift to BigQuery migration can be initiated from BigQuery Data Transfer Service by choosing Redshift as a source.
The migration process has three steps:
- UNLOAD from Redshift to S3—The GKE agent initiates an UNLOAD operation from Redshift to S3. The agent extracts Redshift data as a compressed file, which helps customers minimize the egress costs.
- Transfer from S3 to Cloud Storage—The agent then moves data from Amazon S3 to a Cloud Storage bucket using Cloud Storage Transfer Service.
- Load from Cloud Storage to BigQuery—Cloud Storage data is loaded into BigQuery (up to 10 million files).
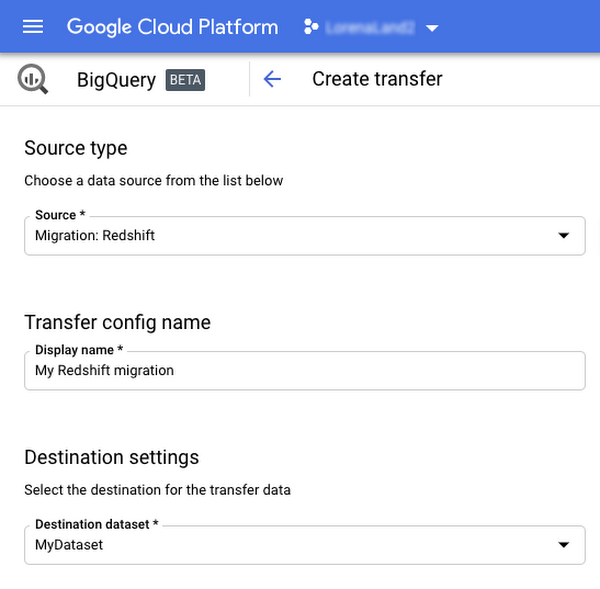
Watch the video to learn more!
BigQuery ML for Sentiment Analysis: How to Make the Most of Your Data

1807
Of your peers have already read this article.
4:30 Minutes
The most insightful time you'll spend today!
Introduction
We recently announced BigQuery support for sparse features which help users to store and process the sparse features efficiently while working with them. That functionality enables users to represent sparse tensors and train machine learning models directly in the BigQuery environment. Being able to represent sparse tensors is a useful feature because sparse tensors are used extensively in encoding schemes like TF-IDF as part of data pre-processing in NLP applications and for pre-processing images with a lot of dark pixels in computer vision applications.
There are numerous applications of sparse features such as text generation and sentiment analysis. In this blog, we’ll demonstrate how to perform sentiment analysis with the space features in BigQuery ML by training and inferencing machine learning models using a public dataset. This blog also highlights how easy it is to work with unstructured text data on BigQuery, an environment traditionally used for structured data.
Using sample IMDb dataset
Let’s say you want to conduct a sentiment analysis on movie reviews from the IMDb website. For the benefit of readers who want to follow along, we will be using the IMDb reviews dataset from BigQuery public datasets. Let’s look at the top 2 rows of the dataset.
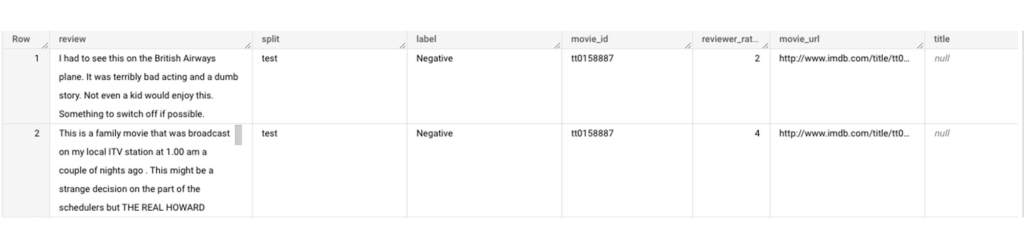
Although the reviews table has 7 columns, we only use reviews and label columns to perform sentiment analysis for this case. Also, we are only considering negative and positive values in the label columns. The following query can be used to select only the required information from the dataset.
SELECT
 review,
 label,
FROM
 `bigquery-public-data.imdb.reviews`
WHERE
 label IN ('Negative', 'Positive')
The top 2 rows of the result is as follows:
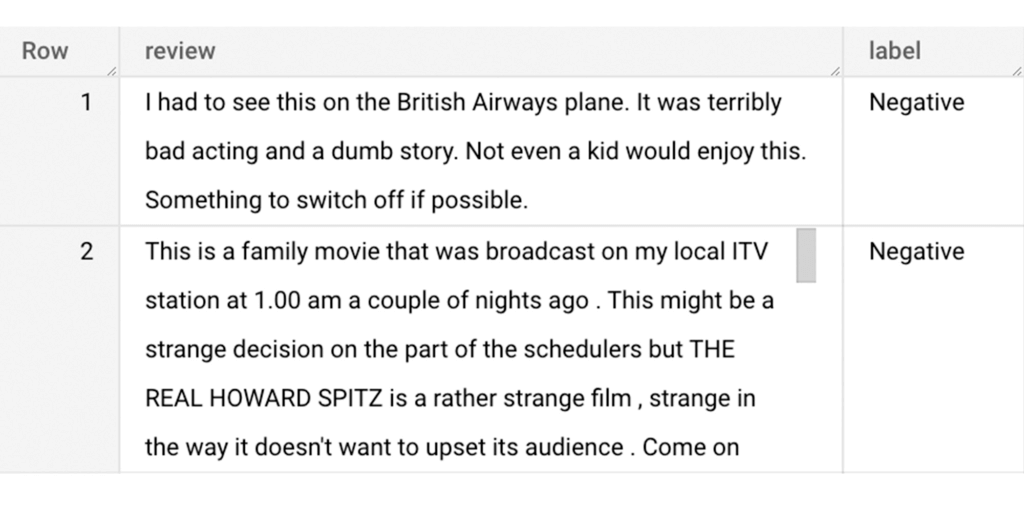
Methodology
Based on the dataset that we have, the following steps will be carried out:
- Build a vocabulary list using the review column
- Convert the review column into sparse tensors
- Train a classification model using the sparse tensors to predict the label (“positive” or “negative”)
- Make predictions on new test data to classify reviews as positive or negative.
Feature engineering
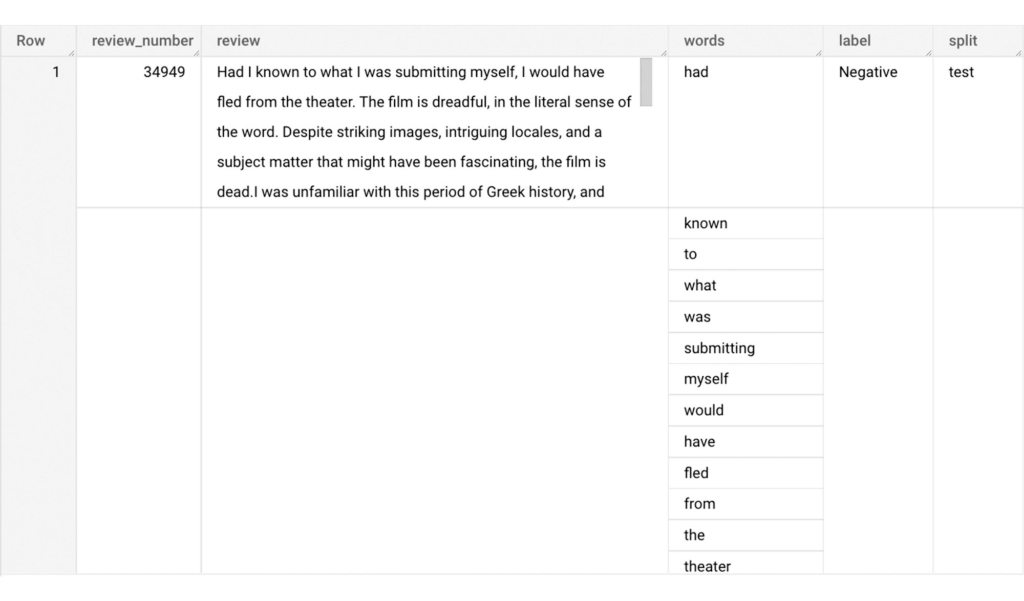
In this section, we will convert the text from the reviews column to numerical features so that we can feed them into a machine learning model. One of the ways is the bag-of-words approach where we build a vocabulary using the words from the reviews and select the most common words to build numerical features for model training. But first, we must extract the words from each review. The following code creates a dataset and a table with row numbers and extracted words from reviews.
-- Create a dataset named `sparse_features_demo` if doesn’t exist
CREATE SCHEMA IF NOT EXISTS sparse_features_demo;


-- Select unique reviews with only negative and positive labels
CREATE OR REPLACE TABLE sparse_features_demo.processed_reviews AS (
 SELECT
   ROW_NUMBER() OVER () AS review_number,
   review,
   REGEXP_EXTRACT_ALL(LOWER(review), '[a-z]{2,}') AS words,
   label,
   split
 FROM (
   SELECT
     DISTINCT review,
     label,
     split
   FROM
     `bigquery-public-data.imdb.reviews`
   WHERE
     label IN ('Negative', 'Positive')
 )
);
The output table from the query above should look like this:
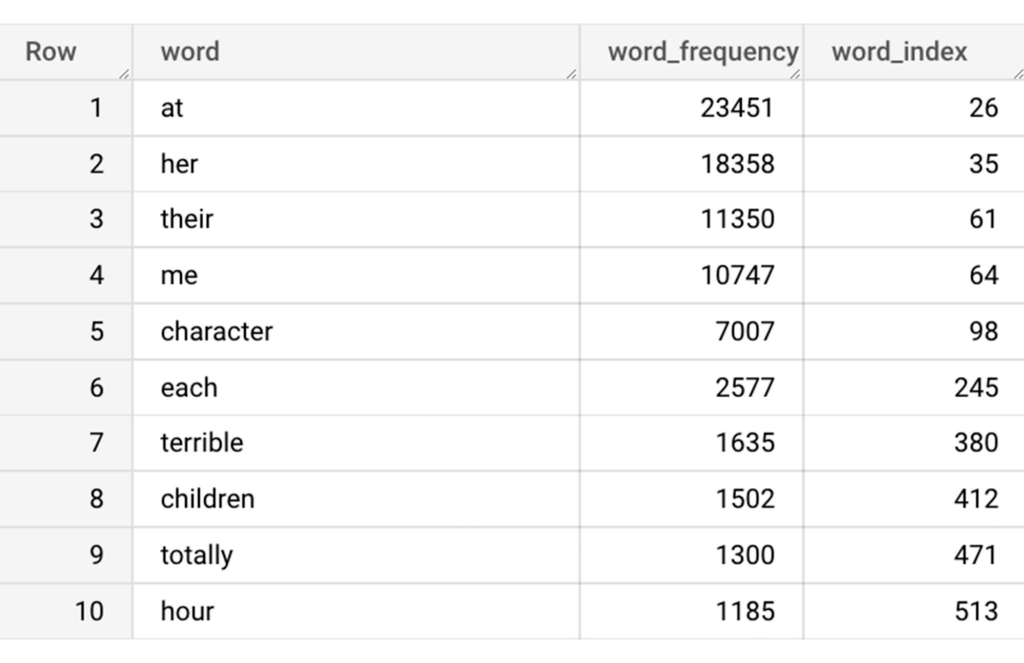
The next step is to build a vocabulary using the extracted words. The following code creates a vocabulary including word frequency and word index from reviews. For this case, we are going to select only the top 20,000 words to reduce the computation time.
-- Create a vocabulary using train dataset and select only top 20,000 words based on frequency
CREATE OR REPLACE TABLE sparse_features_demo.vocabulary AS (
 SELECT
   word,
   word_frequency,
   word_index
 FROM (
   SELECT
     word,
     word_frequency,
     ROW_NUMBER() OVER (ORDER BY word_frequency DESC) - 1 AS word_index
   FROM (
     SELECT
       word,
       COUNT(word) AS word_frequency
     FROM
       sparse_features_demo.processed_reviews,
       UNNEST(words) AS word
     WHERE
       split = "train"
     GROUP BY
       word
   )
 )
 WHERE
   word_index < 20000 # Select top 20,000 words based on word count
);
The following shows the top 10 words based on frequency and their respective index from the resulting table of the query above.
Creating a sparse feature
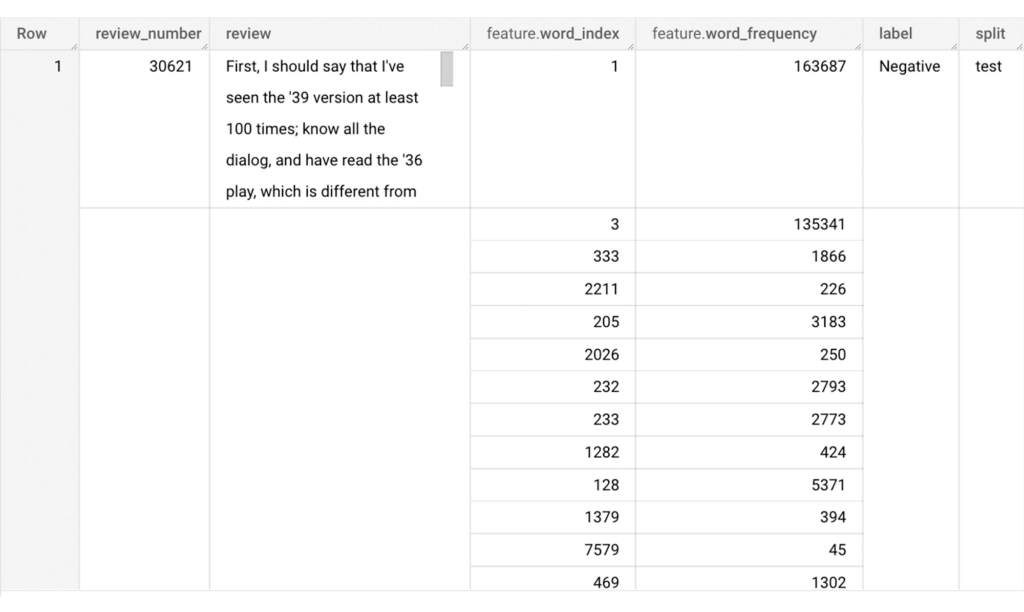
Now we will use the newly added feature to create a sparse feature in BigQuery. For this case, we aggregate word_index and word_frequency in each review, which generates a column as ARRAY[STRUCT] type. Now, each review is represented as ARRAY[(word_index, word_frequency)].
-- Generate a sparse feature by aggregating word_index and word_frequency in each review.
CREATE OR REPLACE TABLE sparse_features_demo.sparse_feature AS (
 SELECT
   review_number,
   review,
   ARRAY_AGG(STRUCT(word_index, word_frequency)) AS feature,
   label,
   split
 FROM (
   SELECT
     DISTINCT review_number,
     review,
     word,
     label,
     split
   FROM
     sparse_features_demo.processed_reviews,
     UNNEST(words) AS word
   WHERE
     word IN (SELECT word FROM sparse_features_demo.vocabulary)
 ) AS word_list
 LEFT JOIN
   sparse_features_demo.vocabulary AS topk_words
   ON
     word_list.word = topk_words.word
 GROUP BY
   review_number,
   review,
   label,
   split
);
Once the query is executed, a sparse feature named `feature` will be created. That `feature` column is an `ARRAY of STRUCT` column which is made of `word_index` and `word_frequency` columns. The picture below displays the resulting table at a glance.
Training a BigQuery ML model
We just created a dataset with a sparse feature in BigQuery. Let’s see how we can use that dataset to train with a machine learning model with BigQuery ML. In the following query, we will train a logistic regression model using the review_number, review, and feature to predict the label:
-- Train a logistic regression classifier using the data with sparse feature
CREATE OR REPLACE MODEL sparse_features_demo.logistic_reg_classifier
 TRANSFORM (
   * EXCEPT (
       review_number,
       review
     )
 )
 OPTIONS(
   MODEL_TYPE='LOGISTIC_REG',
   INPUT_LABEL_COLS = ['label']
 ) AS
 SELECT
   review_number,
   review,
   feature,
   label
 FROM
    sparse_features_demo.sparse_feature
 WHERE
   split = "train"
;
Now that we have trained a BigQuery ML Model using a sparse feature, we evaluate the model and tune it as needed.
-- Evaluate the trained logistic regression classifier
SELECT * FROM ML.EVALUATE(MODEL sparse_features_demo.logistic_reg_classifier);
The score looks like a decent starting point, so let’s go ahead and test the model with the test dataset.

-- Evaluate the trained logistic regression classifier using test data
SELECT * FROM ML.EVALUATE(MODEL sparse_features_demo.logistic_reg_classifier,
 (
   SELECT
     review_number,
     review,
     feature,
     label
   FROM
     sparse_features_demo.sparse_feature
   WHERE
     split = "test"
 )
);
The model performance for the test dataset looks satisfactory and it can now be used for inference. One thing to note here is that since the model is trained on the numerical features, the model will only accept numeral features as input. Hence, the new reviews have to go through the same transformation steps before they can be used for inference. The next step shows how the transformation can be applied to a user-defined dataset.
Sentiment predictions from the BigQuery ML model
All we have left to do now is to create a user-defined dataset, apply the same transformations to the reviews, and use the user-defined sparse features to perform model inference. It can be achieved using a WITH statement as shown below.
WITH
 -- Create a user defined reviews
 user_defined_reviews AS (
   SELECT
     ROW_NUMBER() OVER () AS review_number,
     review,
     REGEXP_EXTRACT_ALL(LOWER(review), '[a-z]{2,}') AS words
   FROM (
     SELECT "What a boring movie" AS review UNION ALL
     SELECT "I don't like this movie" AS review UNION ALL
     SELECT "The best movie ever" AS review
   )
 ),


 -- Create a sparse feature from user defined reviews
 user_defined_sparse_feature AS (
   SELECT
     review_number,
     review,
     ARRAY_AGG(STRUCT(word_index, word_frequency)) AS feature
   FROM (
     SELECT
       DISTINCT review_number,
       review,
       word
     FROM
       user_defined_reviews,
       UNNEST(words) as word
     WHERE
       word IN (SELECT word FROM sparse_features_demo.vocabulary)
   ) AS word_list
   LEFT JOIN
     sparse_features_demo.vocabulary AS topk_words
     ON
       word_list.word = topk_words.word
   GROUP BY
     review_number,
     review
 )


-- Evaluate the trained model using user defined data
SELECT review, predicted_label FROM ML.PREDICT(MODEL sparse_features_demo.logistic_reg_classifier,
 (
   SELECT
     *
   FROM
     user_defined_sparse_feature
 )
);
Here is what you would get for executing the query above:
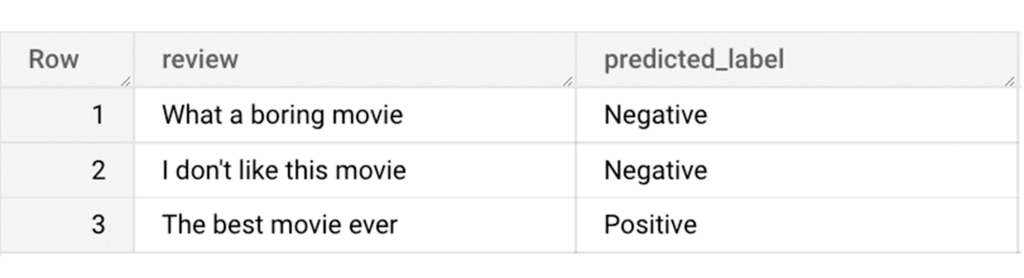
And that’s it! We just performed a sentiment analysis on the IMDb dataset from a BigQuery Public Dataset using only SQL statements and BigQuery ML. Now that we have demonstrated how sparse features can be used with BigQuery ML models, we can’t wait to see all the amazing projects that you would create by harnessing this functionality.
If you’re just getting started with BigQuery, check out our interactive tutorial to begin exploring.
Query Insights for Spanner: A blessing for developers and DBAs

3291
Of your peers have already read this article.
1:30 Minutes
The most insightful time you'll spend today!
Today, application development teams are more agile and are shipping features faster than ever before. In addition to these rapid development cycles and the rise of microservices architectures, the end-to-end ownership of feature development (and performance monitoring) has moved to a shared responsibility model between advanced database administrators and full-stack developers. However, most developers don’t have the years of experience or the time needed to debug complex query performance issues and database administrators are now a scarce resource in most organizations. As a result, there is a dire need for tools for developers and DBAs alike to quickly diagnose performance issues.
Introducing Query Insights for Spanner
We are delighted to announce the launch of Query Insights for Spanner, a set of visualization tools that provide an easy way for developers and database administrators to quickly diagnose query performance issues on Spanner. Using Query Insights, users can now troubleshoot query performance in a self-serve way. We’ve designed Query Insights using familiar design patterns with world-class visualizations to provide an intuitive experience for anyone who is debugging issues with query performance on Spanner. Query Insights is available at no additional cost.
By using out-of-the-box visual dashboards and graphs, developers can visualize aberrant behavior like peaks and troughs in various performance metrics over a time-series and quickly identify problematic queries. Time series data provides significant value to organizations because it enables them to analyze important real-time and historical metrics. Data is valuable only if it’s easy to comprehend;. that’s where being able to view intuitive dashboards becomes a force multiplier for organizations looking to expose their time series data across teams.
Follow a visual journey with pre-built dashboards
With Query Insights, developers can seamlessly move from detection of database performance issues to diagnosis of problematic queries using a single interface. Query Insights will help identify query performance issues easily with pre-built dashboards.
The user could do this by following a simple journey where they can quickly confirm, identify and analyze query performance issues. Let’s walk through an example scenario.
Understand database performance
This journey will start by the user setting up an alert on Google Cloud Monitoring for CPU utilization going above a certain threshold. The alert could be configured in a way that if this threshold is crossed, the user will be notified with an email alert, with a link to the “Monitoring” dashboard.
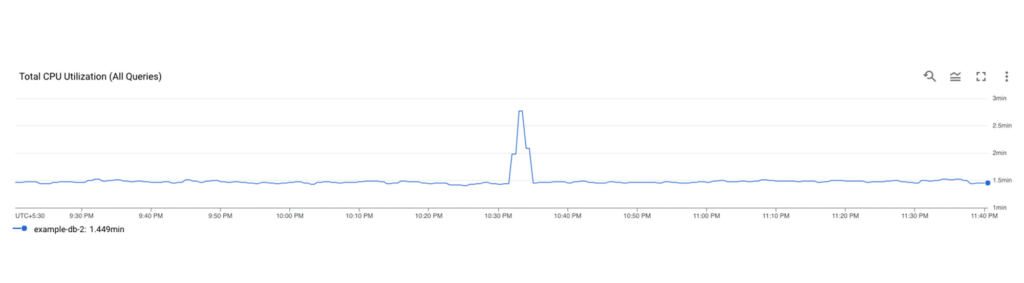
Once the user receives this alert, they would click on the link in the email, and navigate to the “Monitoring” dashboard. If they observe high CPU Utilization and high read latencies, the possible root cause could be expensive queries. A spike in CPU Utilization could be a strong signal that the system is using more compute than it usually would, due to an inefficient query.
The next step is to identify which query might be the problem, this is where Query Insights comes in. The user can get to this tool by clicking on Query Insights in the left navigation of your Spanner Instance. Here, they can drill down into the CPU usage by query and observe that for a specific database, CPU Utilization (attributed to all queries) is spiking for a particular time window. This confirms that the CPU utilization is due to inefficient queries.
Identifying a problematic query
The user now observes the TopN (Top queries by CPU Utilization) query graph to see the TopN queries by CPU Utilization. From the graph, it is very easy to visualize and identify the top queries which could be causing the spike in CPU Utilization.
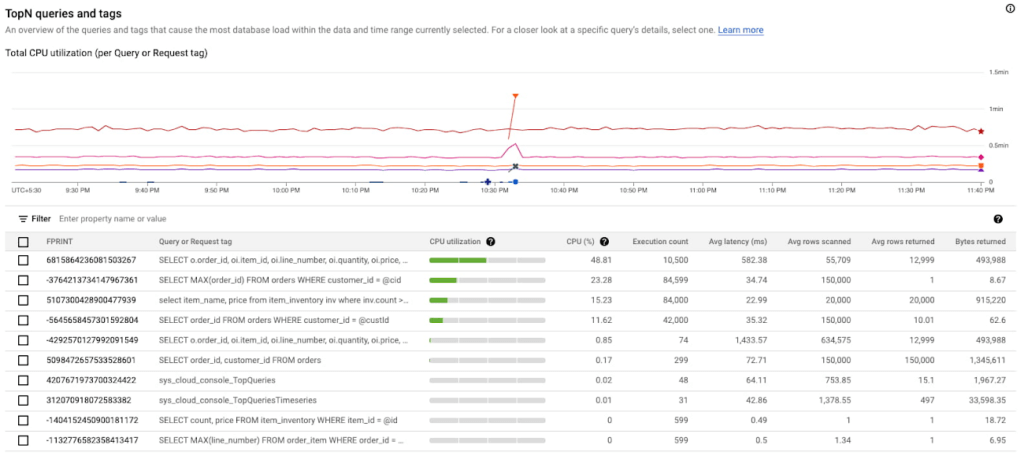
In the above screenshot, we can see that the first query in the table is showing a clear spike at 10:33 PM consuming 48.81% of total CPU. This is a clear indication that this query could be problematic, and the user should investigate further.
Analyzing the query performance
Once they have identified the problematic query, they can now drill down into this query shape to confirm, identify the root cause of the high CPU utilization.
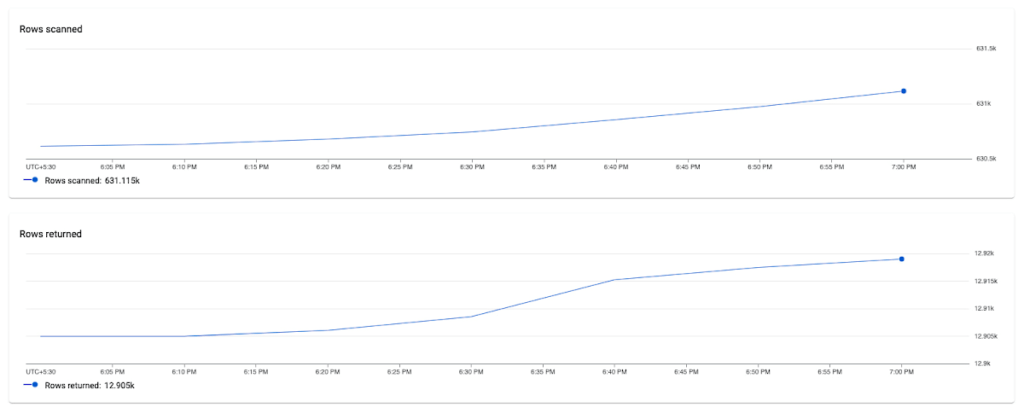
They can do this by clicking on the Fingerprint ID for the specific query from the topN table, and navigating to the Query Details page where they will be able to see a list of metrics (Latency, CPU Utilization, Execution count, Rows Scanned / Rows Returned) over a time series for that specific query.
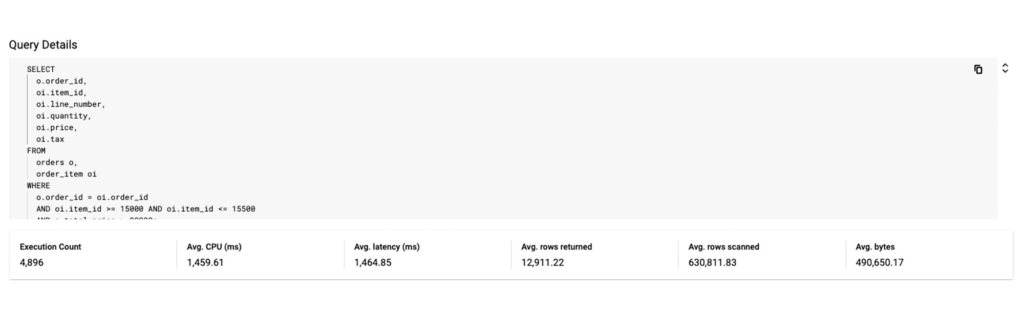
In this example, we notice that the average number of rows scanned for this specific query are very high (~ 600k rows scanned to return ~ 12k rows), which could point to a poor query design, resulting in an inefficient query. We can also observe that latency is high (1.4s) for this query.
Fixing the issue
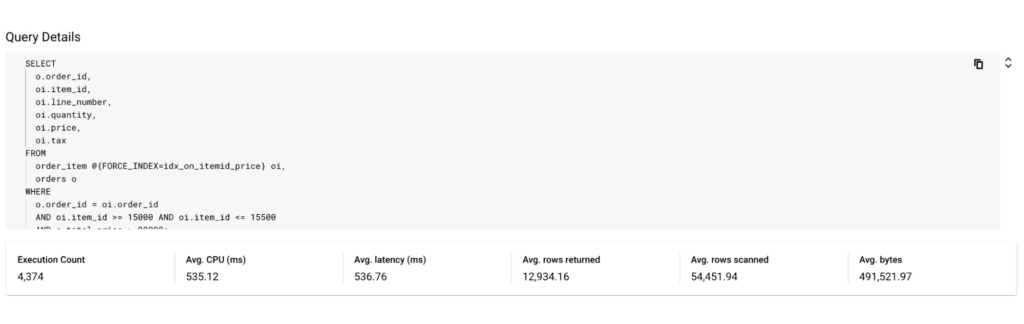
To fix the problem in this scenario, the user could optimize this query by specifying a secondary index in the query using a FORCE_INDEX query hint to provide an index directive. This would provide more consistent performance, make the query more efficient, and lower CPU utilization for this query.
In the screenshot below, you can see that after specifying the index in the query, the query performance dramatically increases in terms of CPU, rows scanned (54K vs 630k) and also in terms of query latency (536 ns vs 1.4 s).
Unoptimized Query:
Optimized Query:
By following this simple visual journey, the user can easily detect, diagnose and debug inefficient queries on Spanner.
Get started with Query Insights today
To learn more about Query Insights, review the documentation here. Query Insights is enabled by default. In the Spanner console, you can click on Query Insights in the left navigation and start visualizing your query performance metrics!
New to Spanner? Get started in minutes with a new database.
3787
Of your peers have already watched this video.
24:30 Minutes
The most insightful time you'll spend today!
Replacing Oracle with Cloud Spanner: What Optiva Learnt
Optiva is a Canada-based provider of business support system (BSS) and Operations Support Systems (OSS) software and services to the telecommunications vertical.
Optiva sought to improve its product offering. In the way were very tough challenges including a need for accuracy, the need to deal with very high volumes, the need for low latency.
So they looked at the market. And just by chance, they saw a Cloud Spanner press release.” And so we were looking. We were like: what can we do? How can we make this 10 times faster. And we read the Spanner press release, and we’re like: are you kidding me? This is our dream come true. We have a perfect database that can handle the transactional volume. It’s distributed, it’s consistent, multiple writings, like synchronized writing across 1,000 servers. It’s exactly what we needed to replace big bad Oracle,” says Danielle Roystone, CEO of Optiva.
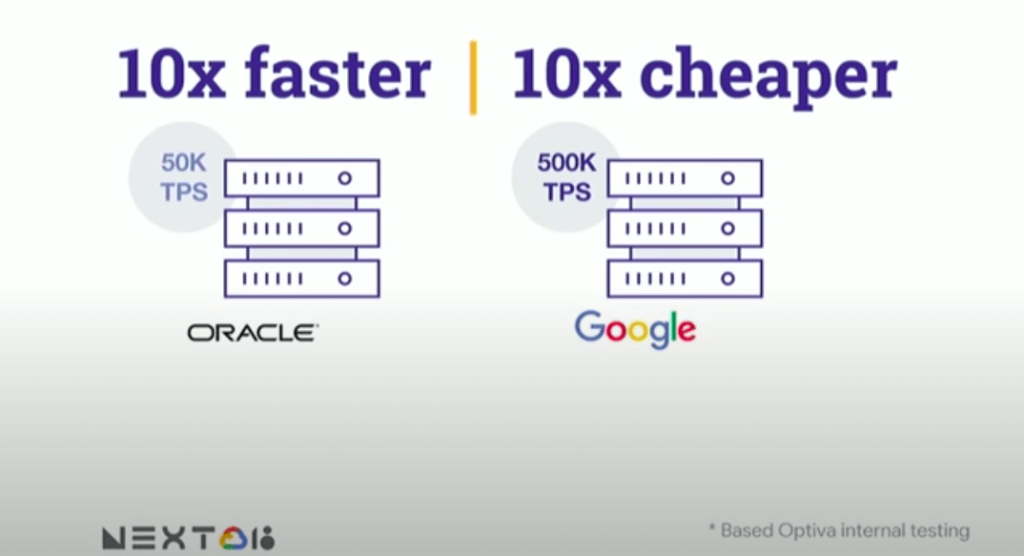
To hear the entire story, watch the video!
More Relevant Stories for Your Company

Serverless for Startups, the Best Way to Succeed: Expert Says
As Google Cloud has become a choice for more startups, I’ve experienced an increase in founders asking how they should think about cloud services. Though each startup is different and requirements may vary across industries and regions, I’ve seen a few core best practices that help startups to succeed—as well as several

AWS to Google Cloud Translator: Which AWS Database Service Is Equal to Google Cloud Database?
There are multiple reasons a growing number of database administrators, enterprise architects, application developers and other technology practitioners are moving to Google Cloud’s various database services. Some are being driven by missing features in offering from other providers such as AWS. In Gartner’s Magic Quadrant for Operational Database Management Systems,

Three New Features in Cloud SQL for SQL Server Extends its Functionality
As a product with a long history in the database ecosystem, SQL Server offers numerous native capabilities that help provide scalability and security to its users. However, it can be time consuming and complex to take advantage of these features. Google Cloud SQL for SQL Server saves your team time

Guide for Measuring Cloud Spanner Performance for Your Custom Workload
Database migration to a new database platform or technology can be daunting for various reasons. One of the common concerns is database performance. It is hard to evaluate database performance early in the evaluation cycle without performing actual data migration and application changes. This becomes even more important in the
