





Three New Features in Cloud SQL for SQL Server Extends its Functionality

3382
Of your peers have already read this article.
4:00 Minutes
The most insightful time you'll spend today!
As a product with a long history in the database ecosystem, SQL Server offers numerous native capabilities that help provide scalability and security to its users. However, it can be time consuming and complex to take advantage of these features. Google Cloud SQL for SQL Server saves your team time by eliminating much of the unnecessary toil (OS patching, version upgrades, replica setup etc.) while still allowing you to leverage the functionality you’re used to. Three new features for Cloud SQL for SQL Server take its functionality even further.
A few months ago, we announced Active Directory (AD) integration had entered preview; now, it is generally available. Equally exciting, we are releasing Cross-Region Replicas (based on SQL Server’s Always On Availability Groups) in preview. Finally, you can try out this great new functionality in our managed database service with the latest release of SQL Server 2019, which is now generally available.
Simple and Secure Windows Authentication with Active Directory
As one of the most requested and critical security capabilities for Cloud SQL for SQL Server, we are pleased to now provide Windows Authentication via Managed Service for Microsoft Active Directory as generally available. Customers should feel confident onboarding their business critical production workloads to the managed service while still maintaining the authentication best practices they rely on today. While identities can be created and managed directly within the managed AD service, many customers choose to establish a trust relationship with their existing on-prem AD footprint to leverage existing identity objects.
What is Cross-Region Replica for SQL Server?
Bringing parity in the Cloud SQL portfolio alongside MySQL and PostgreSQL, Cross-region replica makes it easy to create a fully managed read replica in a different region than that of the primary instance. You can create a replica in any Google Cloud region. The difference for SQL Server is the Availability Group based architecture that paves the way for the service to continue to offer more core compatibility with the SQL Server features our customers depend on. Cloud SQL greatly simplifies the traditional process of provisioning Availability Groups and streamlines it into a few-step workflow.

Using read replicas will allow you to horizontally scale your read workloads. For example, you can configure a reporting dashboard to work against a read replica, and because it’s only reading, it will not affect the primary instance. You can also promote replicas to be Cloud SQL instances and that could help you reduce your recovery point objective (RPO) and recovery time objective (RTO). It can help you with the RPO because the data is constantly replicated and the replica is probably more up to date than your latest backup. It can help you with RTO because promoting the replica, especially in an automated way, is a relatively short process. To get started, check out the documentation for Cross-Region Replica
What’s new in SQL Server 2019?
Providing the most current major and minor versions is a key aspect of maintaining compatibility and security for your database workload. Cloud SQL provides an easy provisioning experience that will now allow you to select from four editions of SQL Server 2019 similar to our current SQL Server 2017 options of Enterprise, Standard, Web, and Express. A few key considerations as you are evaluating the new version should be:
- Compatibility level – A newly created database on a Cloud SQL for SQL Server 2019 Databases instance has a compatibility level of 150 by default.
- Accelerated Database Recovery – Allows instances to reduce the availability impact of restarts and shutdowns.
- TempDB changes – While we recently provided you more control to manage your tempdb files, 2019 also brings optimization to improve performance as well.
- Intelligent query processing – SQL Server 2019 provides direct improvements to the query engine itself which may improve overall query processing and performance.
- Many other performance improvements – capabilities such as verbose truncation warnings, resumable index build, and others. Learn more about supported features here.
To get started, check out documentation for SQL Server 2019.
In conclusion
These three features have been the most common requests from our enterprise customers. Finally, you can bring your own Active Directory domain for SQL Server authentication and authorization, use the latest features from SQL Server 2019 and scale your read workloads as well as leveraging the cross regional replicas for faster disaster-recovery.
To get started, check out the documentation for Cross-Region Replica, Active Directory, and SQL Server 2019. All are available with any new instance created via the console or API, simply follow the instructions in the documentation.

3691
Of your peers have already downloaded this article
16:30 Minutes
The most insightful time you'll spend today!
Organizations today are being forced to make difficult decisions. Innovation has moved down the list for many companies, replaced with realities like making sure your business systems stay up and running during a disaster, managing unexpected shifts in demand,and above all, staying in business.
In the short term, this means looking for cost savings wherever possible, and making sure you’re up and running, no matter what circumstances come your way. In the longer term, it means identifying areas to reduce capital expenditures—including things like data center commitments, migration costs, and other overhead.
Google Cloud database solutions can help with both the short- and longer-term issues. Our solutions provide the opportunity to reduce the load that managing legacy applications is placing on your IT department and ensure you can manage unforeseen demand, all while making sure your databases are up and running, no matter what circumstances come your way.
In this whitepaper we’ll look in detail at some Google Cloud database solutions that can help you re-host, re-platform, or re-write your enterprise database with Google Cloud. You’ll see how we can help you plan for both the short- and long-term health of your Oracle workloads.
Google Cloud Leads the Landscape for Unstructured Data Security Platform: Forrester
7030
Of your peers have already read this article.
1:30 Minutes
The most insightful time you'll spend today!
As organizations expand their use of cloud computing services, more of their sensitive data inevitably moves to and lives in the cloud. Much of this sensitive data is unstructured and can be challenging to secure. Despite this potential challenge, the usefulness of cloud for data storage and processing is too big for most organizations to ignore and has in turn led to data sprawl, where their sensitive data is spread over many resources, both in the cloud and on-premise. Addressing data sprawl requires solutions that can discover, manage, and secure sensitive data, especially unstructured data, as it spreads.
To help organizations confidently move their sensitive data to the cloud, Google Cloud works diligently to earn and maintain customer trust. Control and transparency are pillars of our approach to offering a trusted cloud. Therefore, we’ve been expanding our capabilities to act on unstructured data as sprawl increases.
Given the importance of these capabilities to our strategy, we are happy to announce today that Forrester Research has named Google Cloud a Leader in The Forrester Wave™: Unstructured Data Security Platforms, Q2 2021 report, and rated Google Cloud highest in the current offering category among the providers evaluated.
The report evaluates the 11 most significant providers with platform solutions to secure and protect unstructured data, spanning from cloud providers to data security-focused vendors. The report notes that “Google offers breadth and depth with built-in data security in the cloud. Google Cloud Platform, Google Workspace, and BeyondCorp Enterprise have underlying data security products and features for protecting customer data.”
Google Cloud tools focused on protecting unstructured data were developed and battle-tested internally at Google to alleviate some of our own data security challenges. This brings the best of Google security to the organizations utilizing Google Cloud and our security tools. The report highlights that “Google productizes capabilities originally developed to secure its own business, and brings a disciplined approach to product enhancements for enterprise requirements. It serves a wide range of enterprise and mid-market, with a focus on emphasizing data protection needs by industry. ”
Google Cloud’s data security strategy focuses on meeting customers wherever they are in their cloud migration journey. The report highlights that “Google further enables a Zero Trust approach with third-party integrations through its BeyondCorp Alliance of partners in device management, endpoint security and gateways.”
Google Cloud received the highest possible score in sixteen criteria, in total receiving the most 5 out of 5 ratings among all vendors assessed. These criteria include: Data Intelligence, Access Control, Deletion, Obfuscation-Scope, Obfuscation-Key Management, Deployment, Security and Risk, APIs and Integration, Data Security Platform Vision, Data Security Execution Roadmap, Performance, Planned Enhancements, Zero Trust Enabling Partner Ecosystem, Diversity, Equity and Inclusion, Installed Base, and Revenue.
Notably, Google Cloud received the highest possible score in the Obfuscation criteria. Obfuscation can help protect sensitive data, like personally identifiable information (PII), which is critical to many enterprise workflows. Cloud DLP helps customers inspect and mask this sensitive data with techniques like redaction, bucketing, and tokenization, which help strike the balance between risk and utility. This is especially crucial when dealing with unstructured or free-text workloads, in which it can be challenging to know what data to redact. More than 150 detectors combine to power Cloud DLP’s masking, which can be deployed in data migrations and business workloads like real-time data collection and processing. For Obfuscation specifically, the report mentioned that Google “takes a broad view of DLP, which includes in-line redaction of sensitive elements in unstructured data and DLP APIs that extend support to additional data types like images or other media.”
We are honored to be a Leader in The Forrester Wave™ Unstructured Data Security Platforms Q2 2021 report, and look forward to continuing to innovate and partner with you on ways to make your digital transformation journey safer as we work to become your most trusted Cloud.
A copy of the full report can be viewed here.
Case Study: When Database Choice Powers New Revenue-driving Product Features

4157
Of your peers have already read this article.
4:30 Minutes
The most insightful time you'll spend today!
Editor’s note: Streak makes a CRM add-on for Gmail, and recently adopted Cloud Spanner to take advantage of its scalability and SQL capabilities to implement a graph data model. Read on to learn about their decision, what they love about the system, and the ways in which it still needs work.]
Streak is a customer relationship management (CRM) tool built directly into Gmail. It is used for sales, marketing, hiring, and just about anything else you can think of.
We built it because out of the box, email is actually a really crummy team sharing system. By adding a layer of organization on top of email, Streak lets you add email threads directly into its spreadsheet view, making it useful as a workflow tool with capabilities including task creation, email template management, and easy data entry.
Streak has been integrated with G Suite (originally Google Apps For Your Domain) since its inception so when choosing a cloud, it made sense to colocate our server stack with Google Cloud.
Likewise, Streak was on Google App Engine from the start, and we slowly added other GCP services as the offerings improved or as our use cases became more complex.
In addition to App Engine, we use Google Kubernetes Engine to run a bunch of our compute workload, including both application servers and our offline processes like indexers and task queue consumers.
We use Cloud Dataflow for both streaming event processing and logs ETL, and BigQuery for all of our analytics queries. We use Cloud Pub/Sub for interacting with the Gmail watch API, as well as Stackdriver (logging, tracing, monitoring, errors) and OpenCensus to dig into any operational issues as they arise.
Then, on the database front, we recently started using Cloud Spanner, Google Cloud’s scalable relational database service. Before that, we stored most of our business data in Cloud Datastore, Google Cloud’s NoSQL document database.
Partially, that was historical, since Cloud Datastore was GCP’s only managed database when we wrote the Streak backend. And we’ve been very happy with how easy Cloud Datastore is to maintain. Between Google App Engine and Cloud Datastore, we’ve never had to have an explicit infrastructure on-call rotation.
But as more users rely on Streak to collaborate with larger and larger teams, we were feeling the pain of not having a fully relational database. We found ourselves having to manually join data in our application, which increased application latency and increased the time developers spent coding workarounds and debugging that complexity.
We found we needed two things out of our database: a scalable relational store and a graph store that could power next-gen Streak features. At the same time, we wanted a single database that could handle both use cases and wouldn’t increase our operational burden. This meant finding a managed service to give us more query flexibility, so we decided to give Cloud Spanner a try.
Of course, we didn’t want to migrate our existing stack to a new data platform without first testing it out (never a smart strategy). But since most of our existing data model required transactional updates with other entities, pulling out a single entity to test was challenging. We did have a feature in our pipeline that necessitated a graph data store and that was removed from our other data: our email metadata indexing system.
How your client software handles email metadata indexing can make or break the useability of a system. Think about how many times somebody forgets to reply-all or that you receive a forwarded thread with thirty emails in reverse-chronological order. Within our own inboxes, we rely on Gmail’s UI to nicely organize email threads, but that organization breaks down when working with a team or across organizational boundaries.
We decided to fix that in the Streak product by organizing metadata (i.e., headers but not message content) from users’ email by using Cloud Spanner as a graph database. Using a graph database lets us answer questions like “What are all the emails on this thread in the inboxes of everybody on my team?” and “Who on my team has previously talked with the organization that this prospect works at?”
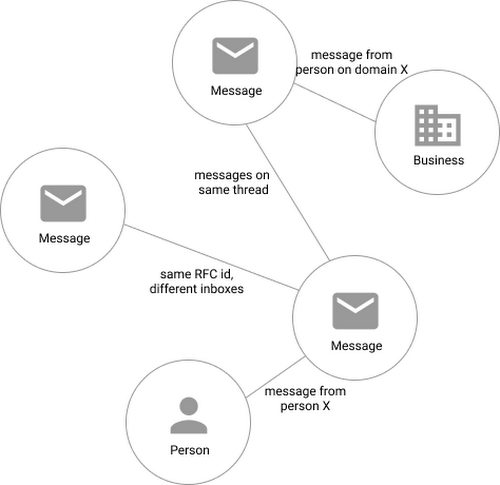
In our model, the nodes of the graph are either an email message, a person (email address) or a company (a domain). Then we have four different types of “edges”— properties by which nodes in a graph connect to one another:
- Message to message (thread): messages that are on the same thread have an edge between them. The reason we do this is because we want to show users a list of threads to answer their questions, not messages, so we need to be able to get the spanning set of messages.
- Message to message (same RFC id): A core value proposition of Streak is being able to see the “unified” version of a thread that shows each person on a team’s version of the email thread. To make sure we are getting each user’s version of a thread when we issue a query, there needs to be an edge between a message in the queryer’s inbox and the same message in their team’s inbox. In case you’re curious, Streak uses the RFC message id to determine that two messages across inboxes are actually the same.
- Email address to message: a message has an edge to an email address if it was either the from, to, cc, or bcc on the message. This edge is crucial for queries that start with: “Show me all threads between this person and our team.”
Domain to message: a message has an edge to a domain if the domain is present in any of the from, to, cc, or bcc addresses on the message. This edge is similarly used for queries that start with “Show me all threads between this company and our team.”
Using Cloud Spanner’s distributed SQL capabilities and scalability to build a graph database also let us answer the important follow-up question: “Which threads have I been granted permission to view?” And while a lot of these questions could be answered per-user by a traditional relational database, scale limitations have to be taken into consideration, especially as we plan for 10x or more data volume growth as both our user base grows and as their inboxes accumulate more emails. A graph database model is simply a better fit for Streak’s collaboration model with many-to-many mappings between users and teams, and will allow us to query the data in any number of configurations, without worrying about scale limitations or having to manually shard a relational database. Cloud Spanner gives us queryability and scalability.
Taking the Cloud Spanner plunge
With so many advantages to it, we went ahead and began building out our metadata system with Cloud Spanner as a back-end.
Adopting Cloud Spanner has been great. Here are some of the high points:
- The fast distributed queries and transactions are absolutely real. We have global indexes across our entire dataset and we haven’t had to spend very much time at all thinking about co-locating data. In particular, we only use interleaved tables for values that would be repeated fields in Cloud Datastore, and that hasn’t been a problem for us yet.
- We haven’t had any reliability problems whatsoever, despite averaging 20K writes/sec in steady state.
- Once we optimized our queries on realistic data, Cloud Spanner scaled up in a surprisingly predictable way. You need to run queries after you’ve populated data, do the explain to figure out how the query planner is executing the query, and add indexes/modify queries to make sure they’re performant.
- Compared to the hoops some traditional relational databases make you jump through, Cloud Spanner’s online schema changes and index builds are magical. There is no downtime for these operations.
Overall, the experience has been encouraging, and we’re planning to move 20 TB of existing data in Cloud Datastore to Cloud Spanner as well. We built out an ORM library for Java on top of Cloud Spanner called Ratchet and are testing a framework for dual-writing entities to both Cloud Datastore and Cloud Spanner to support the rest of the migration. We now store about 40 TB of email metadata in Cloud Spanner, which makes us a large user of Cloud Spanner.
In short, if you’re starting to outgrow your NoSQL database, and want to move to a managed SQL database, give Cloud Spanner a try. You definitely want to model out your costs and try out a proof of concept, both to see how it works on your workload and to get familiar with the quirks of the system. But you don’t need to spend much time worrying about the reliability of the product: it’s there.
What Drives Your Organization to be Data-driven?

4869
Of your peers have already read this article.
4:00 Minutes
The most insightful time you'll spend today!
Every organization has its own unique data culture and capabilities. Yet each is expected to use technology trends and solutions in the same way as everyone else. Your organization may be built on years of legacy applications, you may have developed a considerable amount of expertise and knowledge, yet you may be asked to adopt a new approach based on a technology trend. On the other hand, you may be on the other side of the spectrum, a digitally native organization built with engineering principles from scratch without legacy systems but expected to follow the same principles as process driven, established organizations. The question is, should we treat these organizations in the same way when it comes to data processing? In this series of blogs and papers this is what we are exploring: how to set up an organization from the first principles from data analyst, data engineering and data science point of view. In reality, there is no such organization that is solely driven by one of these but it is likely to be a combination of multiple types. What type of organization you become is then driven by how much you are influenced by each of these principles.
When you are considering what data processing technology encompasses, take a step back and make a strategic decision based on your key goals. This can be whether you optimize for performance, cost, reduction in operational overhead, increase in operational excellence, integration of new analytical and machine learning approaches. Or perhaps you’re looking to leverage existing employees’ skills while meeting all your data governance and regulatory requirements. We will be exploring these different themes and will focus on how they guide your decision-making process. You may be coming from technologies which are solving some of the past problems and some of the terminologies may be more familiar, however they don’t scale your capabilities. There is also the opportunity cost of prioritizing legacy and new issues that arise from a transformation effort, and as a result your new initiative can set you further behind on your core business while you play catch up to an ever changing technology landscape.
Data value chain
The key for any ingestion and transformation tool is to extract data from a source and start acting on it. The ultimate goal is to reduce the complexity and increase the timeliness of the data. Without data, it is impossible to create a data driven organization and act on the insights. As a result, data needs to be transformed, enriched, joined with other data sources, and aggregated to make better decisions. In other words, insights on good timely data mean good decisions.
While deciding on the data ingestion pipeline, one of the best approaches is to look into the volume of data, the velocity of the data, and type of data that is arriving. Other considerations include the number of different data sources you are managing, whether you need to scale to thousands of sources using generic pipelines, whether you want to create one generic pipeline but then apply data quality rules and governance. ETL tools are ideal for this use case as generic pipelines can be written and then parameterized.
On the other hand, consider the data source. Can the data be directly ingested without transforming and formatting the data? If the data does not need to be transformed and can be ingested directly into the data warehouse as a managed solution. This not only reduces the operational costs but also allows for more timely data delivery. If the data is coming in through an unstructured format such as XML or in a format such as EBCDIC and needs to be transformed and formatted, then a tool with ETL Capabilities can be used depending on the speed of the data arrival.
It is also important to understand the speed and time of arrival of the data. Think about your SLAs and time durations/windows that are relevant for your data ingestion plans. This would not only drive the ingestion profiles but would also dictate which framework to use. As discussed above, velocity requirements would drive the decision-making process.
Type of Organization
Different organizations can be successful by employing different strategies based on the talent that they have. Just like in sports, each team plays with a different strategy with the ultimate goal of winning.
Organizations often need to decide on what’s the best strategy to take in respect to data ingestion and processing – whether you need to hire an expensive group of data engineers, or exploit your data wizards and analysts to enrich and transform data that can be acted on, or whether it would be more realistic to train the current workforce to do more functional/high value work rather than to focus on building generally understood and available foundational pieces.
On the other hand, the transformation part of ETL pipelines as we know it, dictates where the load will be. All of these are made a reality in the cloud native world where data can be enriched, aggregated, and joined. Loading data into a powerful and modern data warehouse means that you can already join and enrich the data using ELT. Consequently, ETL isn’t really needed in its strict terms anymore if the data can be loaded directly into the data warehouse.
All of the above was not possible in the traditional, siloed, and static data warehouses and data ecosystems whereby systems would not talk to each other or there were capacity constraints in respect to both storing and processing the data in the expensive Data Warehouse. This is no longer the case in the BigQuery world as storage is now cheap and transformations are now much more capable without constraints of virtual appliances.
If your organization is already heavily invested into an ETL tool, one option is to use them to load BigQuery and transform the data initially within the ETL tool. Once the as-is and to-be are verified to be matching, then with the improved knowledge and expertise one can start moving workloads into BigQuery SQL, and effectively do ELT.
Furthermore, if your organization is coming from a more traditional data warehouse that extensively relies on stored procedures and scripting, then the question that one may ask is, do I continue leveraging these skills and expertise and use these capabilities that are also provided in BigQuery? ELT with BigQuery is more natural, similar to what’s already in Teradata BTEQ, Oracle PL/SQL but migrating from ETL to ELT requires changes. This change then enables exploiting streaming use cases, such as real-time use cases in retail. This is because there is no preceding step before data is loaded and made available.
Organizations can be broadly classified under 3 types as Data Analyst Driven, Data Engineering driven, and Blended organization. We will be covering a Data Science driven organization within the Blended category.
Data Analyst Driven
Analysts understand the business and are used to using SQL/spreadsheets. Allowing them to do advanced analytics through interfaces that they are accustomed to enables scaling. As a result, easy to use ETL tooling to bring data quickly into the target system becomes a key driver. Ingesting data directly from a source or staging area then also becomes critical as it allows analysts to exploit their key skills using ELT and increases timeliness of the data. This is commonplace with traditional EDWs and realized by extended capabilities of using Stored Procedures and Scripting. Data is enriched, transformed, and cleansed using SQL and ETL tools act as the orchestration tools.
The capabilities brought by cloud computing on separation of data and computation changes the face of the EDW as well. Rather than creating complex ingestion pipelines, the role of the ingestion becomes, bringing data close to the cloud, staging on a storage bucket or on a messaging system before being ingested into the cloud EDW. This then releases data analysts to focus on looking into data insights using tools and interfaces that they are accustomed to.
Data Engineering / Data Science Driven
Building complex data engineering pipelines is expensive but enables increased capabilities. This allows creating repeatable processes and scaling the number of sources. Once complemented with cloud it enables agile data processing methodologies. On the other hand, data science organizations allow carrying out experiments and producing applications that work for specific use cases but are not often productionised or generalized.
Real-time analytics enables immediate responses and there are specific use cases where low latency anomaly detection applications are required to run. In other words, business requirements would be such that it has to be acted upon as the data arrives on the fly. Processing this type of data or application requires transformation done outside of the target.
All the above usually requires custom applications or state-of-the-art tooling which is achieved by organizations that excel with their engineering capabilities. In reality, there are very few organizations that can be truly engineering organizations. Many fall into what we call here as the blended organization.
Blended org
The above classification can be used on tool selection for each project. For example, rather than choosing a single tool, choose the right tool for the right workload, because this would reduce operational cost, license cost and use the best of the tools available. Let the deciding factor be driven by business requirements: each business unit or team would know the applications they need to connect with to get valuable business insights. This coupled with the data maturity of the organization would be the key to making sure the right data processing tool would be the right fit.
In reality, you are likely to be somewhere on a spectrum. Digital native organizations are likely to be closer to being engineering driven, due to their culture and business that they are in. However, brick and mortar organizations would be closer to being analyst driven due to the significant number of legacy systems and processes they possess. These organizations are either considering or working toward digital transformation with an aspiration of having a data engineering / software engineering culture like Google.
The blended organization with strong skills around data engineering, would have built the platform and built frameworks, to increase reusable patterns would increase productivity and then reduce costs. Data engineers focus on running Spark on Kubernetes whereas infrastructure engineers focus on container work. This in turn provides unparalleled capabilities as application developers focus on the data pipelines and even the underlying technologies or platforms changes code stays the same. As a result, security issues, latency requirements, cost demands and portability are addressed at multiple layers.
Conclusion – What type of organization are you?
Often an organization’s infrastructure is not flexible enough to react to a fast changing technological landscape. Whether you are part of an organization which is engineering driven or analyst driven, organizations frequently look at technical requirements that inform which architecture to implement. But a key, and frequently overlooked, component needed to truly become a data-driven organization is the impact of the architecture on your data users. When you take into account the responsibilities, skill sets, and trust of your data users, you can create the right data platform to meet the needs of your IT department as well as your business.
To become a truly data-driven organization, the first step is to design and implement an analytics data platform that meets your technical and business needs. The reality is that each organization is different and has a different culture, different skills, and capabilities. Key is to leverage its strengths to stay competitive while adopting new technologies when it is needed and as it fits to your organization.
To learn more about the elements of how to build an analytics data platform depending on the organization you are, read our paper here.
Google Cloud Tools Help U.S. Forest Department Generate Years of Insights into Earth’s Natural Resources

5007
Of your peers have already read this article.
3:00 Minutes
The most insightful time you'll spend today!
For 117 years, the U.S. Department of Agriculture’s Forest Service has been a steward of America’s forests, grasslands, and waterways. It directly manages 193 million acres and supports sustainable management on a total of 500 million acres of private, state, and tribal lands. Its impact reaches far beyond even that, offering its research and learning freely to the world.
At Google, we’re big admirers of the Forest Service’s mission. So we were thrilled to learn in 2011 that its scientists were using Google Earth Engine, our planetary-scale platform for Earth Science data and analysis, to aid its research, understanding, and effectiveness. In the years since, Google has worked with the Forest Service to meet its unique requirements for visual information about the planet. Using both historical and current data, the Forest Service built new products, workflows, and tools that help more effectively and sustainably manage our natural resources. The Forest Service also uses Earth Engine and Google Cloud to study the effects of climate change, forest fires, insects and disease, helping them create new insights and strategies.
Besides gaining newfound depths of insight, the Forest Service has also sped up its research dramatically, enabling everyone to do more. Using Google Cloud and Earth Engine, the Forest Service reduced the time it took to analyze 10 years worth of land-cover changes from three months to just one hour, using just 100 lines of code. The agency built new models for coping with change, then mapped these changes over time, in its Landscape Change Monitoring System (LCMS) project.
Emergency responders can now work better on new threats that arise after wildfires, hurricanes, and other natural disasters. Forest health specialists can detect and monitor the impacts of invasive insects, diseases, and drought. More Forest Service personnel can use new tools and products within Earth Engine, thanks to numerous training and outreach sessions within the Forest Service.
Researchers elsewhere also benefited when the Forest Service created new toolkits, and posted them to GitHub for public use. For example, there’s geeViz, a repository of Google Earth Engine Python code modules useful for general data processing, analysis, and visualization.
This is only the start. Recently, the Forest Service started using Google Cloud’s processing and analysis tools for projects like California’s Wildfire and Forest Resilience Action Plan. Forest Service researchers also use Google Cloud to better understand ecological conditions across landscapes in projects like Fuelcast, which provides actionable intelligence for rangeland managers, fire specialists, and growers, and the Scenario Investment Planning Platform for modeling local and national land management scenarios.
The Forest Service is a pioneer in building technology to help us better understand and care for our planet. With more frequent imaging, rich satellite data sets, and sophisticated database and computation systems, we can view and model the Earth as a large-scale dynamic system.
We are honored and excited to respond to the unique set of requirements of the scientists, engineers, rangers, and firefighters of the USFS, and look forward to years of learning about — and better caring for — our most precious resources.
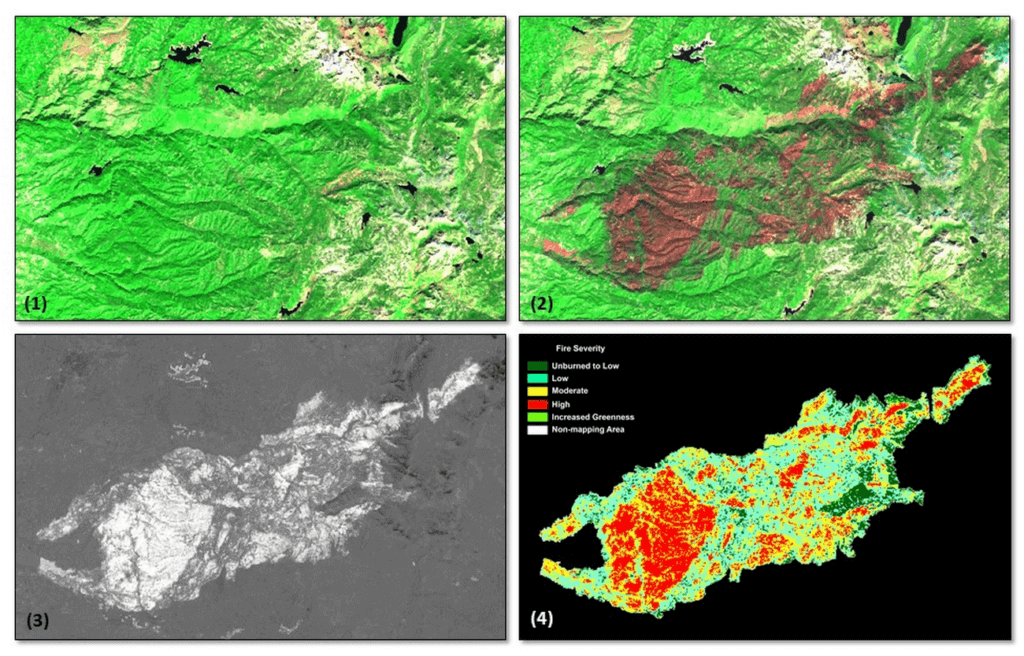
*Image 1: The USDA Forest Service (USFS) Geospatial Technology and Applications Center (GTAC) uses science-based remote sensing methods to characterize vegetation and soil condition after wildland fire events. The results are used to facilitate emergency assessments to support hazard mitigation, to inform post-fire restoration planning, and to support the monitoring of national fire policy effectiveness. GTAC currently conducts these mapping efforts using long-established geospatial workflows. However, GTAC has adapted its post-fire mapping and assessment workflows to work within Google Earth Engine (GEE) to accommodate the needs of other users in the USFS. The spatially and temporally comprehensive coverage of moderate resolution multispectral data sources (e.g., Landsat, Sentinel 2) and analytical power provided by GEE allows users to create geospatial burn severity products quickly and easily. Box 1 shows a pre-fire Sentinel-2 false color composite image. Box 2 shows a post-fire Sentinel-2 false color composite image with the fire scar apparent in reddish brown. Box 3 shows a differenced Normalized Burn Ratio (dNBR) image showing the change between the pre- and post-fire images in Boxes 1 and 2. Box 4 shows a thresholded dNBR image of the burned area with four classes of burn severity (unburned to high severity), which is the final output delivered to forest managers.
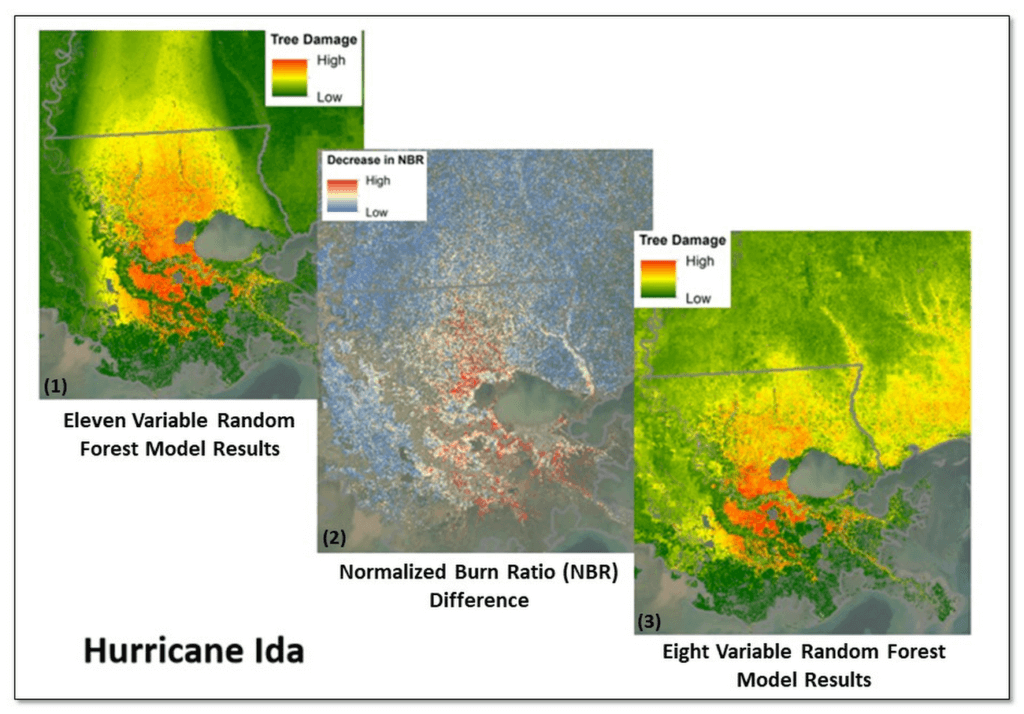
*Image 2: Leveraging Google Earth Engine (GEE), the USDA Forest Service (USFS) Geospatial Technology and Applications Center (GTAC) and USFS Region 8, developed the Tree Structure Damage Impact Predictive (TreeS-DIP) modeling approach to predict wind damage to trees resulting from large hurricane events and produce spatial products across the landscape. TreeS-DIP results become available within 48 hours following landfall of a large storm event to allow allocation of ground resources to the field for strategic planning and management. Boxes 1 and 3 above show TreeS-DIP modeled outputs with varying data inputs and parameters. Box 2 shows changes in greenness (Normalized Burn Ratio; NBR) that was measured with GEE during the recovery from Hurricane Ida and is shown as a visual comparison to the rapidly available products from TreeS-DIP.
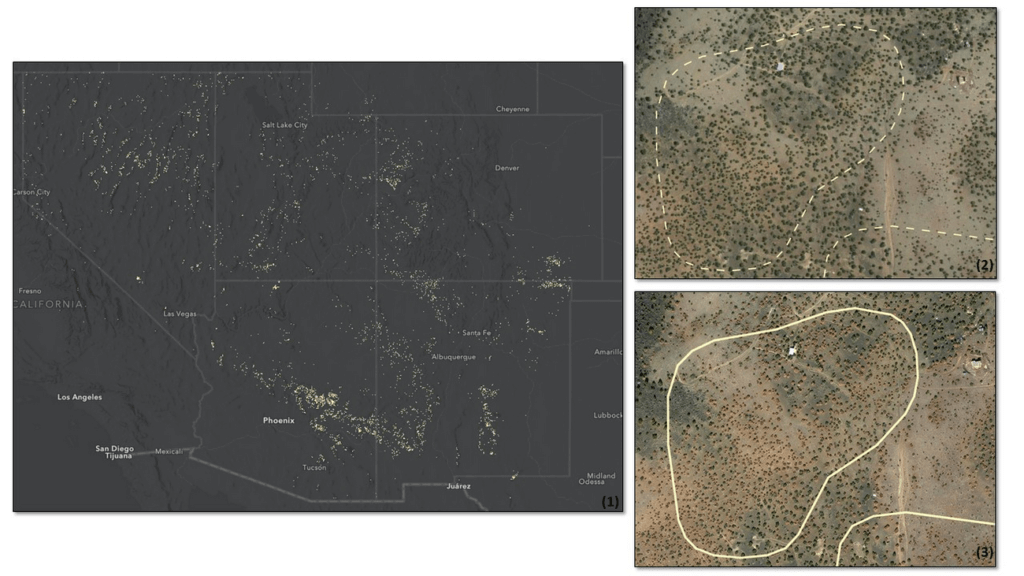
*Image 3: Severe drought conditions across the American West prompted concern about the health and status of pinyon-juniper woodlands, a vast and unique ecosystem. In a cooperative project between the USDA Forest Service (USFS) Geospatial Technology and Applications Center (GTAC) and Forest Health Protection (FHP), Google Earth Engine (GEE) was used to map pinyon pine and juniper mortality across 10 Western US States. The outputs are now being used to plan for future work including on-the-ground efforts, high-resolution imagery acquisitions, aerial surveys, in-depth mortality modeling, and planning for 2022 field season work.
Box 1 contains remote sensing change detection outputs (in white) generated with GEE, showing pinyon-juniper decline across the Southwestern US. Box 2 shows NAIP imagery from 2017 with, with box 3 showing NAIP imagery from 2021. NAIP imagery from these years shows trees changing from healthy and green in 2017 to brown and dying in 2021. In addition, box 2 and box 3 show change detection outputs from Box 1 for a location outside of Flagstaff, AZ converted to polygons (in white). The polygon in box 2 is displayed as a dashed line to serve as a reference, while the solid line in box 3 shows the measured change in 2021. Converting rasters to polygons allows the data to be easily used on tablet computers, as well as the ability to add information and photographs from field visits.
More Relevant Stories for Your Company

Gartner Positions Google as the Leader for Cloud Database Management Systems!
We are thrilled that Gartner has positioned Google as a Leader for the second year in a row in the 2021 Gartner® Magic Quadrant™ for Cloud Database Management Systems (DBMS). We believe the report evaluated Google's unified capabilities across both transactional and analytical use cases, and showcases innovation progress in areas like

How Kinguin Notched Up Shopping Experience with Google Recommendations AI
Over 2.14 billion people worldwide are expected to buy online this year, according to Statista. Online retail sales will account for 22% of all purchases by 2023. But in a competitive retail landscape, positive interactions can mean the difference between a sale and an abandoned shopping cart. One of the leading global

Daffodil Software Saves Hundreds of Hours Managing Databases with Google Cloud SQL
Daffodil Software is an India-based information technology services company with 180 employees and satellite offices in the US, Singapore, and the United Arab Emirates. Its product: A suite of web-based applications, including a business customer relationship management (CRM) program and an enterprise resource planning (ERP) app for schools. Daffodil’s Challenge
Predictive Model Built on Google Cloud Helps You Get a 7-day Mosquito Forecast Report!
Mosquitoes aren’t just the peskiest creatures on Earth; they infect more than 700 million people a year with dangerous diseases like Zika, Malaria, Dengue Fever, and Yellow Fever. Prevention is the best protection, and stopping mosquito bites before they happen is a critical step. SC Johnson—a leading developer and manufacturer
