





How to Use Data to Tell Compelling Stories and Win New Deals

4503
Of your peers have already read this article.
2:30 Minutes
The most insightful time you'll spend today!
A picture is worth a thousand words–especially at work. The data we present every day is what helps us drive decision-making in the workplace. But understanding how to visualize a story can be difficult if you’re left staring at numbers sitting stagnant in rows or columns within a spreadsheet.
This is where visualization with charts and reports becomes critical. Let’s say your team needs to understand global sales trends. If you have a waterfall chart that shows regional contribution to total revenue or a scatter plot that shows individual salesperson performance, it’s much easier to spot patterns, draw insights, and make informed recommendations. The same goes for analyzing travel expenses.
In Google Sheets, we have several built-in tools that make it easy to create and share useful charts and reports so that you can quickly visualize data (without having to leave the spreadsheet). Follow these tips to showcase your data in Sheets and influence decisions.
1. Pick the most compelling way to visualize your data.
Perhaps just as important as the data you reference is the way in which you present it. Charts are the basic building blocks for data visualization and can take many forms–from bar charts to line graphs to scatter plots. There are more than 30 chart types to choose from in Sheets, and we’re constantly adding more ways to express your data. Here are a few we recommend:
- To draw attention to a key metric or KPI, try the brand new scorecard chart. For example, you can show the total sales number for your organization’s top-selling product, and even call out percentage increase or decrease over time.
- To illustrate how values add to or subtract from a starting value, try a waterfall chart. For example, show how your product sales and restocking efforts led to a net decrease in inventory from last quarter to this quarter.
- To represent different data series using lines and bars, try a combo chart. For example, you can show revenue in bars and profit margins in a line across the same chart, giving you a more complete picture of your organization’s financial health.
If you’re unsure how to best present your data, Google’s built-in machine learning can help you choose the right visualization—Sheets intelligently suggests charts for you. Simply highlight data you would like to visualize, click the chart button, and then select one of the suggested charts. According to our internal data, more than 1.5 million charts are inserted into Sheets each week based on intelligent recommendations.
Note: Once you have a chart inserted into Sheets, you may want to control the look and feel. We recently made it possible to click directly on data labels, chart titles, or legends and drag to reposition them. You can also easily delete these elements using the delete or backspace keys, if you want to make other data points stand out. We’re exploring even more ways to customize charts—stay tuned.
2. Be sure to tell a complete story.
Data really comes to life when you put several charts and tables together into a report or dashboard. Going back to our sales data example, an individual line graph showing revenue over time gives you quick insight into the general sales trend for your organization (hopefully, up and to the right!). But when you surround that line graph with other charts and tables–like a pie chart showing total revenue breakdown by-product, or a stacked bar chart comparing revenue driven by each sales team–you can tell a more complete story.
If you do build reports featuring multiple charts, there are ways that Sheets can help you organize and format them more quickly. Earlier this year, we made it easier to align, size, and position objects within your spreadsheets so you can quickly put several charts together. We also recently added themes, which let you alter the look and feel of an entire spreadsheet—including charts, pivot tables, and cells—to ensure a consistent look and feel across the elements in your report. To apply a preset theme, select Format > Theme and choose the right option. Faster formatting can mean faster reporting.
Google Cloud CCAI’s Support for the Public Sector Soars during the Pandemic

5274
Of your peers have already read this article.
2:00 Minutes
The most insightful time you'll spend today!
Scaling Virtual Support in the Pandemic Era: The AI Connection
Since the early days of the pandemic, we’ve partnered with government organizations and academic institutions to serve communities at scale with Contact Center Artificial Intelligence (CCAI). I sat down with Bill MacKenzie, IT liaison for the Upper Grand School District in Ontario, and Marco Palermo, director of digital government and modernization, to discuss how they embraced CCAI to introduce scalable service delivery to residents and students alike. I’m sharing more on their stories below, and for the full overview, check out our Google Cloud Public Sector Summit session, Scaling Virtual Support in the Pandemic Era: The AI Connection.
Upper Grand School District: Answering questions with speed and accuracy
Bill MacKenzie described the Upper Grand School District’s struggles at the beginning of the pandemic, particularly helping parents with IT issues. The staff-oriented help desk was not equipped to assist parents trying to securely login for students as young as kindergarten. Without sufficient support for parents, the District was struggling to handle thousands of phone calls a day.
To alleviate the manual strain, they turned to Quantiphi, a Google Cloud partner, to implement Google Cloud Dialogflow. They were fully functional within a few weeks. The new website provided real-time responses as well as clear documentation to help parents get up and running quickly.
“In the first 10 days, we had over 5,000 hits, and the accuracy rate was 92%,” MacKenzie said.
The district doesn’t know what the future holds, but now that they have been through the process, they are confident they now understand how to create their own bots to meet critical needs.
City of Toronto: Getting critical information to the community
Marco Palermo explained how the city of Toronto was facing a very rapid and fluid situation at the beginning of the pandemic. Getting information to constituents was extremely important, and they needed alternative channels to deliver that information.
Toronto has been committed to workforce equity and inclusivity in order to best represent the diversity of its residents. As a result, solutions had to be accessible to all. The bot handled 25,330 unique users and addressed 20,174 total questions with an 80% accurate response rate in the first four months. It’s been a huge success for the city, with plans to expand its capabilities.
Personalized response to the pandemic challenge
I noted that even before the pandemic, government leaders were asking for a way to provide more flexible personal experiences and better support outside of normal business hours. Around 60% of constituents want more self-service options and 75% would happily interact with digital resources if they could get the answers they needed.
Google Cloud CCAI addresses these needs with a single core of intelligence that provides a consistently high-quality conversational experience—human or virtual—across all channels and platforms. It can be deployed on legacy infrastructure without upgrades in an average of two weeks.
CCAI operates with a conversational core that centralizes the ability to talk, understand, and interact, orchestrating high-quality conversations at scale. It provides services in three different ways:
- Virtual Agent AI allows natural conversation with customers to identify and address their issues effectively
- Agent Assist AI helps human agents by providing real-time turn-by-turn guidance so they can better serve constituents
- Insight AI determines metrics and trends in real-time to enable faster and more accurate insights
CCAI provides consistency across every application. It can go off-script when answering complex questions, adjusting human conversation with the capacity to handle unexpected stops and starts, odd word choices, or implied meanings. It can also handle multiple use cases for the customer, such as taking payments, updating information, providing information, and more. By allowing agencies to automate routine tasks and reduce the amount of time employees need to dedicate to answering calls, the solution created cost savings for the agency.
Explore more on this session by visiting the Public Sector Summit on-demand video.
Google Cloud Partnership Helps Lowe’s SRE Team Achieve 20X More Releases Per Month

5543
Of your peers have already read this article.
2:00 Minutes
The most insightful time you'll spend today!
Editor’s note: Today we hear from the Lowe’s SRE team. They share about how they have been able to increase the number of releases they can support by adopting Google’s Site Reliability Engineering (SRE) framework and leveraging their partnership with Google Cloud.
At Lowe’s, we’ve made significant progress in our multiyear technology transformation. To modernize our systems and build new capabilities for our customers and associates, we leverage Google’s SRE framework and Google Cloud, which helps us meet their needs faster and more effectively. With these efforts, we’ve been able to go from one release every two weeks to 20+ releases daily—about 20X more releases per month.
Our SRE transformation didn’t happen overnight, though. Every step along the way brought some challenges. But looking back, we are excited to see how much we have accomplished for our customers as a result.
Back in 2018, before adopting SRE practices, we were more reactive than proactive, following an “eyes on glass” approach. On-call structures and incident management efficiency were not at optimal levels with too many repetitive and manual tasks, resulting in operational toil. Production concerns were not surfaced into the product roadmap, which resulted in delays in making fixes.
Bootstrapping SRE at Lowe’s
As we moved from on-prem to Google Cloud, we decided to move from a monolithic- to microservices-based architecture. And to better manage this new architecture, we embarked on an SRE journey.
Then as COVID-19 hit, we really had to accelerate this journey as customers increasingly moved to online ordering and delivery to meet their Total Home Improvement needs. To do so, we followed four key principles that allowed us to meet changing customer needs quickly and release fast and reliably.
- Automate away toil
As we moved from traditional Ops to an SRE ecosystem, our biggest opportunity was reducing toil, so that engineers can spend time on activities that drive business impact and customer outcomes. We think of toil as work that is manual, repetitive, tactical, devoid of enduring value—but automatable. So, to tackle toil, we focused on automating away the need for manual intervention. As an example, we made sure engineers were not the first point of contact for any alert. Any triage or resolution that an engineer can perform, a machine can be trained to do the same. We used supervised and unsupervised learning techniques to automate our toil. With a long-term goal of “no toil,” our SREs work on identifying and reducing toil to a manageable level across the organization. - Engineer alignment through roadmaps
Our goal is to maximize the engineering velocity of developer teams while keeping products reliable. We want an engagement model where product, SRE and development teams are closely aligned. A key way we’ve been able to create this alignment is by having our SREs embedded into domain and product teams. Each domain has an SRE, who is involved at the beginning stages of product development to ensure that the domain stakeholders are in alignment with the SRE initiatives. As such, SREs are able to improve the reliability, performance, scalability and launch velocity of the services throughout all phases of the service lifecycle. - Adopt one-touch releases
Our path to production used to contain many manual steps and validations, slowing the rate at which we released features. Additionally, we used to bulk all our releases together to deploy at once, which increased the risk of failure and created a longer feedback loop from production. To tackle this with an SRE mindset, we created a one-touch release process in which SREs review the product team’s pull requests. When approved, this triggers a DevSecOps pipeline that deploys the approved changes to production securely. This process created a safe, reliable and sustainable continuous delivery pipeline with quick feedback loops. Striking the right balance between speed, innovation and stability, we were able to increase our releases exponentially for the year, taking less than 30 minutes per release to deliver quality code, including various automated quality checks and processes, all in just one click. - Embrace capacity planning
To ensure our services have enough spare capacity to handle any surge in traffic patterns, our SREs emphasize capacity planning, making recommended capacity changes in the continuous delivery (CD) pipeline. They constantly monitor performance to make sure the service is robust, stable and available. And when there’s a sudden surge beyond the forecasted volume, SREs change the capacity on demand and document changes for the performance and domain teams.
Capacity planning is especially important for us during peak holiday times such as Black Friday and Cyber Monday (BFCM). We lay out our SRE stability plan three months in advance and surface into the domain team’s product roadmap. This way development teams are able to allocate sufficient engineering time to reliability. We do performance testing to ensure the environment is able to sustain increased load over long periods of time and also handle sudden surges in traffic. We also do region failover testing at a global scale to validate the automatic failover duration of service level agreements (SLAs), SRE and domain readiness. Additionally, we conduct Black Friday and Cyber Monday-specific destructive testing to validate customer experience, reliability and more.
Google Cloud’s Black Friday and Cyber Monday white-glove service played a key role in ensuring our success in both BFCM 2019 and BFCM 2020. This service included on-site visits from Google’s Customer Reliability Engineering (CRE) team who reviewed Lowe’s web architecture, capacity planning, operations practices for event risks, and presented workshops on topics such as incident response best practices.
Looking ahead
There is always room for improvement, and at Lowe’s we aim to continuously improve our SRE practices. One thing that has worked well for us, which we plan to continue, has been our road shows, where senior SRE leads present to other SREs and application domain teams on the latest SRE principles and best practices, and to get input in real-time from them.
Google’s tools and methodology have played an instrumental role in helping reshape our SRE practices and better serve our customers. We look forward to building on the momentum and partnership as we continue our SRE journey at Lowe’s.
If you want to learn more about how to adopt SRE best practices on Google Cloud, check out our documentation. If you want to learn more about Google SRE, visit our website. Stay tuned for the next blogs with Lowe’s discussing how they trained their engineering talent to adopt SRE practices and tooling, and how they improved MTTR using SRE principles.
Accuracy and Real-time Updates with Google Maps’ On-Demand Rides and Delivery Solution Impacts CX

5646
Of your peers have already read this article.
3:00 Minutes
The most insightful time you'll spend today!
Last year we launched our on-demand rides and delivery solution to help businesses improve operations as well as transform the driver and customer journey from booking to arrival or delivery. When it comes to on-demand rides and deliveries, every minute matters. When users book a ride or order food, they want a seamless experience and real-time accurate updates. Today, we’re taking a closer look into data quality improvements for location, time and distance accuracy, and motorbike routes.
Machine learning helps drive location accuracy
Location accuracy stands at the base of our customers’ operation. The location signals that are coming from mobile devices can sometimes be off for various reasons and a driver’s location can get stuck, or jump around.
Recently we developed mechanisms in our fleet management product that can take in multiple location signals and determine the most reliable location to use for a given vehicle. With that, we noticed drastic improvements:
- Eliminated long periods of location ‘stuckness’ almost completely; a vehicle is considered ‘stuck’ when we think it’s moving but the measured location is not
- Reduced the jumpiness of the location signal by 52%-86%: ‘jumpiness’ is when a vehicle shows a sudden and usually drastic change in location. A jump is determined to exist when the speed the vehicle had to go at in order to cover the distance it did is unrealistic
- Reduced the average jump distance by 44%-86% : ‘jump distance’ is the distance between two consecutive location pings when we determined a ‘location jump’ has occurred.
Dunzo, a local e-commerce platform in India, explains how integrating the order tracking capability within Google Maps Platform’s On Demand Rides and Delivery solution has helped reduce support calls by 90%. The out-of-the-box solution helped Dunzo’s motorbike delivery partners with updating location sync to reduce stuckness and jumpiness as well as deliver premium user experiences.
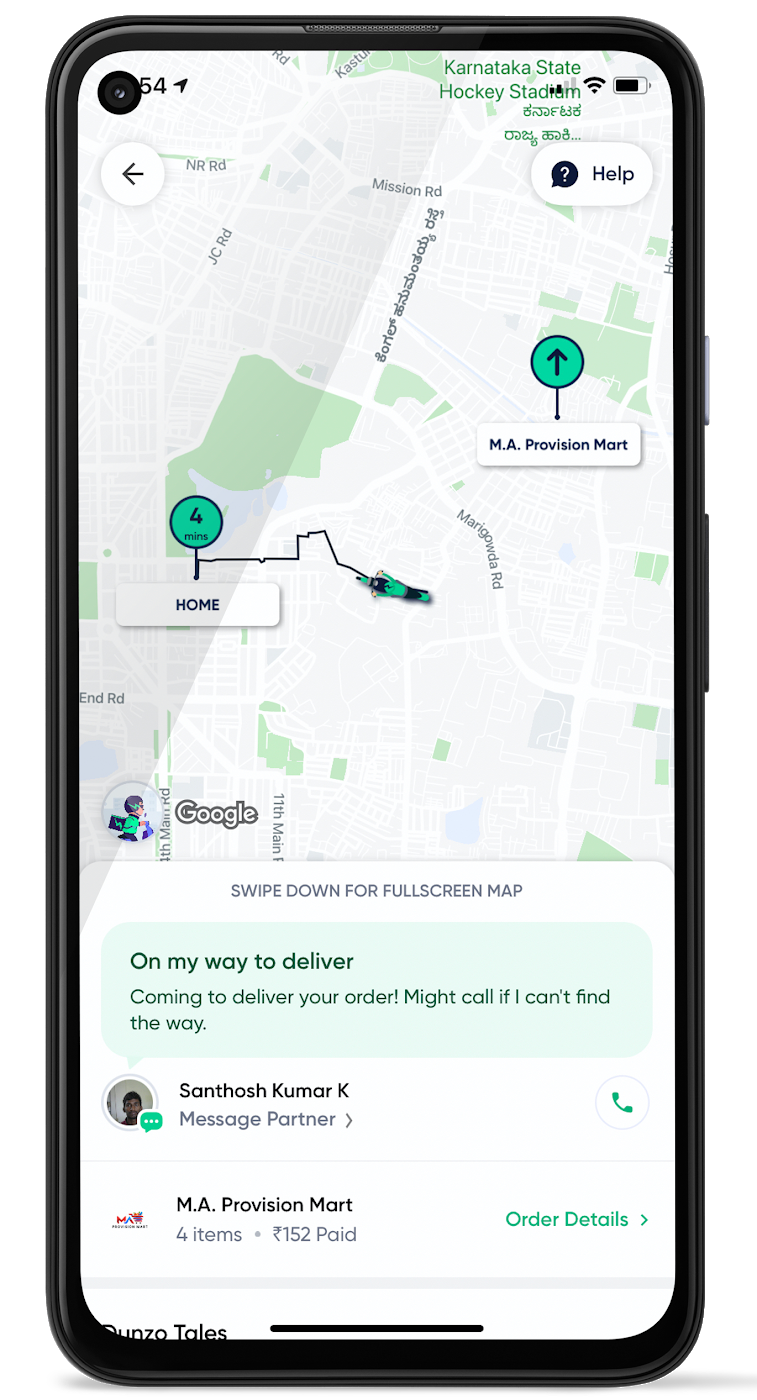
When the vehicle location is more reliable, the dispatch decision is of higher quality, meaning there is a higher chance you will be able to make the optimal decision. This can lead to less wait time for consumers, increased driver happiness and fewer cancellations.
Improvements in ETA accuracy in motorbike routes
In many geographic areas, road space is limited and car ownership is prohibitively expensive so motorbike is a prominent transportation mode. Motorbike mapping requires unique routing, ETA models, and navigation capabilities. Improvements in motorbike routing and ETA estimation have enabled customers like Gojek to offer better overall services, even in geographies with poor wifi or missing roads.
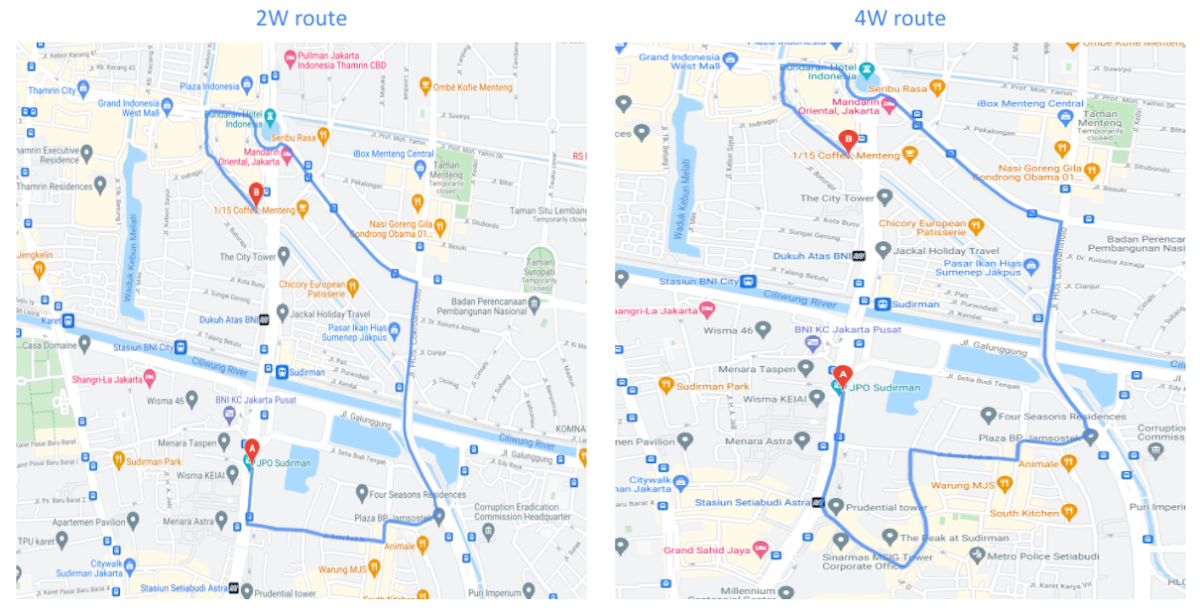
Recently, we further improved ETA outcomes by developing new machine learning models trained specifically for motorbikes. These models help our systems account for differences in congestion and traffic flow that arise in different regions and scenarios.
Globally, we measured an ~8% improvement in ETA accuracy for riders in the general public, and a ~6% improvement in on-demand rides and deliveries ETA accuracy. In this on-demand economy, where consumers are accustomed to real-time trip and order progress, these improvements will significantly improve their experience.
We will continue to innovate on both our car and motorbike on-demand rides and deliveries capabilities based on customer demand and requirements. We are committed to the success of our customers by building a seamless experience for all parties—consumers, drivers, and fleet operators—in the rides and deliveries journey.
For more information on Google Maps Platform, visit our website.
How a Former Refugee is Using Tech to Transform the Lives of Women in Afghanistan

4389
Of your peers have already read this article.
4:15 Minutes
The most insightful time you'll spend today!
Born in Iran as a refugee during the Soviet invasion of Afghanistan, I understand the challenges many people face there to get access to formal education. I was one of eight children in a progressive, yet financially limited, family. We left everything behind in Herat to move to a new country. To make ends meet, my mother sold handmade clothing. She invested what little she earned in my education, which made it possible for me to finish high school.
While opportunities for education in Afghanistan have increased over the past few decades, there are still many barriers that stand in the way of education for Afghan women—familial expectations, socioeconomic circumstances, cultural stigmas, societal norms and even safety issues. These circumstances make it challenging for women to find work and explain why only 19 percent participate in the workforce, 84 percent lack formal education and are often illiterate, and just 2 percent have access to higher education.
2001 marked the fall of the Taliban in Afghanistan, and many Afghan families, including my own, found hope in their motherland again. The next year, I returned to Herat. Seeing my peers —women just like me with so much potential—I felt compelled to do something. But I knew that in order to help others, I first needed to further my own education. I earned a bachelor’s degree in Computer Science, and later a Master’s degree from the Technical University of Berlin in Germany.
When I returned to Afghanistan after school, I hoped to share my newly-minted tech skills with Herat women by teaching at the local university. At the time, few women were participating in the public workforce and there were still many extremist, conservative views in the country. I was vocal about inequalities and faced backlash from the community; because of these threats, I came to the United States as an asylum seeker in 2012.
After arriving in the United States, I was inspired to start Code to Inspire, the first coding school for girls in Afghanistan between the ages of 15 and 25 that provides free after school education in gaming, web development, graphic design, mobile applications and full stack development. Our goal is to empower women with the skills they need to program so that they can drive change in their communities and gain equal access to opportunities and financial independence.
Determined to make this coding school happen, I found myself faced with an interesting obstacle: how could I build an education center in Afghanistan without ever leaving the US?
To make this possible, I turned to technology—just as I had hoped my future students would. I took a side job teaching Farsi to pay my bills, and built the blueprint for Code to Inspire from a laptop in Brooklyn. I managed everything from my computer working from cafes in New York: fundraising, shipping equipment, recruiting mentors, registering applicants, and developing the curriculum.
To move things forward day-to-day, I use G Suite to communicate and collaborate with my team. I use Hangouts Meet to connect with students remotely during weekly calls and monthly check-ins. We use Google Docs, Sheets and Slides to create essential documents and keep track of our operations. We even used Slides for our first pitch deck, which I shared with my board to get their feedback. This power and connectivity enabled a refugee to make her dream come true, and built up the digital literacy of the women I was working with back home!
Since opening its doors, 150 girls have studied with us, and the students have created so many interesting projects. One inspiring example is the popular mobile game, Afghan Hero Girl, which has taken off in Afghanistan and abroad, and was even recognized by the local government. The girls developed the game to show a female protagonist dressed in traditional Afghan garb, who undergoes obstacles that are relatable to them.
Over 50 women have graduated from Code to Inspire, and 20 have secured remote full-time employment and freelance projects. Many of these women are even out-earning their male relatives who have become huge supporters of the program.
By 2030, we hope to open two additional schools in Kabul and Mazar that can serve up to 500 girls and provide employment opportunities within six months of graduation. From the ruins of a shattered nation and shattered lives of refugees can come treasure, if we know where to find it. For me, the girls in Afghanistan are the treasure and investing in their education is the future of a peaceful Afghanistan.
Google’s Latest ‘Carbon Footprint’ can Flag Users about Carbon Emission Levels from their Cloud Usage

7090
Of your peers have already read this article.
4:00 Minutes
The most insightful time you'll spend today!
Google Cloud is proud to support our customers with the cleanest cloud in the industry. For the past four years, we’ve matched 100% of our electricity use with renewable energy purchases, and we were the first company of our size to commit going even further by running on carbon-free energy 24/7 by 2030. As we work to achieve 24/7 carbon-free energy, we help you take immediate action to decarbonize your digital applications and infrastructure. We’re also working with our customers across every industry to develop new solutions for the unique climate change challenges that organizations face. Today, we’re excited to expand our portfolio of carbon-free solutions and announce new partnerships that will help every company build a more sustainable future.
First, we’re launching Carbon Footprint, a new product that provides customers with the gross carbon emissions associated with their Google Cloud Platform usage. Now available to every GCP user for free in the Cloud Console, this tool helps you measure, track and report on the gross carbon emissions associated with the electricity of your cloud usage. Of course, the net operational emissions associated with your Google Cloud usage is still zero. With growing requirements for Environmental Social and Governance (ESG) reporting, companies are looking for ways to show their employees, boards and customers their progress against climate targets. Using Carbon Footprint, you have access to the gross energy related emissions data you need for internal carbon inventories and external carbon disclosures, with one click.
Built in collaboration with customers like Atos, Etsy, HSBC, L’Oréal, Salesforce, Thoughtworks and Twitter, our Carbon Footprint reporting introduces a new standard of transparency to support you in meeting your climate goals. You can monitor your gross cloud emissions over time, by project, by product and by region, giving IT teams and developers metrics that can help them reduce their carbon footprint. Our detailed calculation methodology is published so that auditors and reporting teams can verify that their cloud emissions data meets GHG Protocol guidance.

“The power of knowledge combined with the power of technology innovation plays a vital role in proactively responding to the climate crisis we are facing. With Google Carbon Footprint reporting, Atos feeds emissions data in our Decarbonization Data Platform, demonstrating potential emissions reductions from the Google Cloud Platform to our customers. This reporting opens up new levels of emissions transparency, trajectory planning, and data insight to support our customers in meeting, and potentially accelerating towards, their climate goals.”—Nourdine Bihmane, Head of Decarbonization Business Line, Atos
“The capability to measure and understand the environmental footprint of our Public Cloud usage is among the key axis of our sustainable tech roadmap. With Google Cloud Carbon Footprint, we are now able to directly follow the impact of our sustainable infrastructure approach and architecture principles.”—Hervé DUMAS, Sustainability IT Director, L’Oreal
While digital infrastructure emissions are just one part of your environmental footprint, accurately accounting for IT carbon emissions is necessary to measure progress against the carbon reduction targets required to avert the worst consequences of climate change. To help you account for emissions beyond our cloud and across your organization, we’re excited to partner with Salesforce Sustainability Cloud, integrating our Google Cloud Platform emissions data into their carbon accounting platform.
“As we face unprecedented climate challenges, companies across the globe need to embed sustainability into the core of their business in order to meet growing customer and stakeholder expectations, and reduce their environmental impact. Together, Google Cloud and Salesforce Sustainability Cloud can help our joint customers accelerate their path to Net Zero, leveraging data-driven insights and visualizations to track and reduce their carbon emissions to drive sustainable change.”—Ari Alexander, GM of Salesforce Sustainability Cloud.
From information to action
With the gross energy-related emissions footprint of data associated with your Google Cloud usage now available, we’re committed to providing tools to not only measure your carbon footprint, but help you reduce it. We recently launched low-carbon region icons to help you choose cleaner regions to locate your Google Cloud resources. New users who see the icons are over 50% more likely to choose clean regions over others, ensuring their applications emit less carbon over time.
For current Google Cloud users, we’re pleased to announce that Active Assist Recommender will include a new sustainability impact category, extending its original core pillars of cost, performance, security, and manageability. Starting with the Unattended Project Recommender, you’ll soon be able to estimate the gross carbon emissions you’ll save by removing your idle resources. Unattended Project Recommender uses machine learning to identify, with a high degree of confidence, projects that are likely abandoned based on API and networking activity, billing, usage of cloud services, and other signals, and provides actionable recommendations on how to remediate those abandoned projects. By deleting these projects, not only can you reduce costs and mitigate security risks, but you can also reduce your carbon emissions. In August, Active Assist analyzed the aggregate data from all customers across our platform, and over 600,000 gross kgCo2e was associated with projects that it recommended for cleanup or reclamation. If customers deleted these projects they would significantly reduce future gross carbon emissions. Check out this blog to learn more about Active Assist.

Solutions for climate resilience
Many of our customers face difficult questions about how their business impacts the natural environment today, and how it will be affected by climate change in the future. Answering these questions requires rich datasets about the planet, better analytics tools and smarter models to predict potential outcomes. For over a decade Google Earth Engine has supported scientists and developers with hyperscale computing power and the world’s largest catalog of satellite image data. Today, we are delighted to announce the preview of Earth Engine as part of Google Cloud Platform. Now, you can access Earth Engine and combine it with other geospatial-enabled products like BigQuery. By extending Earth Engine’s powerful platform to enterprises through Google Cloud, we are bringing the best of Google together.
Over the past year we’ve worked with a number of organizations to use Earth Engine technology with tools like BigQuery and the Cloud AI Platform to develop new solutions for responsible commodity sourcing, sustainable land management and carbon emissions reduction. Earth Engine enables companies to track, monitor and predict changes in the Earth’s surface due to extreme weather events or human-caused activities, thus helping them save on operational costs, mitigate and better manage risks, and become more resilient to climate change threats. This new offering will wrap the unique data, insights and functionality of Earth Engine with a fully-managed, enterprise-grade experience and reliability.
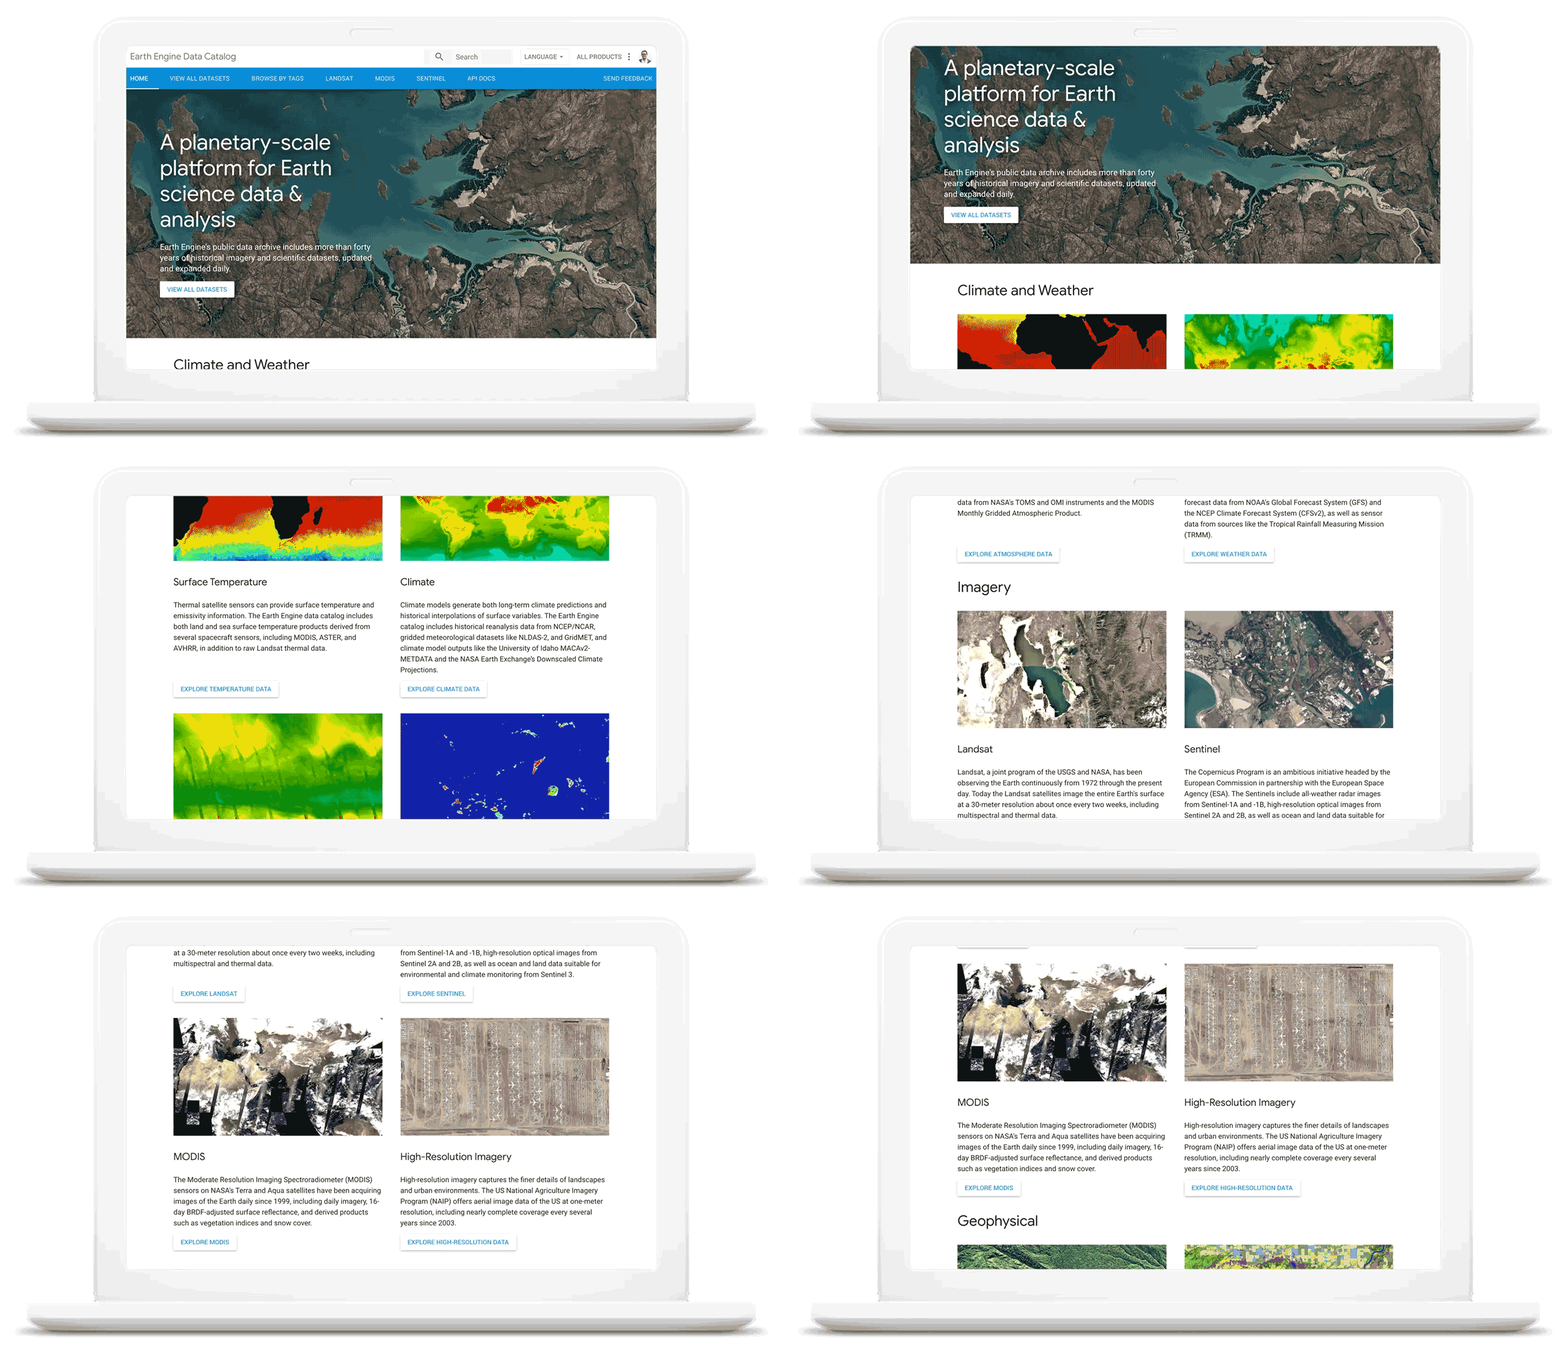
As we work with our customers to accelerate their sustainability initiatives, earth observation data is proving critical to effectively plan for the long-term impacts of climate change. To extend our geospatial and sustainability use cases we’re also expanding our partnerships with CARTO, Climate Engine, Geotab, NGIS, and Planet to bring their data and core applications to Google Cloud.
These partners will each make their existing platforms and datasets available globally on Google Cloud, giving you low-latency and reliable access to critical data and applications that will inform your sustainability initiatives. By integrating water availability, agricultural data, weather risks, and extensive daily satellite imagery into Earth Engine and BigQuery, you can achieve more ambitious goals for the sustainability of your business and our planet.
Committing to help you meet your climate goals
With each of these tools, we’re working to reduce the barriers you face in adopting more sustainable technology practices. We understand that building more sustainable applications and infrastructure is not easy. You face competing priorities, technical challenges, and the perception that climate action is costly.
It doesn’t have to be this way. Today, we are making a sustainability pledge to you: teams across Google Cloud are committing to eliminating the barriers you face in building a more sustainable digital future for your organization, and will help you take action today to realize your climate goals. We’ll do this in a number of ways:
- In digital transformation projects and workshops, sustainability teams will always have a seat at the planning table, so we can work together on using cloud technology to build a more sustainable future.
- We’re putting low-carbon signals natively into our products to help developers choose more sustainable options early in their application development.
- We’ll ensure carbon impact is measured consistently with other key performance indicators. Leveraging the social cost of carbon, the ROI models and value assessments you conduct with Google Cloud will project your emissions impact too.
- We’ll be transparent about our carbon impact, by publishing third-party reviewed reports and methodologies, so you can trust the data for your own reports and disclosures.
- We’ll continue to work with the industry on best practices, including educational resources like Sustainable IT – Decoded, a new masterclass created in partnership with Intel, that shares the expertise of sustainability thought leaders.
For the next decade we need to work together to avert the worst consequences of climate change. We’ve made tremendous progress in building technology that helps everyone do more for the planet, and we’re excited to see what you do with it. Visit this page to learn more about Google Cloud’s sustainability efforts.
More Relevant Stories for Your Company

Best Kept Security Secrets: How to Resolve Cloud Trust Paradox with Cloud EKM
Whether driven by government policy, industry regulation, or geo-political considerations, the evolution of cloud computing has led organizations to want even more control over their data and more transparency from their cloud services. At Google Cloud, one of the best tools for achieving that level of control and transparency is

How Buffalo Tours CEO Found a Way to Increase Bookings by Over 1 Percent
Buffalo Tours serves tons of passengers each month, helping them with various aspects of their travel. These involve tour booking requests from passengers, request processing and information checking. Prior to the Google implementation, Buffalo Tour’s email exchange was supported by another email server. Employees lamented the frequent loss of emails
The Tech Behind Goibibo’s Amazing Collaboration Tool That Employees Love
Founded in 2007 and entering the travel market in 2009, Goibibo has grown to support 21 million users, 98% of whom are based in India. “We specialise in domestic Indian bookings and outbound bookings for Indian residents looking to travel to other countries,” explains Vikalp Sahni, Co-Founder and Chief Technology

Three months, 30x demand: How we scaled Google Meet during COVID-19
As COVID-19 turned our world into a more physically distant one, many people began looking to online video conferencing to maintain social, educational, and workplace contact. As shown in the graph below, this shift has driven huge numbers of additional users to Google Meet. The continental peak session count dictated
