





How Data Efficiency with Google Cloud Empower Governments to Make Data-first Decisions

5066
Of your peers have already read this article.
1:30 Minutes
The most insightful time you'll spend today!
Presently, every government agency has to take a hard look at their data capabilities and decide whether their current infrastructure supports their workflow. For many, it doesn’t. Most data systems are developed with a strict set of parameters in mind before implementation, which can limit flexibility and long-term use. Particularly during a crisis, flexible “living systems” offer tremendous advantages as they’re able to change capacity rapidly. Building living data systems with the cloud in mind allows organizations to respond to a changing world with confidence.
Last summer, the Government Business Council conducted a survey of government employees to understand the impacts of data efficiency on government operations. The report Built to Last: A Survey on Organizational Data Efficiency in Times of Crisis offers key insights into organizational efficacy and whether organizations can adapt to a crisis at speed. It also highlights differences between traditional data systems and living data systems.
Data needs to be readily available
When the pandemic first hit, many agencies needed to create or transition their systems to allow employees to work remotely. This change tested the limits of existing data systems. Even after finding a cloud service provider, agencies encountered the challenges of migrating their data to the cloud.
Government organizations had decades of data stored in paper records. Most have been working to transfer these records to a digital format, but the process has been slow. They are also faced with collecting sizable amounts of data in real time from their ongoing services, which involves interfacing with the public, external vendors, or third-party institutions.
Building the cloud into a flexible data system can solve both issues. Old records can be digitized and given an easy-to-access home for those who need them. Incoming data, both internal and external, can be made accessible as well. Migrating data to the cloud also doubles as a way to create backups of raw data, adding an extra layer of security. Most importantly, building in the cloud unlocked the capacity to scale when demand rises.
Data should be updated in real-time
One of the key takeaways from the Government Business Council report is the fact that agencies are better able to adapt at speed when data efficiencies are higher. 74% of organizations with pandemic related functions reported a moderate to severe impact to their jobs at the onset of the pandemic. Of those organizations, the ones reporting their data efficiency as “very good” have largely already recovered. That adaptability directly affects an agency’s ability to make informed decisions during a time of a crisis.
Having a real-time data solution in place lets agencies make near real-time decisions. A great example of this from early in the pandemic is vaccine distribution. Google Cloud supported multiple states, such as the State of Wyoming, in distributing vaccines efficiently while handling challenges such as reaching rural populations. Data systems that gathered real-time patient data made a difference in the number of vaccines distributed. Knowing population data and patient risk factors enabled quick and effective decision-making.
A global pandemic is far from the only crisis that needs effective data analytics. Natural disasters, food deserts, public health issues, and more can all be handled more efficiently by having real-time data at hand. Effective data analytics systems are the digital equal of “having your ear to the ground” in each community. They provide valuable insights into what people need.
Data needs to be accessible and easy to use
Making data easy to work with and understand sets phenomenal data systems apart from functional ones. Having data in the cloud is a great first step, but agencies need to be able to easily access and quickly use the data to accomplish their goals. This is where traditional data systems fail most often. Traditional IT systems and data strategies are designed for a specific purpose, usually identified before development and implementation begin. That means that when the data living in those systems needs to be used differently, adapting to new requirements can be difficult.
Data can often feel “locked” in traditional systems; the data is there, but there’s no way to get to it or work with it in a way that meets the needs of a crisis. Flexible data systems address this by allowing for greater accessibility. Google Cloud, for example, has customizable tools, such as Contact Center AI and Document AI, which let agencies work with data in ever-changing ways. This also produces greater data transparency since data sets can be worked with and accessed more easily.
Governments need to respond to the changing needs of their constituents in emergencies. While traditional data systems can handle slowly shifting demands on the system, they do not serve agencies well in a crisis. When urgency, accuracy, and accessibility all matter, flexible systems rise to the challenge. The pandemic has pushed agencies to adapt in real time, and many have realized they need a system that adapts with them.
Google Cloud has a suite of tools to create integrated data ecosystems. These ecosystems can scale with increasing demand, meet dynamic development needs, and adapt to a changing landscape. Data-first decision-making is a core tenet of “living data systems.” Google Cloud data systems have handled everything from administering vaccines to detecting fraud. In each of these applications, a core tenet of data-first decision making was implemented at scale.
For more insights on how flexible data systems help the public sector, download the full report “Built to Last: A Survey on Organizational Data Efficiency in Times of Crisis.”
BigQuery Helps Insurance Firms Leverage Previous Storm Data for Better Pricing Insights

8570
Of your peers have already read this article.
2:00 Minutes
The most insightful time you'll spend today!
It may be surprising to know that U.S. natural catastrophe economic losses totaled $119 billion in 2020, and 75% (or $89.4B) of those economic losses were caused by severe storms and cyclones. In the insurance industry, data is everything. Insurers use data to influence underwriting, rating, pricing, forms, marketing, and even claims handling. When fueled by good data, risk assessments become more accurate and produce better business results. To make this possible, the industry is increasingly turning to predictive analytics, which uses data, statistical algorithms, and machine learning (ML) techniques to predict future outcomes based on historical data. Insurance firms also integrate external data sources with their own existing data to generate more insight into claimants and damages. Google Cloud Public Datasets offers more than 100 high-demand public datasets through BigQuery that helps insurers in these sorts of data “mashups.”
One particular dataset that insurers find very useful is Severe Storm Event Details from the U.S. National Oceanic and Atmospheric Administration (NOAA). As part of the Google Cloud Public Datasets program and NOAA’s Public Data Program, this severe storm data contains various types of storm reports by state, county, and event type—from 1950 to the present—with regular updates. Similar NOAA datasets within the Google Cloud Public Datasets program include the Significant Earthquake Database, Global Hurricane Tracks, and the Global Historical Tsunami Database.
In this post, we’ll explore how to apply storm event data for insurance pricing purposes using a few common data science tools—Python Notebook and BigQuery—to drive better insights for insurers.
Predicting outcomes with severe storm datasets
For property insurers, common determinants of insurance pricing include home condition, assessor and neighborhood data, and cost-to-replace. But macro forces such as natural disasters—like regional hurricanes, flash floods, and thunderstorms—can also significantly contribute to the risk profile of the insured. Insurance companies can leverage severe weather data for dynamic pricing of premiums by analyzing the severity of those events in terms of past damage done to property and crops, for example.
It’s important to set the premium correctly, however, considering the risks involved. Insurance companies now run sophisticated statistical models, taking into account various factors—many of which can change over time. After all, without accurate data, poor predictions can lead to business losses, particularly at scale.
The Severe Storm Event Details database includes information about a storm event’s location, azimuth (an angle measurement used in celestial coordination), distance, impact, and severity, including the cost of damages to property and crops. It documents:
- The occurrence of storms and other significant weather events of sufficient intensity to cause loss of life, injuries, significant property damage, and/or disruption to commerce.
- Rare, unusual weather events that generate media attention, such as snow flurries in South Florida or the San Diego coastal area.
- Other significant weather events, such as record maximum or minimum temperatures or precipitation that occur in connection with another event.
Data about a specific event is added to the dataset within 120 days to allow time for damage assessments and other analysis.
Driving business insights with BigQuery and notebooks
Google Cloud’s BigQuery provides easy access to this data in multiple ways. For example, you can query directly within BigQuery and perform analysis using SQL.
Another popular option in the data science and analyst community is to access BigQuery from within the Notebook environment to intersperse Python code and SQL text, and then perform ad hoc experimentation. This uses the powerful BigQuery compute to query and process huge amounts of data without having to perform the complex transformations within the memory in Pandas, for example.
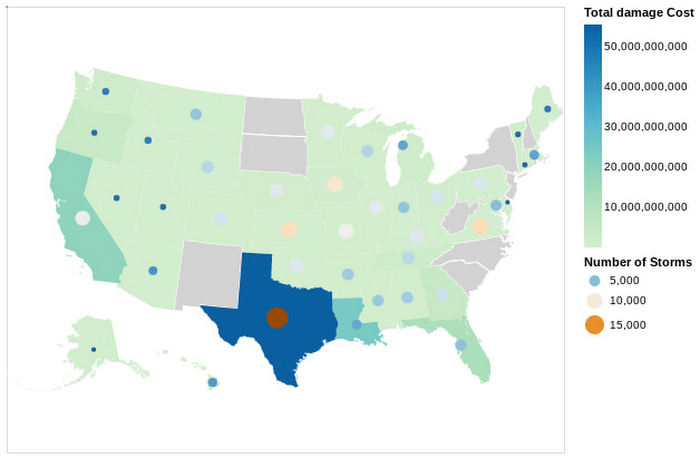
In this Python notebook, we have shown how the severe storm data can be used to generate risk profiles of various zip codes based on the severity of those events as measured by the damage incurred. The severe storm dataset is queried to retrieve a smaller dataset into the notebook, which is then explored and visualized using Python. Here’s a look at the risk profiles of the zip codes:
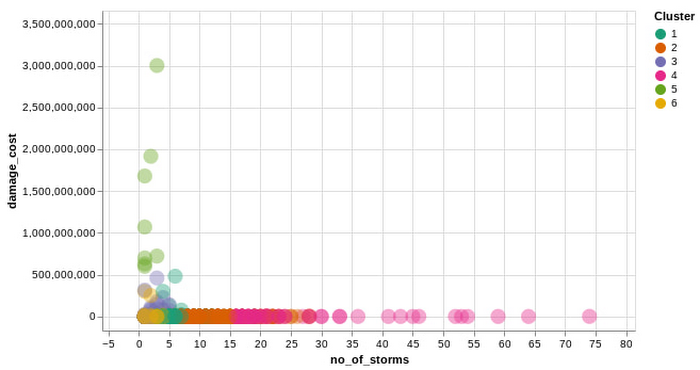
Another Google Cloud resource for insurers is BigQuery ML, which allows them to create and execute machine learning models on their data using standard SQL queries. In this notebook, with a K-Means Clustering algorithm, we have used BigQuery ML to generate different clusters of zip codes in the top five states impacted by severe storms. These clusters show different levels of impact by the storms, indicating different risk groups.
The example notebook is a reference guide to enable analysts to easily incorporate and leverage public datasets to augment their analysis and streamline the journey to business insights. Instead of having to figure out how to access and use this data yourself, the public datasets, coupled with BigQuery and other solutions, provide a well-lit path to insights, leaving you more time to focus on your own business solutions.
Making an impact with big data
Google Cloud’s Public Datasets is just one resource within the broader Google Cloud ecosystem that provides data science teams within the financial services with flexible tools to gather deeper insights for growth. The severe storm dataset is a part of our environmental, social, and governance (ESG) efforts to organize information about our planet and make it actionable through technology, helping people make a positive impact together.
To learn more about this public dataset collaboration between Google Cloud and NOAA, attend the Dynamic Pricing in Insurance: Leveraging Datasets To Predict Risk and Price session at the Google Cloud Financial Services Summit on May 27. You can also check out our recent blog and explore more about BigQuery and BigQuery ML.
How Recommendation AI Helps Retailers Optimize Click-through and Conversion Rates

7072
Of your peers have already read this article.
3:00 Minutes
The most insightful time you'll spend today!
Time to go outside again, I guess. I’ll need a sun hat. Sunscreen. Maybe some new sandals? What else?
With the Recommendations AI service, I might be reminded to grab a reusable water bottle and a swimsuit. Or some after-sun aloe lotion. Good thing, cause I’ll need it.

Recommendations AI is a solution that uses machine learning to bring product recommendations to their shoppers across any catalog or client list. This service is part of our full suite of Retail solutions. When you integrate with the Retail API, you get the benefit of Google’s Product Discovery. Integrating once to reap the benefits over and over. Recommendations is the starting point, and you can easily extend into Retail Search and Vision Product Search in the upcoming future.
The Recommendations solution is fully managed, global-scale and powered by deep learning, so you can focus on a great shopping experience and let someone else worry about the infrastructure.
Compared to baseline recommendation systems used by customers, Recommendations AI showed double digit uplift in conversion and clickthrough rates in A/B experiments controlled by the customers. You can optimize for click-through, conversion or session revenue, and fine tune the models to make sure you omit out-of-stock items or duplicates, for example.

So how does it work, and how do you get started? Read on, and we’ll walk you through the pipeline, starting with the data you already have to placement in your online store.
Formula: Data -> Model -> Placement
You start with your catalog, the list of all the things (postcards, movies, pie recipes) that you want to show your customers. Then you ingest your PII-redacted user events -this is the historic event data like home page views, add to cart events and more along with real time user events. This user event is joined with the product catalog and items that allows us to construct the sequence of shoppers’ activity, thus being able to predict what the shopper has a high propensity to purchase next. The user events can come from both online activity across devices or offline store purchases
The recommendation model will return a list of products, which are the recommendations. The brains of the operation, if you will. This model is trained using all the data that you ingest, using the latest neural network models and techniques that Google has built expertise over the years in flagship products like Youtube and News, that allows us to uncover shopper intent, so it can best predict the right recommendations to show to the right people.
Every model outputs a list of product identifiers, but where do they go? They go into placements, the spots, panels, carousels on your customer’s journey interacting with your brand that you’ve set aside to highlight recommendations. A model can send recommendations to one or more placements, but each placement only receives information from one recommendation model. Your pages will then need to render the products with the right images, text or other metadata, using the product ID that is returned by the model.
What do recommendations look like?
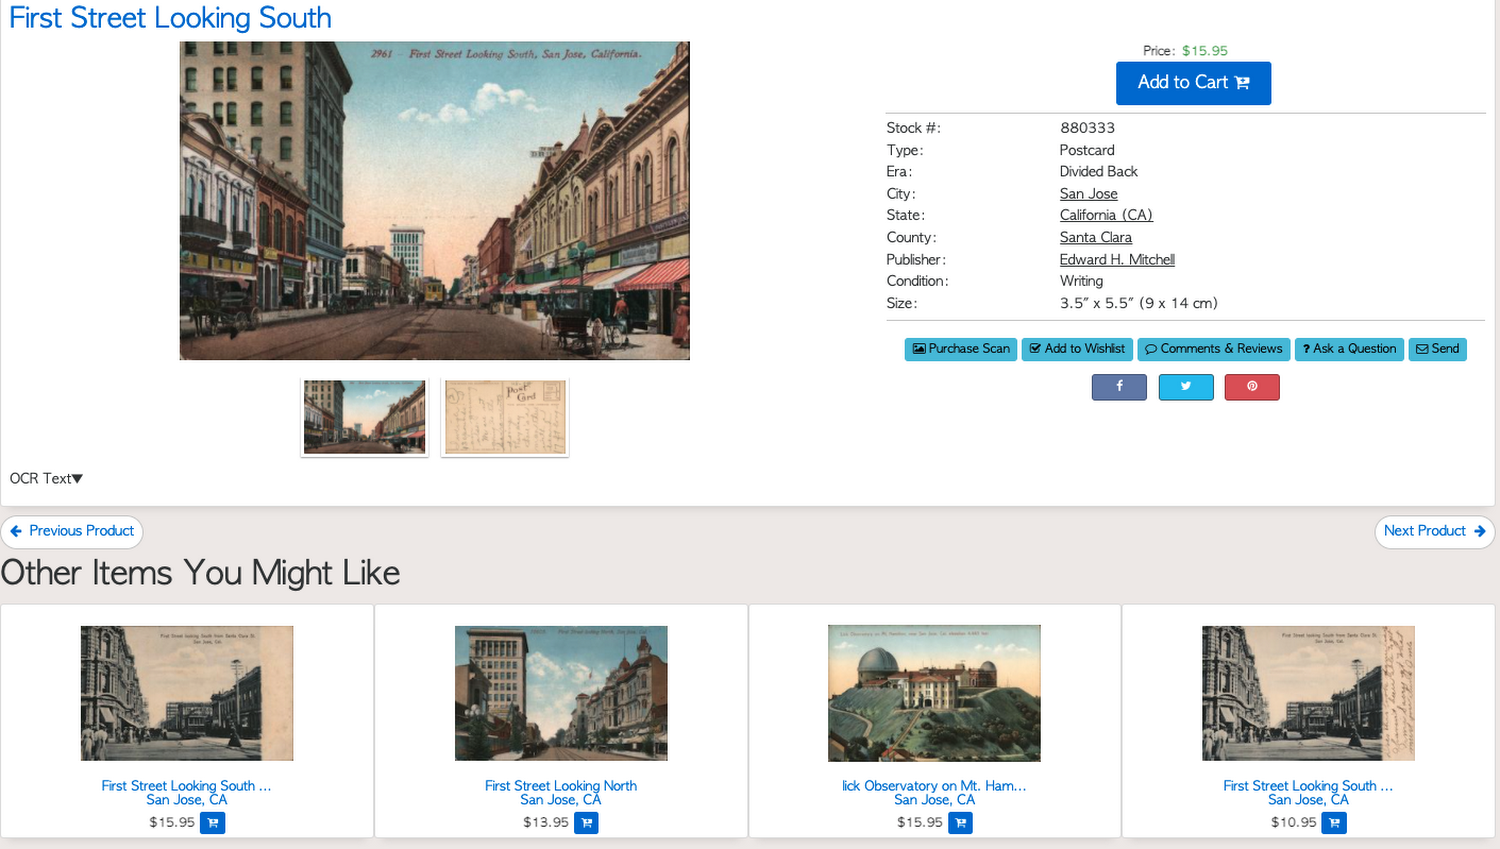
Let’s start by browsing our postcard-selling website, where I’ve been buying some vintage California postcards already. The recommendations algorithm has caught on to my interest, showing me other potential cards to purchase based on my history:
Put your data to work
To get started we need to bring your data into the recommendation model, so it can understand your customers, your inventory, and your sales patterns.
The model takes in the product catalog you use, and metadata about those products to better understand nuances in assortment, pricing and variables like size and style. You might already have this data stored in BigQuery or Merchant Center, and hence we provide easy integrations that you can leverage to get started even faster.
As for the user events, don’t worry if you already have systems in place to capture web and mobile activity. We make it easy to bring in your real time event logs by providing seamless integrations with Google Tag Manager, Javascript pixel, or even historic events from Cloud Storage, BigQuery or using inline API or JSON, so you can immediately train the models on this imported data. All this allows you to kickstart integrating with Recommendations AI in a matter of days.
The models then construct a sequence of activities that the user went through and joins with the products that the user engaged with. Once your data is ready to go, it takes a few days to train the model. Next onto making the data work for you.
Quickly customize your model
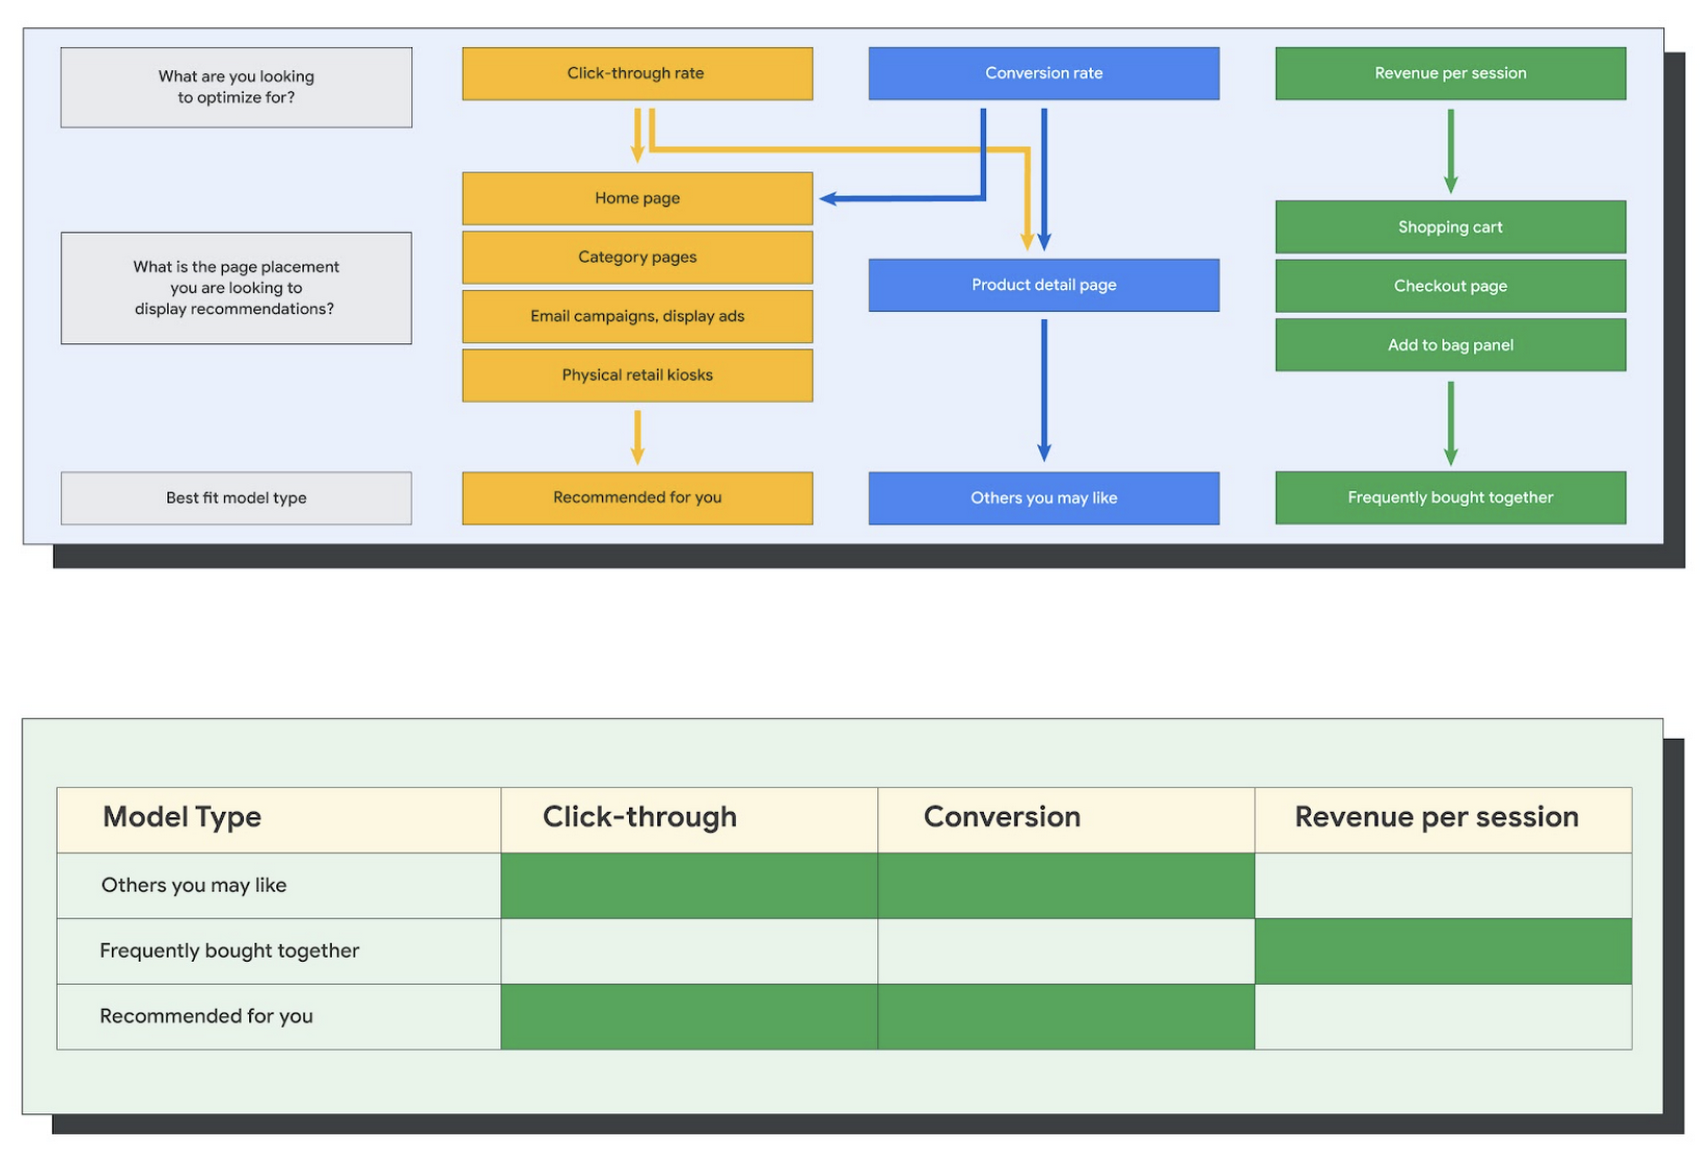
Setting up your own recommendations project in the console gives you the ability to choose what sort of model to train (based on what recommendations you want to generate) and your objective. Are you optimizing for click-through rate–more people click on the recommendation links or products–or for conversion rate–more people choose or buy what was suggested or revenue ?
Different models can be optimized for different optimization goals.; the GCP console explains what each one can do and how you can choose to optimize it.
Let’s unpack some of this terminology real quick.
We’ve got three model types:
- Recommended for you – Means we think these are items you’ll want to buy, based on your history; this is usually used on a home page to showcase items.
- Others you may like – Means if you’re browsing the page of a water bottle, we will recommend alternative brands of water bottles that you may like as well as a backpack, based on your engagement history.
- Frequently bought together – Means that when anyone buys sunscreen, we notice that they often also buy aloe lotion, so we will surface those items when someone adds any one of them to their cart.
And then we have three business objectives that the models optimize for:
- Click-through rate – How frequently did somebody click on a recommended item?
- Conversion rate– How frequently did somebody add a recommended item to their cart?
- Revenue per session – How much money did the recommendations generate for you?
Deliver anywhere along the journey
Now that you’re all set up in the Retail AI console, you can test out the recommendations in the console, even before you deploy to production.

You can integrate Recommendations into your frontend by calling the Predict APIt. The placements of recommendations will report data back into the dashboard and you can analyze and measure success for future iterations.
On top of that you can use the recommendations for other parts of your customer’s journey. Email promotions, storefront kiosks, display ads or follow-up notifications can include recommendations based on past activity and cart contents. The model gives you useful product recommendations for a wide variety of touchpoints and steps in the purchasing process.
More best practices, and guides, are available inside our documentation.
How to get started
Training your own models can be tedious, time-consuming, and expensive. On top of that it requires deeper data science expertise to set up. Let us do it instead!
You can see how IKEA Retail uses Recommendations AI in this recent talk and blog from the Google Cloud Retail Summit..
To get started today you’ll need to make a Cloud project and enable the Retail API, which then allows you to access all the recommendation tools in one menu. Bring in your catalog and purchasing data, define a placement or two, and you can start putting recommendations on your site in a matter of days.
Harnessing the Power of Data and AI to Transform Life Science Supply Chains

3976
Of your peers have already read this article.
3:30 Minutes
The most insightful time you'll spend today!
Global life science supply chains are lengthy and complex with many moving parts. One small disruption can create serious delays and affect your ability to deliver therapeutics for patients.
Supply chain disruptors
Over the last few years, healthcare organizations have encountered a range of obstacles, from both internal and external factors, that have resulted in supply networks failing to get drugs and medical devices to where they need to be on time. These obstacles include:
- Labor and supply shortages
- Rising material costs
- Raw material constraints
- Geo-political events
- Unpredictable weather
How do you overcome supply chain disruptors that are out of your control?
The intelligent healthcare supply chain
While many organizations have already implemented data-driven supply chains, organizations are still faced with the challenges of static, siloed, and different functional supply chain applications; limited data exchange with key trading partners across upstream and downstream operations; and the inability to effectively leverage relevant external data.
At Google Cloud, we believe the key to meaningful and effective change is a data-driven supply chain that allows you to achieve visibility, flexibility, and innovation.
Our solutions help you prepare for the unpredictable and enhance the value of your data. By unlocking AI-driven insights, you can strengthen distribution networks and optimize your workflows and supply chains to become more reliable, intelligent, and sustainable. Some of the business challenges we address include:
- Predicting demand with Vertex AI Forecast
- Visual inspection for quality and predictive maintenance with pre-built ML models
- Automating and optimizing pickup and delivery operations with Cloud Fleet Routing API
- Real time and holistic inventory visibility with Supply Chain Twin
Make sure you’re prepared for the unpredictable with real-time visibility over your distribution networks. Learn how you can harness the power of AI and analytics and gain actionable insights that enhance your supply chain.
3157
Of your peers have already watched this video.
2:00 Minutes
The most insightful time you'll spend today!
How Marketers Can Turn Information into Action with Machine Learning
The biggest challenge marketers face with machine learning is, “how to get starter”? Instead of getting overwhelmed, they should focus on the applied machine learning by using the algorithms that are already built.
Cassie Kozyrkov, the chief decision scientist with Google Cloud, says that marketers who are overwhelmed by everything they’re hearing about machine learning should focus on key ingredients, not building an entire kitchen.
Quick Recap on Google Cloud: Latest News, Launches, Updates, Events and More

12919
Of your peers have already read this article.
2:00 Minutes
The most insightful time you'll spend today!
Want to know the latest from Google Cloud? Find it here in one handy location. Check back regularly for our newest updates, announcements, resources, events, learning opportunities, and more.
Tip: Not sure where to find what you’re looking for on the Google Cloud blog? Start here: Google Cloud blog 101: Full list of topics, links, and resources.
Week of May 24-May 28 2021
- Google Cloud for financial services: driving your transformation cloud journey–As we welcome the industry to our Financial Services Summit, we’re sharing more on how Google Cloud accelerates a financial organization’s digital transformation through app and infrastructure modernization, data democratization, people connections, and trusted transactions. Read more or watch the summit on demand.
- Introducing Datashare solution for financial services–We announced the general availability of Datashare for financial services, a new Google Cloud solution that brings together the entire capital markets ecosystem—data publishers and data consumers—to exchange market data securely and easily. Read more.
- Announcing Datastream in Preview–Datastream, a serverless change data capture (CDC) and replication service, allows enterprises to synchronize data across heterogeneous databases, storage systems, and applications reliably and with minimal latency to support real-time analytics, database replication, and event-driven architectures. Read more.
- Introducing Dataplex: An intelligent data fabric for analytics at scale–Dataplex provides a way to centrally manage, monitor, and govern your data across data lakes, data warehouses and data marts, and make this data securely accessible to a variety of analytics and data science tools. Read more.
- Announcing Dataflow Prime–Available in Preview in Q3 2021, Dataflow Prime is a new platform based on a serverless, no-ops, auto-tuning architecture built to bring unparalleled resource utilization and radical operational simplicity to big data processing. Dataflow Prime builds on Dataflow and brings new user benefits with innovations in resource utilization and distributed diagnostics. The new capabilities in Dataflow significantly reduce the time spent on infrastructure sizing and tuning tasks, as well as time spent diagnosing data freshness problems. Read more.
- Secure and scalable sharing for data and analytics with Analytics Hub–With Analytics Hub, available in Preview in Q3, organizations get a rich data ecosystem by publishing and subscribing to analytics-ready datasets; control and monitoring over how their data is being used; a self-service way to access valuable and trusted data assets; and an easy way to monetize their data assets without the overhead of building and managing the infrastructure. Read more.
- Cloud Spanner trims entry cost by 90%–Coming soon to Preview, granular instance sizing in Spanner lets organizations run workloads at as low as 1/10th the cost of regular instances, equating to approximately $65/month. Read more.
- Cloud Bigtable lifts SLA and adds new security features for regulated industries–Bigtable instances with a multi-cluster routing policy across 3 or more regions are now covered by a 99.999% monthly uptime percentage under the new SLA. In addition, new Data Access audit logs can help determine whether sensitive customer information has been accessed in the event of a security incident, and if so, when, and by whom. Read more.
- Build a no-code journaling app–In honor of Mental Health Awareness Month, Google Cloud’s no-code application development platform, AppSheet, demonstrates how you can build a journaling app complete with titles, time stamps, mood entries, and more. Learn how with this blog and video here.
- New features in Security Command Center—On May 24th, Security Command Center Premium launched the general availability of granular access controls at project- and folder-level and Center for Internet Security (CIS) 1.1 benchmarks for Google Cloud Platform Foundation. These new capabilities enable organizations to improve their security posture and efficiently manage risk for their Google Cloud environment. Learn more.
- Simplified API operations with AI–Google Cloud’s API management platform Apigee applies Google’s industry leading ML and AI to your API metadata. Understand how it works with anomaly detection here.
- This week: Data Cloud and Financial Services Summits–Our Google Cloud Summit series begins this week with the Data Cloud Summit on Wednesday May 26 (Global). At this half-day event, you’ll learn how leading companies like PayPal, Workday, Equifax, and many others are driving competitive differentiation using Google Cloud technologies to build their data clouds and transform data into value that drives innovation. The following day, Thursday May 27 (Global & EMEA) at the Financial Services Summit, discover how Google Cloud is helping financial institutions such as PayPal, Global Payments, HSBC, Credit Suisse, AXA Switzerland and more unlock new possibilities and accelerate business through innovation. Read more and explore the entire summit series.
- Announcing the Google for Games Developer Summit 2021 on July 12th-13th–With a surge of new gamers and an increase in time spent playing games in the last year, it’s more important than ever for game developers to delight and engage players. To help developers with this opportunity, the games teams at Google are back to announce the return of the Google for Games Developer Summit 2021 on July 12th-13th. Hear from experts across Google about new game solutions they’re building to make it easier for you to continue creating great games, connecting with players and scaling your business. Registration is free and open to all game developers. Register for the free online event at g.co/gamedevsummit to get more details in the coming weeks. We can’t wait to share our latest innovations with the developer community. Learn more.
More Relevant Stories for Your Company

How Vertex AI NAS is Suitable for Most Advanced ML Workloads
Vertex AI launched with the premise “one AI platform, every ML tool you need.” Let’s talk about how Vertex AI streamlines modeling universally for a broad range of use cases. The overall purpose of Vertex AI is to simplify modeling so that enterprises can fast track their innovation, accelerate time to market,

Data to Business Outcomes with Google’s Data Analytics Design Pattern
Companies today are inundated with vast amounts of data from various sources. This overwhelming amount of data is meant to benefit the company, but often leaves data teams feeling overwhelmed, which can create data bottlenecks and result in a slow time to value. In fact, only twenty seven percent of

Google’s Lesson on Leveraging AI and More to Optimize Cloud Value for Innovation
Google has managed to stay ahead of the curve and demonstrate its 'growth while staying innovative' approach using advanced open technologies, AI/ML based analytics solutions, as well as tools for team collaboration and skill development, automation and storage security. Businesses too can achieve the same by deriving maximum value from

Poor Product Discovery Causes Shoppers’ Abandonment, Time to Augment ‘Search Experience’ with Google’s Retail Search!
How many times has a shopper searched for a product on a store’s website only to get results that aren’t relevant—or worse, provided no search results at all? While most ecommerce sites have search capabilities, few accomplish their ultimate goal: making it easy for customers to discover the products they
