





Home Depot Leverages Google Cloud’s BigQuery and DataFlow to Break Data Silos and Craft Personalized CX

4995
Of your peers have already read this article.
4:00 Minutes
The most insightful time you'll spend today!
The Home Depot, Inc., is the world’s largest home improvement retailer with annual revenue of over $151B. Delighting our customers—whether do-it-yourselfers or professionals—by providing the home improvement products, services, and equipment rentals they need, when they need them, is key to our success.
We operate more than 2,300 stores throughout the United States, Canada, and Mexico. We also have a substantial online presence through HomeDepot.com, which is one of the largest e-commerce platforms in the world in terms of revenue. The site has experienced significant growth both in traffic and revenue since the onset of Covid-19.
Because many of our customers shop at both our brick-and-mortar stores and online, we’ve embarked on a multi-year strategy to offer a shopping experience that seamlessly bridges the physical and digital worlds. To maximize value for the increasing number of online shoppers, we’ve shifted our focus from event marketing to personalized marketing, as we found it to be far more effective in improving the customer experience throughout the sales journey. This led to changing our approach to marketing content, email communications, product recommendations, and the overall website experience.
Challenge: launching a modern marketing strategy using legacy IT
For personalized marketing to be successful, we had to improve our ability to recognize a customer at the point of transaction so we could—among other things—suspend irrelevant and unnecessary advertising. Most of us have experienced the annoyance of receiving ads for something we’ve already purchased, which can degrade our perception of the brand itself. While many online retailers can identify 100% of their customer transactions due to the rich information captured during checkout, most of our transactions flow through physical stores, making this a more difficult problem to solve.
Our old legacy IT system, which ran in an on-premises data center and leveraged Hadoop, also challenged us since maintaining both the hardware and software stack required significant resources. When that system was built, personalized marketing was not a priority, so it took several days to process customer transaction data and several weeks to roll out any system changes. Further, managing and maintaining the large Hadoop cluster base presented its own set of issues in terms of quality control and reliability, as did keeping up with open-source community updates for each data processing layer.
Adopting a hybrid approach
As we worked through the challenges of our legacy system, we started thinking about what we wanted our future system to look like. Like many companies, we began with a “build vs. buy” analysis. We looked at several products on the market and determined that while each of them had their strengths, none was able to offer the complete set of features we needed.
Our project team didn’t think it made sense to build a solution from scratch, nor did we have access to the third-party data we needed. After much consideration, we decided to adopt a solution that combined a complete rewrite of the legacy system with the support of a partner to help with the customer transaction matching process.
Building the foundation on Google Cloud
We chose Google Cloud’s data platform, specifically BigQuery, Dataflow, DataProc, Cloud Storage, and Cloud Composer. Google Cloud platform empowered us to break down data silos and unify each stage of the data lifecycle from ingestion, storage, and processing to analysis and insights. Google Cloud offered best-in-class integration with open-source standards and provided the portability and extensibility we needed to make our hybrid solution work well. The open standards of BigQuery’s BQ Storage API allowed us to leverage fast BQ storage layers to be utilized with other compute platforms, e.g., DataProc.
We used BigQuery combined with Dataflow to integrate our first- and third-party data into an enterprise data and analytics data lake architecture. The system then combined previously siloed data and used BigQuery ML to create complete customer profiles spanning the entire shopping experience, both in-store and online.
Understanding the customer journey with the help of Dataflow and BigQuery
The process of developing customer profiles involves aggregating a number of first- and third-party data sources to create a 360-degree view of the customer based on both their history and intent. It starts with creating a single historical customer profile through data aggregation, deduplication, and enrichment. We used several vendors to help with customer resolution and NCOA (Change of Address) updates, which allows the profile to be house-holded and transactions to be properly reconciled to both the individual and the household. This output is then matched to different customer signals to help create an understanding of where the customer is in their journey—and how we can help.
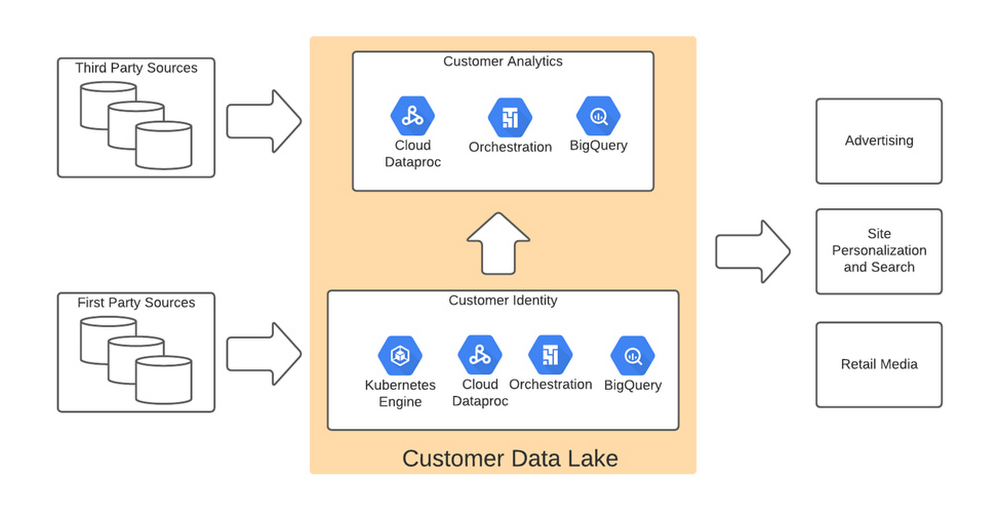
The initial implementation used Google Dataflow, Google’s streaming analytics solution, to load data from Google Cloud Storage into BigQuery and perform all necessary transformations. The Dataflow process was converted into BQML (BigQuery Machine Learning) since this significantly reduced costs and increased visibility into data jobs. We used Google Cloud Composer, a fully managed workflow orchestration service, to help orchestrate all data operations and DataProc and Google Kubernetes Engine to enable special case data integration so we could quickly pivot and test new campaigns. The architecture diagram below shows the overall structure of our solution.
Taking full advantage of cloud-native technology
In our initial migration to Google Cloud, we moved most of our legacy processes in their original form. However, we quickly learned that this approach didn’t take full advantage of the cloud-native and more improved features Google Cloud offered such as auto scaling of resources, flexibility to decouple storage from the compute layer, and a wide variety of options to choose the best tool for the job. We refactored our Hadoop-based data pipelines written in Java-based Map Reduce and our Pig Latin jobs to Dataflow and BigQuery jobs. This dramatically reduced processing time and made our data pipeline code concise and efficient.
Previously, our legacy system processes ran longer than intended, and data was not used efficiently. Optimizing our code to be cloud-native and leveraging all the capabilities of Google Cloud services resulted in reduced run times. We decreased our data processing window from 3 days to 24 hours, improved resource usage by dramatically reducing the amount of compute we used to possess this data, and built a more streamlined system. This in turn reduced cloud costs and provided better insight. For example, DataFlow offers powerful native features to monitor data pipelines, enabling us to be more agile.
Leveraging the flexibility and speed of the cloud to improve outcomes
Today, using a continuous integration/continuous delivery (CI/CD) approach, we can deploy multiple system changes each week to further improve our ability to recognize in-store transactions. Leveraging the combined capabilities of various Google Cloud systems—BigQuery, DataFlow, Cloud Composer, Dataproc, and Cloud Storage–we drastically increased our ability to recognize transactions and can now connect over 75% of all transactions to an existing household. Further, the flexible Google Cloud environment coupled with our cloud-native application makes our team more nimble and better able to respond to emerging problems or new opportunities.
Increased speed has led to better outcomes in our ability to match transactions across all sales channels to a customer and thereby improve their experience. Before moving to Google Cloud, it took 48 to 72 hours to match customers to their transactions, but now we can do it in less than 24 hours.
Making marketing more personal—and more efficient
The ability to quickly match customers to transactions has huge implications for our downstream marketing efforts in terms of both cost and effectiveness. By knowing what a customer has purchased, we can turn off ads for products they’ve already bought or offer ads for things that support what they’ve bought recently. This helps us use our marketing dollars much more efficiently and offer an improved customer experience.
Additionally, we can now apply the analytical models developed using BQML and Vertex AI to sort customers into audiences. This allows us to more quickly identify a customer’s current project, such as remodeling a kitchen or finishing a basement, and then personalize their journey by offering them information on products and services that matter most at a given point through our various marketing channels. This provides customers with a more relevant and customized shopping journey that mirrors their individual needs.
Protecting a customer’s privacy
With this ability to better understand our customers, we also have the responsibility to ensure we have good oversight and maintain their data privacy. Google’s cloud solutions provide us the security needed to help protect our customers’ data, while also being flexible enough to allow us to support state and federal regulations, like the California Customer Privacy Act. This way we can provide a customer the personalized experience they desire without having to fear how their data is being used.
With flexible Google Cloud technology in place, The Home Depot is well positioned to compete in an industry where customers have many choices. By putting our customers’ needs first, we can stay top of mind whenever the next project comes up.
4902
Of your peers have already watched this video.
9:37 Minutes
The most insightful time you'll spend today!
L’Oréal: Managing Big-data Complexity with Google Cloud
L’Oreal is a global company with a presence in 150 countries worldwide. Between managing all of its brands and requirements for different countries, L’Oreal looks to data to make insightful business decisions. How does L’Oreal unify its data across all its systems and databases? How does L’Oreal make the data accessible to thousands of employees? In this video, Antoine Castex, Enterprise Architect at L’Oreal, discusses with Martin Omander how L’Oreal built a serverless, multi-cloud warehouse based on Google Cloud.
Chapters:
0:00 – Intro
0:23 – Why does L’Oreal need a new data warehouse?
0:51 – Who is the L’Oreal group?
1:35 – Which systems does L’Oreal use?
2:14 – How does L’Oreal manage complexity?
3:59 – What is ELT?
4:57 – Who are L’Oreal’s data consumers?
5:41 – How L’Oreal built the data warehouse
8:51 – L’Oreal’s future plans
9:10 – Wrap up
Google Cloud Workflows → https://goo.gle/3q20M1V
Cloud Run → https://goo.gle/3CSWbXG
Eventarc → https://goo.gle/3B7qhFy
BigQuery → https://goo.gle/3KHgyJ3
Looker → https://goo.gle/3Rx4Ind
Checkout more episodes of Serverless Expeditions → https://goo.gle/ServerlessExpeditions
Subscribe to Google Cloud Tech → https://goo.gle/GoogleCloudTech
Serverless and BigQuery Together on Google Cloud: Behind the L’Oreal Beauty Tech Data Platform

5348
Of your peers have already read this article.
4:00 Minutes
The most insightful time you'll spend today!
Editor’s note: In Today’s guest post we hear from beauty leader L’Oréal about their approach to building a modern data platform on fully managed services: managing the ingest of diverse datasets into BigQuery with Cloud Run, and orchestrating transformations into relevant business domain representations for stakeholders across the organization. Learn more about how businesses have benefited from Cloud Run in Forrester’s report on Total Economic Impact.
L’Oréal was born out of science. For over 100 years, we have always shaped the future of beauty, and taken its eternal quest to new horizons. This has earned us our current position as the world’s uncontested beauty leader (~€ 32 B annual sales in 2021), present in 150 countries with over 85,000 employees.
Today, with the power of our game-changing science, multiplied by cutting-edge technologies, we continue our lifelong journey of shaping the future of beauty.
As a Beauty Tech company, we leverage our decades-long heritage of rich data assets to empower our decision-making with instant, sophisticated analysis.
Because we oversee global brands, which must adapt to local requirements, we need to maintain a deep understanding of what a brands’ data represents, while managing disparate legal and regulatory requirements for different countries. Our end goal is to run a safe, compliant and sustainable data warehouse as efficiently and effectively as possible.
We sync and aggregate internal and external data from a wide variety of sources across organizations and retail stores. This made the management of our data warehouse infrastructure used to be very complex and hard to manage before Google Cloud. L’Oréal’s footprint was so large that we once found it impossible to have a standardized method to handle data. Every process was vendor-specific, and the infrastructure was brittle. We went looking for a solution to our complex data infrastructure needs, and defined the following non-negotiable principles:
- No Ops: The job of a developer at L’Oréal is not to manage servers. We need an elastic infrastructure that scales on demand, so that our developers can focus on delivering customized and inclusive beauty experiences to all consumers, rather than focusing on managing servers.
- Secure: We have strict security and compliance requirements which vary by country, and we employ a zero-trust security strategy. We must keep both our own internal data and customer data safe and encrypted.
- Sustainable : Our data lives in multiple environments, including on-prem data centers and public cloud services. We must be able to securely access and analyze this data while minimizing the complexity and environmental impact of moving and duplicating data.
- End-to-end supervision: Because developers shouldn’t be managing servers, we need a “single pane of glass” dashboard to monitor and triage the system if something goes wrong.
- Easy-to-deploy: Deploying code safely should not compromise velocity. We are constantly developing innovations that push the boundaries of science and reinvent beauty rituals. We need integrated tools to make our code deployment process seamless and safe.
- Event-driven architecture: Our data is used globally by research, product, business and engineering teams with high expectations on data quality and timeliness. Many of our internal processes and analysis are based on near real-time data.
- Data products delivered “as a service”: We want to empower our employees to drive business value at record speed. To that end, we need solutions that enable us to remove the developers from the critical path of solution delivery as much as possible.
- Extract-load-transform (ELT): Our goal is to implement the pattern to load data as soon as possible into the data warehouse to take advantage of SQL transformations.
After considering multiple vendors on the market, with these principles in mind, we landed on end-to-end Google Cloud serverless and data tooling. We were already using Google Cloud for a few processes, including BigQuery, and loved the experience.
We’ve now expanded our use of Google Cloud to fully support the L’Oréal Beauty Tech Data Platform.
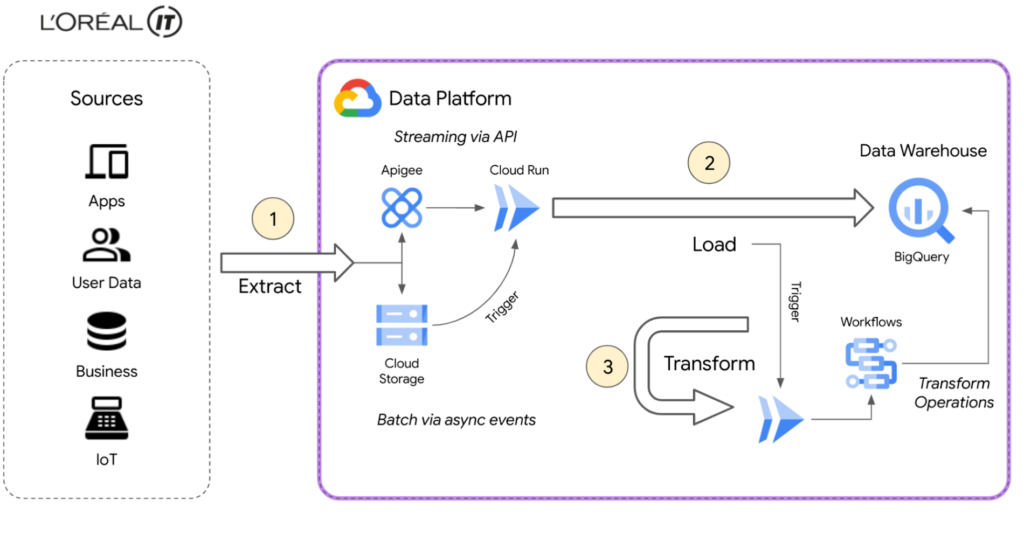
L’Oréal’s Beauty Tech Data Platform incorporates data from two types of sources: directly via API, which is data that adapts easily to our schema and is inserted directly into BigQuery, and bulk data from integrations, which require event-driven transformations using Eventarc mechanisms. These transformations are performed in Cloud Run and Cloud Functions (2nd gen), or directly in SQL. With Google Cloud, we can adapt very quickly.
Today, we currently have 8500 flows for ~5000 users using the native zero-trust capabilities offered by Google Cloud. Indeed, the flows come from Google Cloud and other third-party services.
BigQuery enabled us to adopt standard SQL as our universal language in our data warehouse and meet all expectations for queries and reporting. We were also able to load original data using features like federated queries, and efficiently transitioned from ETL to ELT data ingestion by handling semi-structured data with SQL. This approach of loading original data from sources into BigQuery with non-destructive transformations allows us to reprocess data for new use-cases easily, directly within BigQuery.
Our applications are hosted on multiple environments – on-premises, in Google Cloud, and in other public clouds. This made it difficult for our data engineers and analysts to natively analyze data across clouds until we started using BigQuery Omni. This capability of BigQuery allowed us to globally access and analyze data across clouds through a single pane of glass using the native BigQuery user interface itself. Without BigQuery Omni, it would’ve been impossible for our teams to natively do cross-cloud analytics. Moreover, it eliminated the need for us to move sensitive data, which is not only expensive because of local tax and subsea transport, but also incredibly risky – sometimes even forbidden – because of local regulations.
Today Google Cloud powers our Beauty Tech Data Platform, which stores 100TB of production data in BigQuery and processes 20TB of data each month. We have more than 8000 governed datasets, and 2 millions of BigQuery tables coming from multiple data sources such as Salesforce, SAP, Microsoft, and Google Ads.
For more complex transformations where custom and specific libraries are required, Cloud Workflows help us to manage the complexity very efficiently by orchestrating steps in containers through Cloud Run, Cloud Functions and even BigQuery jobs — the most used way to transform and add value to the L’Oréal data.
Additionally, by using BigQuery and Google Cloud’s serverless compute for API ingestion, bulk data loading, and post-loading transformations, we can keep the entire system in a single boundary of trust at a fraction of the cost. With ingest, queries, and transformations all being fully elastic and on-demand, we no longer have to perform capacity planning for either the compute or analytics components of the system. And of course these services’ pay-as-you-go model perfectly aligns with L’Oréal’s strategy of only paying for something when you use it.
Google Cloud fulfilled the requirements of our Beauty Tech Data Platform. And as if offering us a no-ops, secure, easy-to-deploy, custom-development free, event-based platform with end-to-end supervision wasn’t enough, Google Cloud also helped us with our sustainability efforts.
Being able to measure and understand the environmental footprint of our public cloud usage is also a key part of our sustainable tech roadmap. With Google Cloud Carbon Footprint, we can easily see the impact of our sustainable infrastructure approach and architecture principles. Our Beauty Tech platform is a strategic ambition for L’Oréal: inventing the beauty products of the future while becoming the company of the future.
Sustainable tech is an imperative and a very important step towards this ambition of creating responsible beauty for our consumers, and sustainable-by-design tech services for our employees. We all have a role to play, and by joining forces, we can have a positive impact.
Google Cloud’s data ecosystem and serverless tools are highly complementary, and made it possible to build a next-generation data analytics platform that met all our needs.
Get started using serverless and BigQuery together on Google Cloud today.
S4 Agtech Transforms Agriculture with Google Cloud

7487
Of your peers have already read this article.
8:30 Minutes
The most insightful time you'll spend today!
Like countless other industries, farming is going digital and undergoing big changes—driven by access to more actionable information. The agriculture business can now gather and analyze georeferenced data from satellites, combined with data from IoT sensors in fields, crop rotation and yield histories, weather patterns, seed genotypes and soil composition to help increase the quantity and quality of crops.
This is essential for businesses in the agriculture industry, but it’s also critical to address growing food shortages around the world.
At S4, we create technology to de-risk crop production. We provide customers seeking agricultural risk management solutions with the tools to make better, data-driven decisions for their crop planning, based on machine learning and proprietary algorithms.
We interpret plant evolution on a global scale with predictive modeling and analytics, and offer super-efficient risk-transferring solutions. Our multi-cloud platform includes a petabyte-scale database, an open source stack, and—after 50 proof-of-concept evaluations—BigQuery for our data warehouse and the Cloud SQL database service to handle OLTP queries to our PostgreSQL database.
These PoCs included, among others, Microsoft Azure Data Lake Analytics, IBM Netezza, Postgres/PostGIS running on IBM bare-metal servers with SATA SSDs and on Google’s Compute Engine with NVMe disks, and on-premises memSQL, CitusData and Yandex ClickHouse.
Weeding out risk in an uncertain market
According to recent research, climate extreme events like drought, heat waves, and heavy precipitation are responsible for 18-43% of global variation in crop yields for maize, spring wheat, rice, and soybeans. This is a clear trend for other crops as well. Such variation poses risks of food shortages as well as large financial risks to farmers, insurers, and regions dependent on successful crop yields. Also, it creates vast humanitarian difficulties.
Our mission at S4 is to help de-risk crop production by matching the right data with analytics tools so farmers and other participants in the agricultural value chain can plan better, resulting in more reliable food supplies.
In a nutshell, we create indices out of biological assets. These indices measure yield losses on crops that are caused by the effects of weather and other factors, which are then used as underlying assets for products, such as swap/derivative contracts and parametric insurance policies, to transfer risk to the financial markets.
We enable insurers and lenders to buy and sell agricultural risks through the futures market. Also, our other products help farmers and seed and fertilizer companies provide customized genotype recommendations and fertilization requirements. This helps to optimize planting by geography, resources, and crop species, monitor phenological, pests and humidity evolution throughout the crop season, and estimate yields.
Local communities benefit from S4’s technology, as the ability to manage weather risks allows farmers to stabilize their cash flows, invest more to produce more with fewer risks, and develop in a more sustainable manner.
Growing data sources, reducing costs, accelerating performance
With the volume of diverse data sources and analytical complexity both growing at a very fast pace, we decided that using a major cloud services provider with a broad roadmap and global partnerships would be beneficial to S4’s future evolution.
At the same time, we wanted to bring our services to users faster and cut costs by consolidating our on-premises technology stack. When we started evaluating providers, our leading criteria included a powerful geospatial database and data analytics tools along with excellent support, all at a competitive price. GCP prevailed in nearly all criteria categories among the 50 companies we measured.
Our previous platform architecture included a hybrid relational database that used Compute Engine for virtual machines and Cloud Storage for database backup. The RDBMS was slow. Maintaining our own data warehouse was complex and expensive.
We wanted to use machine learning and neural networks, but couldn’t do so easily and affordably. The complexity of that system meant that products or services requiring small changes or additions to the data model translated to expensive expansions of infrastructure or project time.
Also, agronomical or product teams couldn’t test these changes by themselves, always requiring the intervention on no small part of the IT team, which led to further delays.
We added GCP services like BigQuery as S4’s cloud data warehouse and use BigQuery GIS for geospatial analysis, Cloud Dataflow for simplified stream and batch data processing, and Cloud SQL for queries to the S4 database platform, which have all made a huge impact on our services and bottom line.
Database and analytics costs have decreased by 40% and customers are receiving our analytical results 25% faster. In addition, we’ve eliminated the time-consuming downloading of images, reducing storage and processing costs by 80%, because we no longer need expensive tools licenses, and have greatly reduced classification processing times.
Our customers working in the agriculture industry are also benefiting from this infrastructure change. They are now able to speed up their data analytics using our GCP-based platform.
“S4 products and technologies unlock the full potential of satellite imagery for crop prescriptions, monitoring and yield estimates,” says Nicolás Loria, Manager of Marketing Services, Southern Cone, Corteva Agriscience.
“We’ve worked with S4 for the last three (and starting year number four) crop seasons as its team capabilities, data integration capacities, and analytics insights have allowed Corteva to perform an entire new solution. Thanks to S4’s customized 360° approach, fast response and delivery times, we have safely outsourced our remote crop analytic technical needs.”
Also, this new architecture has allowed us to scale our models and databases with almost no limits, at a fraction of the cost vs. the previous models.
We’ve saved a lot of time on executing processes and reduced work needed by our internal teams to do certain tasks, like preparing images, converting them, validating results, and more. Using Google Earth Engine has decreased the execution time of daily tasks anywhere from 50% to 90% of the previous time, going from an average time of 30 minutes to between four and 15 minutes, depending on the task.
In addition to saving money and time, we are able to focus on innovation with the GCP performance and features we’re using. We’re able to seamlessly add satellite data to analytics using both public datasets and our own private data, and deliver GIS data management, analytics, crop classification and monitoring in real time.
We can do semi-automatic crop classification and classification using spectral signatures with Google Earth Engine. Later this year, we’ll be using neural networks for pattern recognition and machine learning in new applications to improve crop yields and fine-tune risk models. And using GCP and Google Earth Engine infrastructure means we can run models for customers in South America and around the world, since Google Earth Engine has global satellite imagery available.
We’ve heard from our customer Indigo Argentina that they’re able to bring customers data insights faster.
“We are working with S4 in the development of two different applications for satellite crop monitoring and yield assessment,” says Carlos Becco, CEO, Indigo Argentina. “S4’s technology allowed us to manage and analyze multiple sources and layers of information in real time, letting us uncover valuable insights in Indigo’s own microbiome technologies, and at a very competitive cost.”
Analytical products and app development thrive with GCP
With GCP, we are updating and improving algorithms that we built manually with machine learning processes to develop drought indices for upcoming crop seasons. Algorithms can recognize specific phases of crop phenology (e.g., bud burst, flowering, fruiting, leaf fall) and correlate them with photosynthetic activity, light, water, temperature, radiation, and plant genetics factors. Other analytical products like crop monitoring, pre-planting recommendations, financial scoring, and yield estimation can now do a lot more for users by offering multiple layers and datasets, faster image processing, and real-time access via APIs.
We also replaced our bare-metal S4 app deployment with the App Engine serverless application platform. It provides tighter integration between the S4 platform and our BigQuery data warehouse for integration with marketplaces and third-party solutions.
We get all of these Google Cloud features with all the benefits of managed cloud services, from multiversioning and security to automatic backups and high availability.
At S4, we trust technology to decode plant growth and help protect farmers and their communities from climate change. With growing food shortages due to increasing populations and intensifying weather, data and analytics can have a huge impact in lowering financial risks and improving agricultural yields. It’s one sector where cloud, database, analytics, and other technologies are combining to improve business outcomes and affect the lives of billions of people. Learn more about S4’s work and learn more about data analytics on Google Cloud.
A Comprehensive Guide for Understanding and Optimizing Your Dataflow Costs

1183
Of your peers have already read this article.
3:30 Minutes
The most insightful time you'll spend today!
Dataflow is the industry-leading platform that provides unified batch and streaming data processing capabilities, and supports a wide variety of analytics and machine learning use cases. It’s a fully managed service that comes with flexible development options (from Flex Templates and Notebooks to Apache Beam SDKs for Java, Python and Go), and a rich set of built-in management tools. It seamlessly integrates with not just Google Cloud products like Pub/Sub, BigQuery, Vertex AI, GCS, Spanner, and BigTable, but also third-party services like Kafka and AWS S3, to best meet your analytics and machine learning needs.
Dataflow’s adoption has ramped up in the past couple of years, and numerous customers now rely on Dataflow for everything from designing small proof of concepts, to large-scale production deployments. As customers are always trying to optimize their spend and do more with less, we naturally get questions related to cost optimization for Dataflow.
In this post, we’ve put together a comprehensive list of actions you can take to help you understand and optimize your Dataflow costs and business outcomes, based on our real-world experiences and product knowledge. We’ll start by helping you understand your current and near-term costs. We’ll then share how you can continuously evaluate and optimize your Dataflow pipelines over time. Let’s dive in!
Understand your current and near-term costs
The first step in most cost optimization projects is to understand your current state. For Dataflow, this involves the ability to effectively:
- Understand Dataflow’s cost components
- Predict the cost of potential jobs
- Monitor the cost of submitted jobs
Understanding Dataflow’s cost components
Your Dataflow job will have direct and indirect costs. Direct costs reflect resources consumed by your job, while indirect costs are incurred by the broader analytics/machine learning solution that your Dataflow pipeline enables. Examples of indirect costs include usage of different APIs invoked from your pipeline, such as:
- BigQuery Storage Read and Write APIs
- Cloud Storage APIs
- BigQuery queries
- Pub/Sub subscriptions and publishing, and
- Network egress, if any
Direct and indirect costs influence the total cost of your Dataflow pipeline. Therefore, it’s important to develop an intuitive understanding of both components, and use that knowledge to adopt strategies and techniques that help you arrive at a truly optimized architecture and cost for your entire analytics or machine learning solution. For more information about Dataflow pricing, see the Dataflow pricing page.
Predict the cost of potential jobs
You can predict the cost of a potential Dataflow job by initially running the job on a small scale. Once the small job is successfully completed, you can use its results to extrapolate the resource consumption of your production pipeline. Plugging those estimates into the Google Cloud Pricing Calculator should give you the predicted cost of your production pipeline. For more details about predicting the cost of potential jobs, see this (old, but very applicable) blog post on predicting the cost of a Dataflow job.
Monitor the cost of submitted jobs
You can monitor the overall cost of your Dataflow jobs using a few simple tools that Dataflow provides out of the box. Also, as you optimize your existing pipelines, possibly using recommendations from this blog post, you can monitor the impact of your changes on performance, cost, or other aspects of your pipeline that you care about. Handy techniques for monitoring your Dataflow pipelines include:
- Use metrics within the Dataflow UI to monitor key aspects of your pipeline.
- For CPU intensive pipelines, profile the pipeline to gain insight into how CPU resources are being used throughout your pipeline.
- Experience real-time cost control by creating monitoring alerts on Dataflow job metrics which ship out of the box, and that can be good proxies for the cost of your job. These alerts send real-time notifications once the metrics associated with a running pipeline exceeds a predetermined threshold. We recommend that you only do this for your critical pipelines, so you can avoid notification fatigue.
- Enable Billing Export into BiqQuery, and perform deep, ad-hoc analyses of your Dataflow costs that help you understand not just the key drivers of your costs, but also how these drivers are trending over time.
- Create a labeling taxonomy, and add labels to your Dataflow jobs that help facilitate cost attribution during the ad-hoc analyses of your Dataflow cost data using BigQuery. Check out this blog post for some great examples of how to do this.
- Run your Dataflow jobs using a custom Service Account. While this is great from a security perspective, it also has the added benefit of enabling the easy identification of APIs used by your Dataflow job.
Optimize your Dataflow costs
Once you have a good understanding of your Dataflow costs, the next step is to explore opportunities for optimization. Topics to be considered during this phase of your cost optimization journey include:
- Your optimization goals
- Key factors driving the cost of your pipeline
- Considerations for developing optimized batch and streaming pipelines
Let’s look at each of these topics in detail.
Goals
The goal of a cost optimization effort may seem obvious: “reduce my pipeline’s cost.” However, your business may have other priorities that have to be carefully considered and balanced with the cost reduction goal. From our conversations with customers, we have found that most Dataflow cost optimization programs have two main goals:
1. Reduce the pipeline’s cost
2. Continue meeting the service level agreements (SLAs) required by the business
Cost factors
Opportunities for optimizing the cost of your Dataflow pipeline will be based on the key factors driving your costs. While most of these factors will be identified through the process of understanding your current and near term costs, we have identified a set of frequently recurring cost factors, which we have grouped into three buckets: Dataflow configuration, performance, and business requirements.
Dataflow configuration includes factors like:
- Should your pipeline be streaming or batch?
- Are you using Dataflow services like Streaming Engine, or FlexRS?
- Are you using a suitable machine type and disk size?
- Should your pipeline be using GPUs?
- Do you have the right number of initial and maximum workers?
Performance includes factors like:
- Are your SDK versions (Java, Python, Go) up to date?
- Are you using IO connectors efficiently? One of the strengths of Apache Beam is a large library of IO connectors to different storage and queueing systems. Apache Beam IO connectors are already optimized for maximum performance. However, there may be cases where there are trade-offs between cost and performance. For example, BigQueryIO supports several write methods, each of them with somewhat different performance and cost characteristics. For more details, see slides 19 – 22 of the Beam Summit session on cost optimization.
- Are you using efficient coders? Coders affect the size of the data that needs to be saved to disk or transferred to a dedicated shuffle service in the intermediate pipeline stages, and some coders are more efficient than others. Metrics like total shuffle data processed and total streaming data processed can help you identify opportunities for using more efficient coders. As a general rule, you should consider whether the data that appears in your pipeline contains redundant data that can be eliminated by both filtering out unused columns as early as possible, and using efficient coders such as AvroCoder or RowCoder. Also, remember that if stages of your pipeline are fused, the coders in the intermediate steps become irrelevant.
- Do you have sufficient parallelism in your pipeline? The execution details tab, and metrics like processing parallelism keys can help you determine whether your pipeline code is taking full advantage of Apache Beam’s ability to do massively parallel processing (for more details, see parallelism). For example, if you have a transform which outputs a number of records for each input record (“high fan-out transform”) and the pipeline is automatically optimized using Dataflow fusion optimization, the parallelism of the pipeline can be suboptimal, and may benefit from preventing fusion. Another area to watch for is “hot keys.” This blog discusses this topic in great detail.
- Are your custom transforms efficient? Job monitoring techniques like profiling your pipeline and viewing relevant metrics can help you catch and correct your inefficient use of custom transforms. For example, if your Java transform needs to check if the data matches a certain regular expression pattern, then compiling that pattern in the setup method and doing the matching using the precompiled pattern in the “process element” method is much more efficient. The simpler, but inefficient alternative is to use the String.matches() call in the “process element” method, which will have to compile the pattern every time. Another consideration regarding custom transforms is that grouping elements for external service calls can help you prepare optimal request batches for external API calls. Finally, transforms that perform multi-step operations (for example, calls to external APIs that require extensive processes for creating and closing the client for the API) can often benefit from splitting these operations, and invoking them in different methods of the ParDo (for more details, see ParDo life cycle).
- Are you doing excessive logging? Logs are great. They help with debugging, and can significantly improve developer productivity. On the other hand, excessive logging can negatively impact your pipeline’s performance.
Business requirements can also influence your pipeline’s design, and increase costs. Examples of such requirements include:
- Low end-to-end ingest latency
- Extremely high throughput
- Processing late arriving data
- Processing streaming data spikes
Considerations for developing optimized data pipelines
From our work with customers, we have compiled a set of guidelines that you can easily explore and implement to effectively optimize your Dataflow costs. Examples of these guidelines include:
Batch and streaming pipelines:
- Consider keeping your Dataflow job in the same region as your IO source and destination services.
- Consider using GPUs for specialized use cases like deep-learning inference.
- Consider specialized machine types for memory- or compute-intensive workloads.
- Consider setting the maximum number of workers for your Dataflow job.
- Consider using custom containers to pre-install pipeline dependencies, and speed up worker startup time.
- Where necessary, tune the memory of your worker VMs.
- Reduce your number of test and staging pipelines, and remember to stop pipelines that you no longer need.
Batch pipelines:
- Consider FlexRS for use cases that have start time and run time flexibility.
- Run fewer pipelines on larger datasets. Starting and stopping a pipeline incurs some cost, and processing a very small dataset in a batch pipeline can be inefficient.
- Consider defining the maximum duration for your jobs, so you can eliminate runaway jobs, which keep running without delivering value to your business.
Summary
In this post, we introduced you to a set of knowledge and techniques that can help you understand the current and near-term costs associated with your Dataflow pipelines. We also shared a series of considerations that can help you optimize your Dataflow pipelines, not just for today, but also as your business evolves over time. We shared lots of resources with you, and hope that you find them useful. We look forward to hearing about the savings and innovative solutions that you are able to deliver for your customers and your business.
2855
Of your peers have already watched this video.
17:30 Minutes
The most insightful time you'll spend today!
GCP for Bioinformatics
Join Cloud GDE and developer Lynn Langit in this fast-paced session to get resources you can use to learn how to use the Google Cloud Platform for bioinformatics.
Lynn has created an open source course (on GitHub) to introduce researchers to using GCP to scale their analysis jobs. In this short talk, she’ll guide you through her course materials, so that you can get started learning using examples from genomics.
She talks is divided into four parts:
- What is needed?
- Why do we need to have patterns?
- How can you use pattern information,
- How can you learn more.
More Relevant Stories for Your Company


How Go-Jek, Indonesia’s First Billion-dollar Startup, Improved the Productivity of Data Scientists
Go-Jek, Indonesia’s first billion-dollar startup, has seen an incredible amount of growth in both users and data over the past two years. Many of the ride-hailing company's services are backed by machine learning models hosted on Google Cloud Platform. Models range from driver allocation, to dynamic surge pricing, to food

Vodafone Leverages Google Cloud to Aid COVID-19 Frontline with Anonymized Insights on Population Mobility
Editor’s note: When Europe’s largest mobile communications company, Vodafone, was asked by the European Commission to help understand population movement across the European Union and the UK to help fight COVID-19, it was able to provide anonymized mobile network-based insights to answer the call. Here’s how Vodafone, with the support
Smart analytics: Deep dive on roadmap
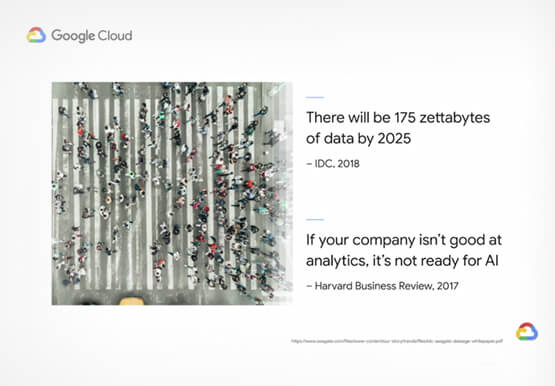
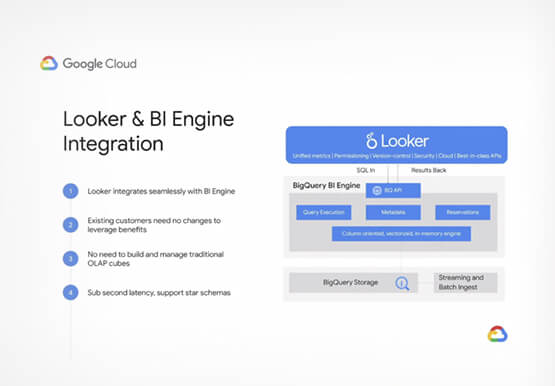
Data across organizations is growing and that organizations need a very strong analytics platform to leverage this data create insights and make real-time decisions on top of this data. That’s driving the advent of three large trends. First is the convergence of data lakes and data warehouses, that’s enable organizations

ActivStat: Enhancing Live Sports Broadcast with Real-time Stats and Metrics
Millions of people annually view esports, as top players and teams compete in thrilling, fast-paced tests of reflexes, strategy, and teamwork. Fans are a diverse group, sharing a passion for action. A new, revolutionary project we’re working on with Call of Duty League just made that action a lot better.
