





HarbourBridge Schema Assistant Allows Quick, Bulk Migration to Cloud Spanner

5473
Of your peers have already read this article.
1:30 Minutes
The most insightful time you'll spend today!
Today we’re announcing the HarbourBridge Schema Assistant, which provides a guided schema-design workflow for migrating from MySQL or PostgreSQL to Spanner. HarbourBridge imports dump files (from mysqldump or pg_dump) or directly connects to your source database, and converts the source database schema to an equivalent Spanner schema. The new Schema Assistant capability displays the source schema and Spanner schema side-by-side, highlights errors and walks you through a series of steps to validate and optimize your Spanner schema. It also produces a browsable assessment report with an overall migration-fitness score for Spanner, a table-by-table detailed analysis of type mappings and a list of features used in the source database that aren’t supported by Spanner. It supports editing of table and column names, column types, primary keys and constraints, as well as dropping of tables, columns, foreign keys and secondary indexes.
The new Schema Assistant complements HarbourBridge’s existing data and schema migration capabilities and is a critical step towards our goal of building a complete open-source migration toolkit. HarbourBridge continues to support command-line schema and data migration and turn-key Spanner evaluation.
Complementing the bulk data migration capabilities of HarbourBridge, we are also announcing the ability to migrate change events from MySQL to Cloud Spanner.
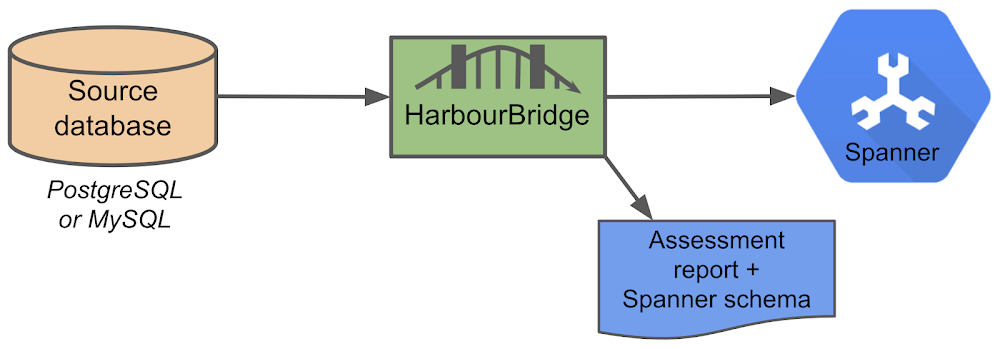
Supported Features in Schema Assistant
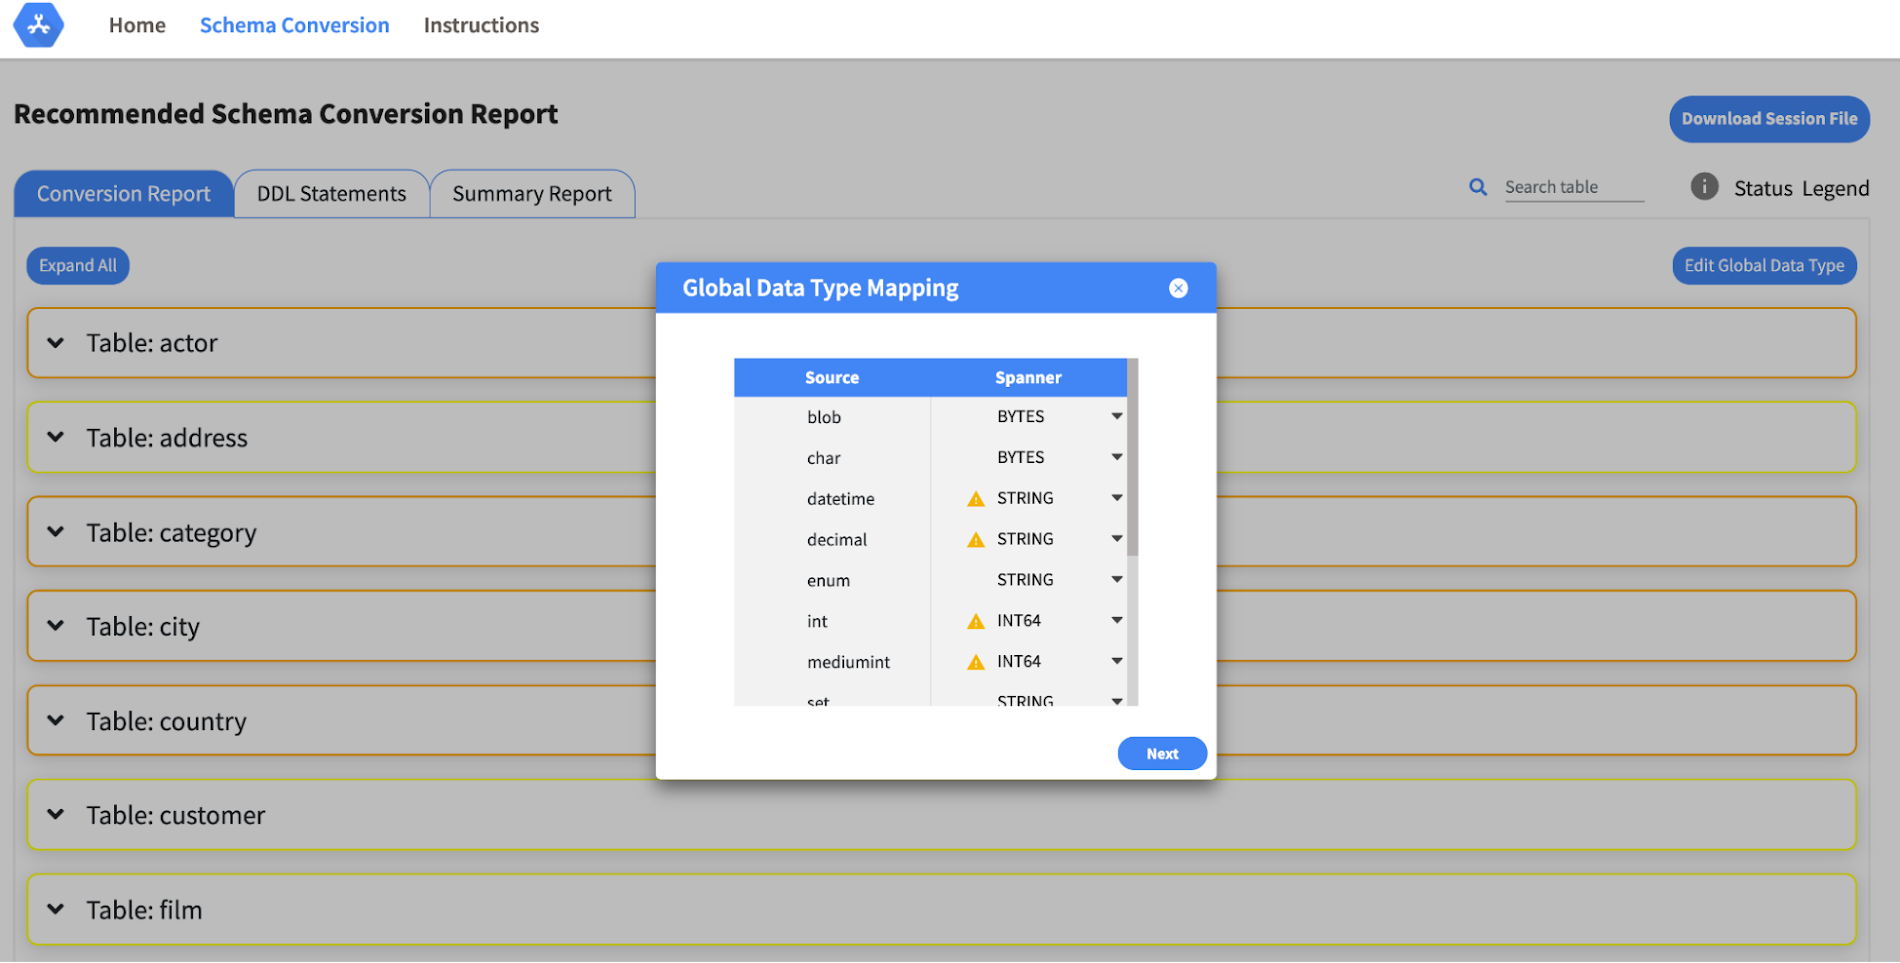
- Global type mapping. Users can customize the global mapping for how types should be mapped to Spanner consistently across the schema. For example, mapping large integers in source schema to Spanner’s NUMERIC.
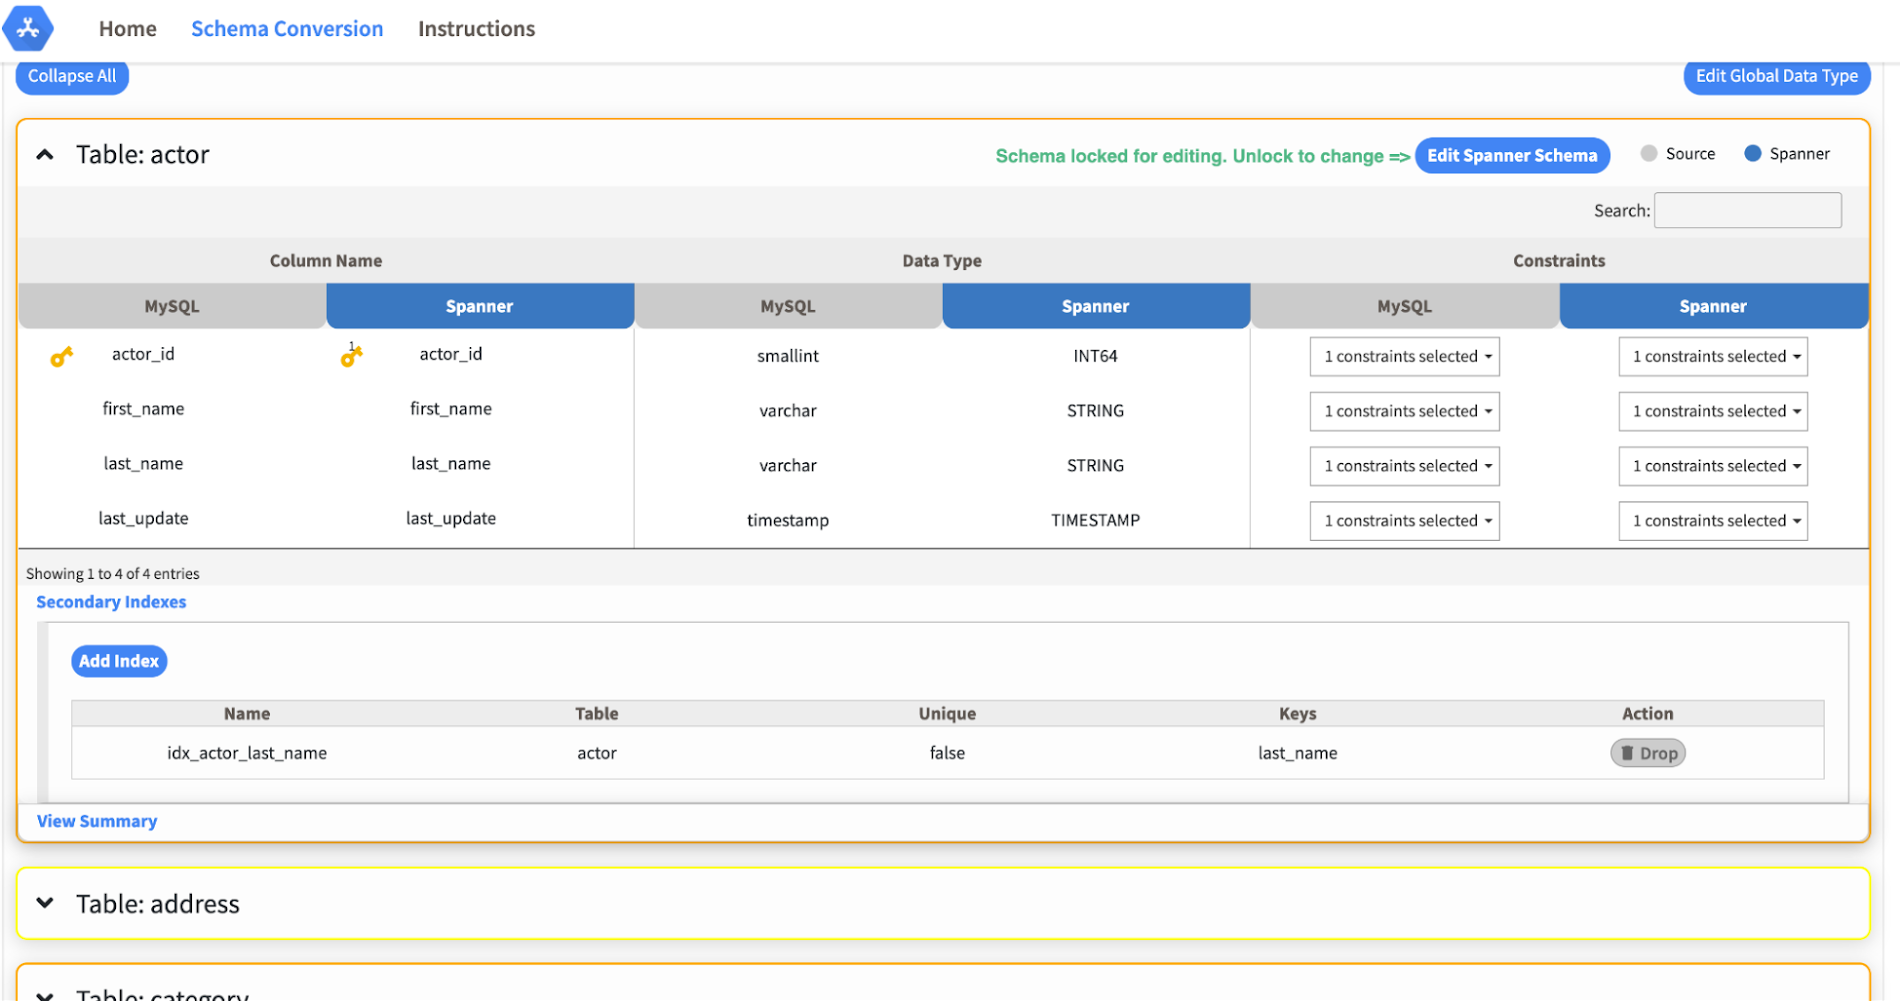
- Local type mapping. Users can override the custom type mapping for a given table/column.
- Session management. A session keeps track of all the changes made to the schema mapping.
- Customization of secondary indexes. Users can add, edit and delete secondary indexes to optimize their Spanner performance.
- Customization of foreign keys and interleaved tables. Table interleaving is an important design consideration when migrating to Cloud Spanner as explained in more detail in this blog post.
Features in the pipeline
We are already working to further expand the supported set of schema editing features and welcome your feedback. We are particularly excited to expand the Schema Assistant’s design recommendations for optimizing Spanner schemas e.g. in-depth recommendations for primary key design.
HarbourBridge is open source and we gladly accept contributions from the wider community.
Cloud Spanner Powers Vimeo to Deliver Consistent UX for across Content

3516
Of your peers have already read this article.
3:00 Minutes
The most insightful time you'll spend today!
Editor’s note: The video platform Vimeo leverages managed database services from Google Cloud to serve up billions of views around the world each day. Here’s how they deliver a consistent user experience across all their content.
Vimeo is the world’s leading video software solution, powering hundreds of thousands of new uploads every day and billions of views. At our scale, it’s paramount that we retain a seamless user experience across all of the videos hosted, shared, and viewed on our platform. With managed database services from Google Cloud, we’ve been able to deliver a consistent and reliable user experience no matter where our users and their audiences are.
https://youtube.com/watch?v=ggpAUgEL2iE%3Fenablejsapi%3D1%26
Outgrowing the data center and gaining more scale
Our first exposure to Google Cloud was the excellent performance between Google Compute Engine (GCE) and Google Cloud Storage (GCS), which we used to design a really high quality playback and upload environment for our customers’ videos. At first we were simply creating cloud-based packaging and delivery of their content, but the bulk of our application ran on an on-premises MySQL database. Seeing the gains from our initial investment in GCE and GCS, we decided to fully migrate to Google Cloud.
We started by lifting and shifting our workloads from our on-premises deployments to GCE. But we quickly realized we had to redesign our application to deliver higher availability and responsiveness for an exceptional user experience, which led us to Cloud Spanner, a distributed SQL database management and storage service. With Spanner, we found all the benefits of a relational semantics database with global scale, allowing us to add more nodes with the push of a button.
Today we have a multi-region instance with 99.999% uptime, so we’re confident it can handle our video workloads. We use about 16 Spanner nodes to cover approximately 50.8 billion rows and about 4.5 terabytes of storage/disk space. And with the launch of Video Library, we have the scale we need to fundamentally change the way organizations handle content.
Using Spanner as a time machine during migration
During the initial migration, we wanted to ensure an accurate data transfer with as few errors or bugs as possible. When we moved data from MySQL tables into Spanner, we ran spot analyses to check for potential problems. If the data didn’t match, Spanner allowed us to revert to the original in a single click. Through Spanner we could check stale timestamps or past users. It almost functioned like a time machine by offering point-in-time recovery functionality.
Serving up any video at any time
We work with a long tail of content. Depending on how popular a video is, we take a different approach to storing it. We cache the most popular material so it’s immediately accessible and use Cloud Spanner to ensure it’s highly available across multiple regions. On the flip side, we use Cloud SQL for some lower volume satellite services that support other components of the application that don’t require the same guarantees or performance that Cloud Spanner provides.
As our millions of users continue to upload their own videos, Spanner also acts as a video metadata indexing and cataloging service. When we need to play back a particular video, we can quickly and easily find it in a sea of content. It’s crucial that our database is highly available and reliable so the playback experience is seamless for our users.
To learn more about Vimeo, visit our site.
Learn more about how your organization can use Cloud Spanner.
What Swiggy and You Can Learn From This Company’s Use of ML to Engage Customers

9653
Of your peers have already read this article.
1:45 Minutes
The most insightful time you'll spend today!
The app economy has enabled a huge range of unique business models to flourish. One such model is online food ordering and delivery services, in which apps leverage geo-location data to aggregate local food choices and offer personalized options to consumers.
A leading company in this space is Just Eat. Launched in the UK in 2001 with a vision of ‘serving the world’s greatest menu. Brilliantly.’ The company has capitalized on the popularity of online food delivery and grown its presence across 12 markets.
Just Eat acts as an intermediary between take-out food outlets and hungry customers, giving local restaurants access to a broader base of potential diners, while providing consumers with an easy and secure way to order and pay for food from their favourite restaurants.
Today the company helps 27 million customers find food from more than 112,000 restaurants—everything from homemade Italian pasta, to Chinese noodle bowls, to fish-and-chips.
Data is the fuel of Just Eat’s rapid growth, but it wasn’t always looked at that way. In its early days, Just Eat struggled with the deluge of information and faced fragmentation across its systems. In fact, the company realized its legacy data vendor wasn’t capable of ingesting 90 percent of the data produced by its food platform. This was incredibly frustrating for Just Eat’s analysts and data scientists, who had to waste time cleaning up sources instead of leveraging the data to create a better user experience.
Just Eat turned to Google Cloud, and now uses machine learning (ML) to power sophisticated consumer recommendations on both its app and website. It also makes heavy use of features offered by Google Cloud Platform, including BigQuery for running analytics on its customer data set and Cloud Pub/Sub for messaging app users with relevant offers in real-time.
Having all of Just Eat’s data in one platform has translated into real value for its customers. With Google Cloud tools, Just Eat has created its own proprietary Customer Ontology framework, which today contains 5.5 billion features that better understand consumers’ behavior and food habits, and provides insights into previous visits.
Just Eat recently created an “Adventurous Index” to map its customers according to their ordering habits, enabling them to tailor their marketing and user experiences. For example, mid-adventurous customers are shown a choice of restaurants that serve their most ordered cuisine, while adventurous customers can choose from restaurants that serve a wider variety. This not only has prompted consumers to be more adventurous with their choices, but also has led to more business at a more diverse set of restaurants.
Matt Cresswell, Director of Customer Platforms at Just Eat said that Google Cloud has become integral to its product delivery: “Consumer food choice is a hugely nuanced topic. We know that individuals have their own unique journeys when they use Just Eat. We’ve sought to create a truly one-to-one relationship with every customer. The changes we’ve made to the platform mean they can access the dishes they enjoy at the touch of a fingertip, and find inspiration to discover new dishes they’ll love. We’re grateful to Google Cloud for helping us support our customers on their culinary explorations.”
BigQuery Admin Reference Guide Series: How to Optimize Data in Your Native Storage

3729
Of your peers have already read this article.
4:00 Minutes
The most insightful time you'll spend today!
So far on the BigQuery Admin Reference Guide series, we’ve talked about the different logical resources available inside of BigQuery. Now, we’re going to begin talking about BigQuery’s architecture. In this post we’re diving into how BigQuery stores your data in native storage, and what levers you can pull to optimize how your data is stored.
Columnar storage format
BigQuery offers fully managed storage, meaning you don’t have to provision servers. Sizing is done automatically and you only pay for what you use. Because BigQuery was designed for large scale data analytics data is stored in columnar format.
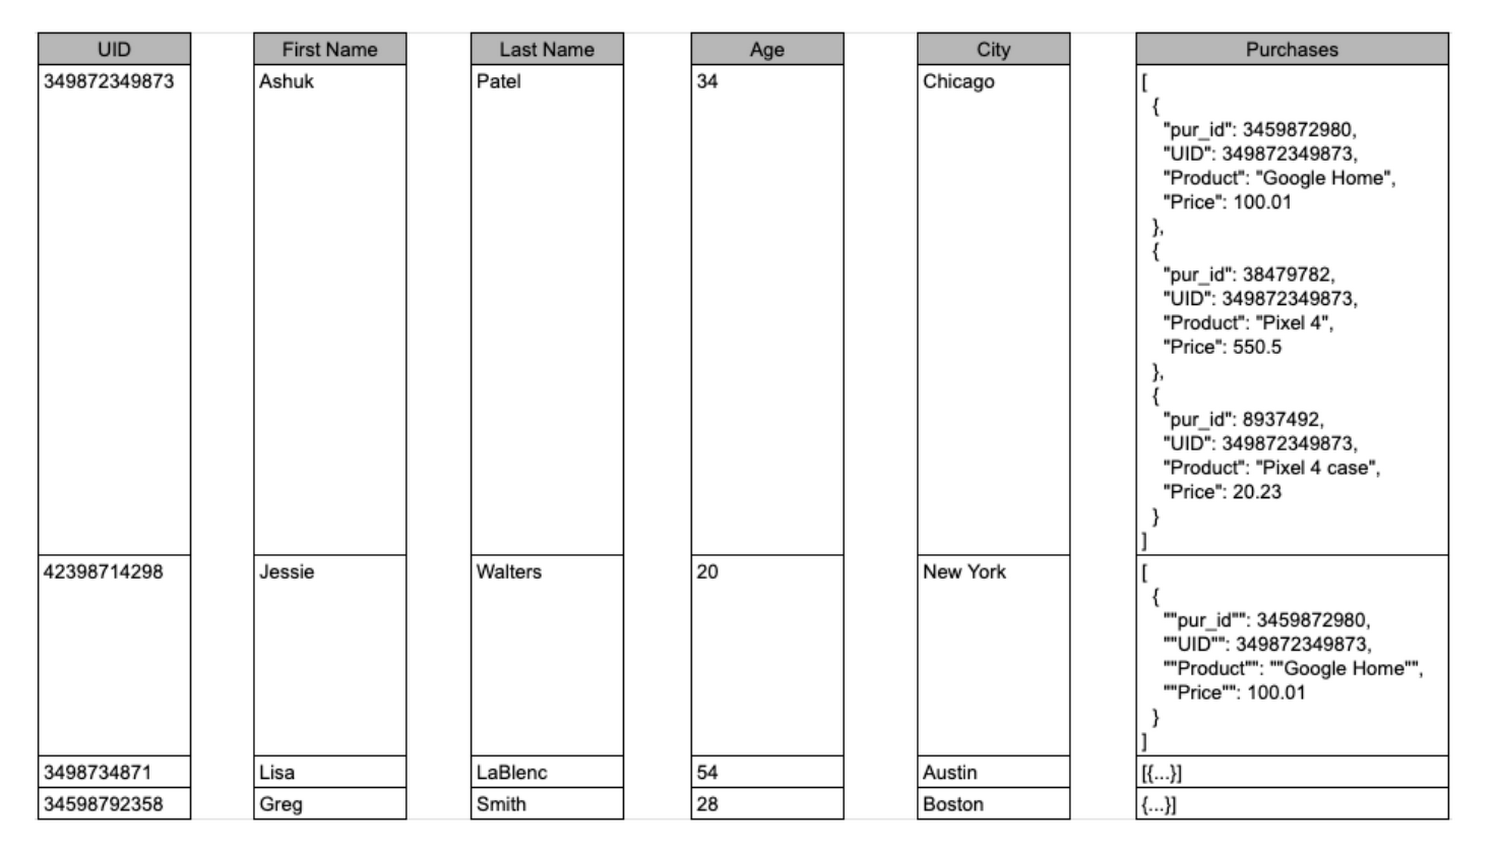
Traditional relational databases, like Postgres and MySQL, store data row-by-row in record-oriented storage. This makes them great for transactional updates and OLTP (Online Transaction Processing) use cases because they only need to open up a single row to read or write data. However, if you want to perform an aggregation like a sum of an entire column, you would need to read the entire table into memory.
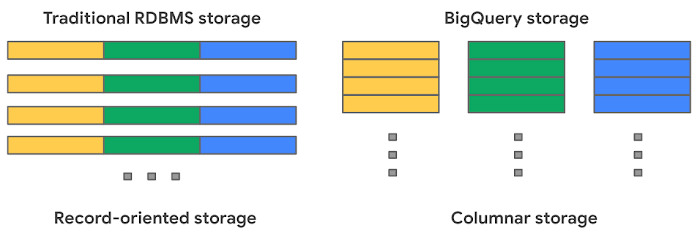
BigQuery uses columnar storage where each column is stored in a separate file block. This makes BigQuery an ideal solution for OLAP (Online Analytical Processing) use cases. When you want to perform aggregations you only need to read the column that you are aggregating over.
Optimized storage format
Internally, BigQuery stores data in a proprietary columnar format called Capacitor. We know Capacitor is a column-oriented format as discussed above. This means that the values of each field, or column, are stored separately so the overhead of reading the file is proportional to the number of fields you actually read. This doesn’t necessarily mean that each column is in its own file, it just means that each column is stored in a file block, which is actually compressed independently for increased optimization.
What’s really cool is that Capacitor builds an approximation model that takes in relevant factors like the type of data (e.g. a really long string vs. an integer) and usage of the data (e.g. some columns are more likely to be used as filters in WHERE clauses) in order to reshuffle rows and encode columns. While every column is being encoded, BigQuery also collects various statistics about the data — which are persisted and used later during query execution.
If you want to learn more about Capacitor, check out this blog post from Google’s own Chief BigQuery Officer.
Encryption and managed durability
Now that we understand how the data is saved in specific files, we can talk about where these files actually live. BigQuery’s persistence layer is provided by Google’s distributed file system, Colossus, where data is automatically compressed, encrypted, replicated, and distributed.
There are many levels of defense against unauthorized access in Google Cloud Platform, one of them being that 100% of data is encrypted at rest. Plus, if you want to control encryption yourself, you can use customer-managed encryption keys.
Colossus also ensures durability by using something called erasure encoding – which breaks data into fragments and saves redundant pieces across a set of different disks. However, to ensure the data is both durable and available, the data is also replicated to another availability zone within the same region that was designated when you created your dataset.
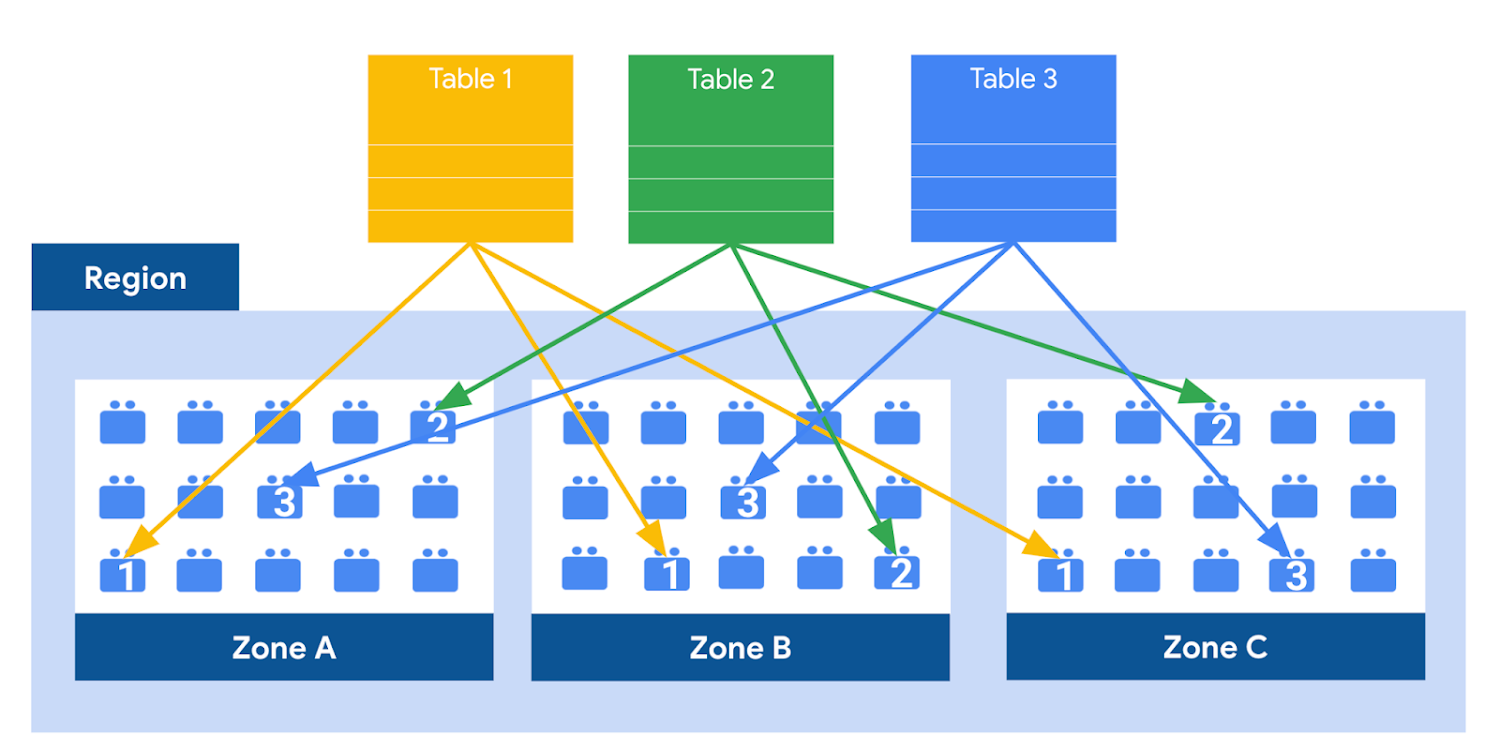
This means data is saved in a different building that has a different power system and network. The chances of multiple availability zones going offline at once is very small. But if you use “Multi-Region” locations – like the US or EU – BigQuery stores another copy of the data in an off-region replica. That way, the data is recoverable in the event of a major disaster.
This is all accomplished without impacting the compute resources available for your queries. Plus encoding, encryption and replication are included in the price of BigQuery storage – no hidden costs!
Optimizing storage for query performance
BigQuery has a built-in storage optimizer that helps arrange data into the optimal shape for querying, by periodically rewriting files. Files may be written first in a format that is fast to write but later BigQuery will format them in a way that is fast to query. Aside from the optimization happening behind the scenes, there are also a few things you can do to further enhance storage.
Partitioning
A partitioned table is a special table that is divided into segments, called partitions. BigQuery leverages partitioning to minimize the amount of data that workers read from disk. Queries that contain filters on the partitioning column can dramatically reduce the overall data scanned, which can yield improved performance and reduced query cost for on-demand queries. New data written to a partitioned table is automatically delivered to the appropriate partition.
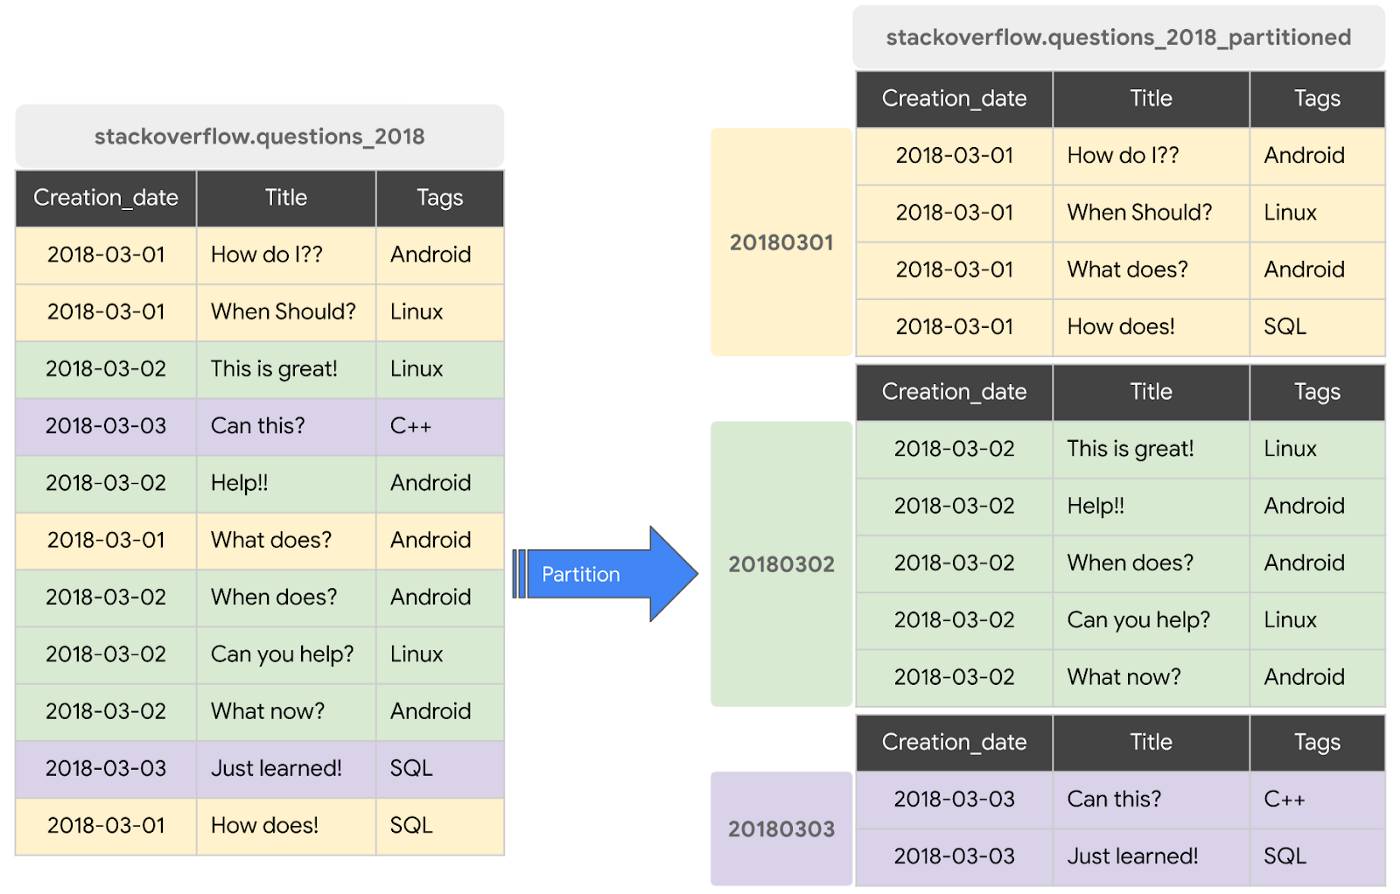
BigQuery supports the following ways to create partitioned tables:
- Ingestion time partitioned tables: daily partitions reflecting the time the data was ingested into BigQuery. This option is useful if you’ll be filtering data based on when new data was added. For example, the new Google Trends Dataset is refreshed each day, you might only be interested in the latest trends.
- Time-unit column partitioned tables: BigQuery routes data to the appropriate partition based on date value in the partitioning column. You can create partitions with granularity starting from hourly partitioning. This option is useful if you’ll be filtering data based on the date value in the table, for example looking at the most recent transactions by including a WHERE clause for transaction_created_date
- INTEGER range partitioned tables: Partitioned based on an integer column that can be bucketed. This option is useful if you’ll be filtering data based on an integer column in the table, for example focusing on specific customers using customer_id. You can bucket the integer values to create appropriately sized partitions, like having all customers with IDs from 0-100 in the same partition.
Partitioning is a great way to optimize query performance, especially for large tables that are often filtered down during analytics. When deciding on the appropriate partition key, make sure to consider how everyone in your organization is leveraging the table. For large tables that could cause some expensive queries, you might want to require partitions to be used.
Partitions are designed for places where there is a large amount of data and a low number of distinct values. A good rule of thumb is making sure partitions are greater than 1 GB. If you over partition your tables, you’ll create a lot of metadata – which means that reading in lots of partitions may actually slow down your query.
Clustering
When a table is clustered in BigQuery, the data is automatically sorted based on the contents of one or more columns (up to 4, that you specify). Usually high cardinality and non-temporal columns are preferred for clustering, as opposed to partitioning which is better for fields with lower cardinality. You’re not limited to choosing just one, you can have a single table that is both partitioned and clustered!
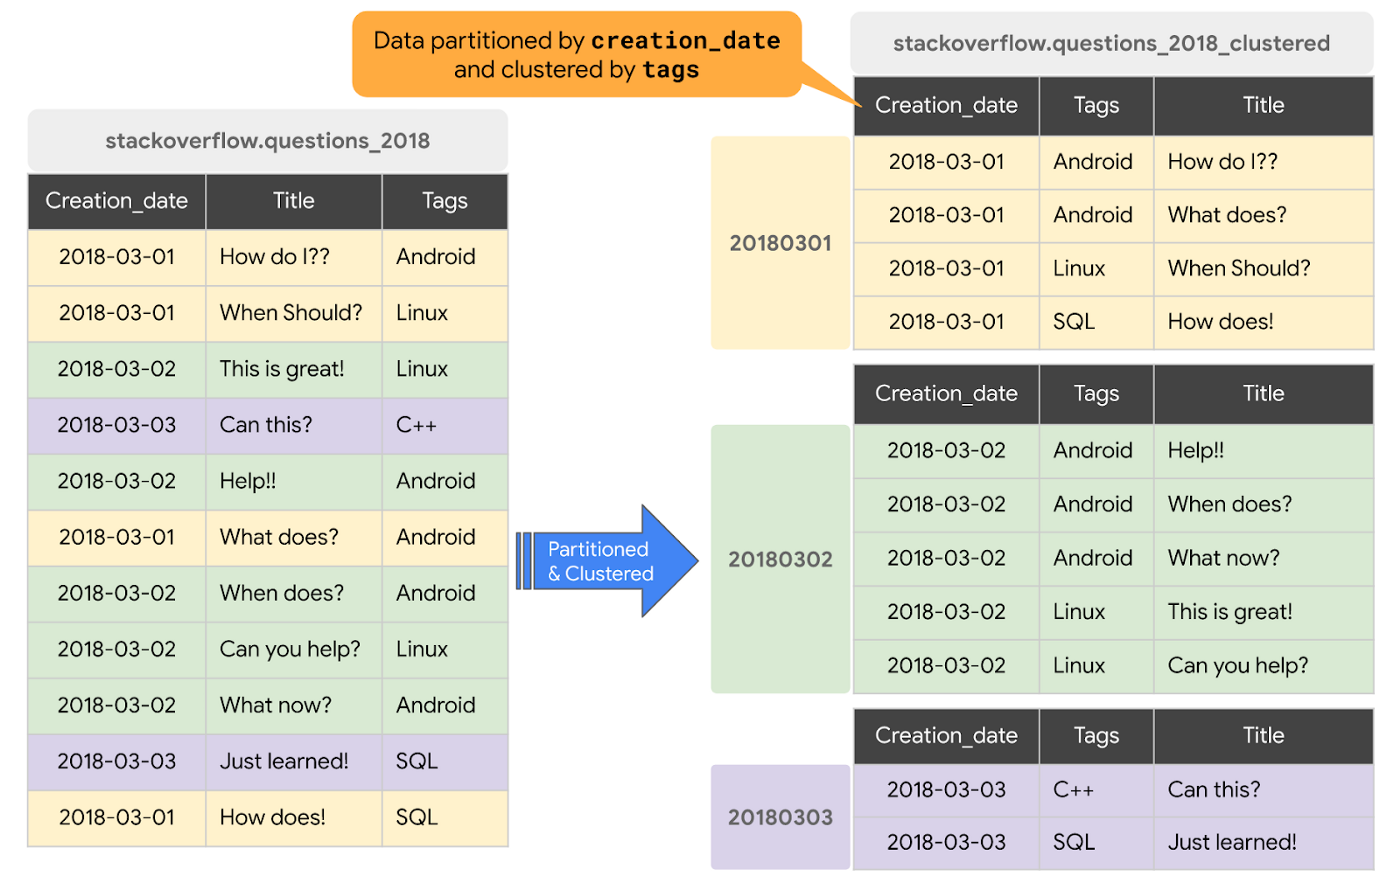
The order of clustered columns determines the sort order of the data. When new data is added to a table or a specific partition, BigQuery performs free, automatic re-clustering in the background. Specifically, clustering can improve the performance for queries:
- Containing where clauses with a clustered column: BigQuery uses the sorted blocks to eliminate scans of unnecessary data. The order of the filters in the where clause matters, so use filters that leverage clustering first
- That aggregate data based on values in a clustered column: performance is improved because the sorted blocks collocate rows with similar values
- With joins where the join key is used to cluster the table: less data is scanned, for some queries this offers a performance boost over partitioning!
Looking for some more information and example queries? Check out this blog post!
Denormalizing
If you come from a traditional database background, you’re probably used to creating normalized schemas – where you optimize your structure so that data is not repeated. This is important for OLTP workloads (as we discussed earlier) because you’re often making updates to the data. If your customer’s address is stored every place they have made a purchase, then it might be cumbersome to update their address if it changes.
However, when performing analytical operations on normalized schemas, usually multiple tables need to be joined together. If we instead denormalize our data, so that information (like the customer address) is repeated and stored in the same table, then we can eliminate the need to have a JOIN in our query. For BigQuery specifically, we can also take advantage of support for nested and repeated structures. Expressing records using STRUCTs and ARRAYs can not only provide a more natural representation of the underlying data, but in some cases it can also eliminate the need to use a GROUP BY statement. For example, using ARRAY_LENGTH instead of COUNT.
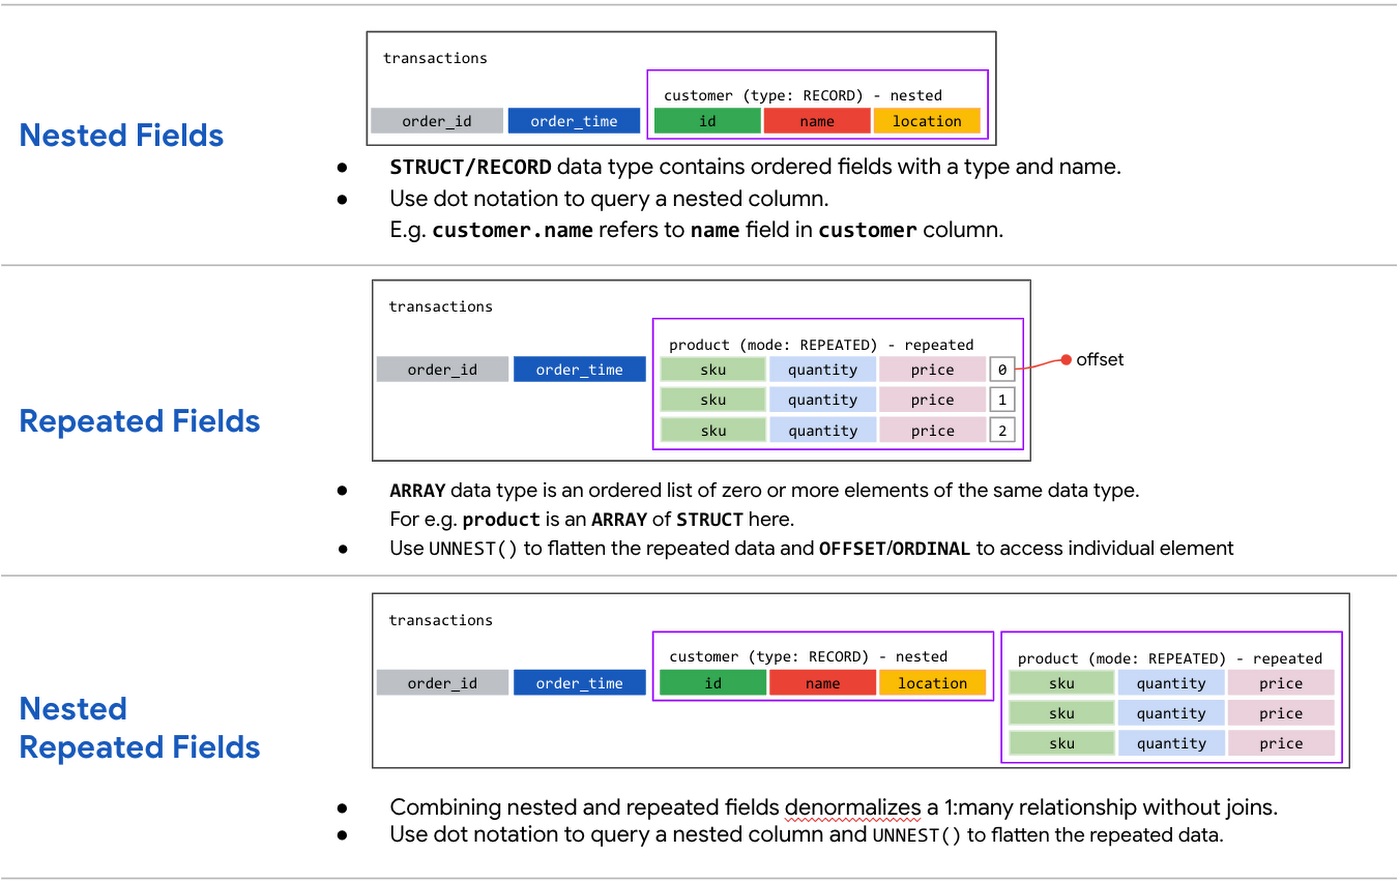
Keep in mind that denormalization has some disadvantages. First off, they aren’t storage-optimal. Although, many times the low cost of BigQuery storage addresses this concern. Second, maintaining data integrity can require increased machine time and sometimes human time for testing and verification. We recommend that you prioritize partitioning and clustering before denormalization, and then focus on data that rarely requires updates.
Optimizing for storage costs
When it comes to optimizing storage costs in BigQuery, you may want to focus on removing unneeded tables and partitions. You can configure the default table expiration for your datasets, configure the expiration time for your tables, and configure the partition expiration for partitioned tables. This can be especially useful if you’re creating materialized views or tables for ad-hoc workflows, or if you only need access to the most recent data.
Additionally, you can take advantage of BigQuery’s long term storage. If you have a table that is not used for 90 consecutive days, the price of storage for that table automatically drops by 50 percent to $0.01 per GB, per month. This is the same cost as Cloud Storage Nearline, so it might make sense to keep older, unused data in BigQuery as opposed to exporting it to Cloud Storage.Thanks for tuning in this week! Next week, we’re talking about query processing – a precursor to some query optimization techniques that will help you troubleshoot and cut costs. Be sure to stay up-to-date on this series by following me on LinkedIn and Twitter!
Incorporating Custom Holidays into Your Time-Series Models with BigQuery ML

1121
Of your peers have already read this article.
4:30 Minutes
The most insightful time you'll spend today!
About three years ago, JCB, one of the biggest Japanese payment companies, launched a project to develop new high-value services with agility. We set up a policy of starting small from scratch without using the existing system, which we call the concept of “Dejima”, where we focused on improving various aspects such as team structure, risk management, and application and platform development process.
Until now, large Japanese enterprises have built decision-making systems focused on eliminating unnecessary business processes and efficiently increasing quarterly profits. As a result, we are seeing more organizational structures that make it difficult to take on new challenges or experiments with trial and error. We wanted to breathe a new life into this situation, and that is how the concept of Dejima came up. In the Edo period, Japan closed its national border to other countries under its national isolation policy. At the time, Dejima was the only area where special rules were applied and allowed people from different cultures to come and go, and trade. This special rule generated the culture of inclusion and led to Dejima’s prosperity. Like Dejima, we believe that creating an organization that is independent from other business practices can be effective in enabling digital transformation for the organization.
We have been able to make this transformation with the direct help of the Google Cloud and its products such as Google Kubernetes Engine (GKE), Cloud Spanner and Anthos Service Mesh, applying domain-driven design and microservice architecture. We named this the “JCB Digital Enablement Platform (JDEP),” which now hosts multiple business critical production services.
A key benefit of GKE is that the team can easily add resources and release them when they are finished, allowing them to be flexible to accommodate busy periods and off-seasons. Meanwhile, Anthos Service Mesh helps us manage complex environments easily. With containerization and managed services, we are prepared for the future for when more services go into production, as it would be easy to maintain and provide version upgrade support. At the same time, Cloud Spanner ensures that we maintain a 99.99% availability at all times.
Our initial motivation for introducing SRE practices was to break proverbial walls between business, development and operations, which was a success. Now we are focused on ensuring its reliability and maintaining customer satisfaction with our SRE practices.
To ensure the success of SRE practices that we implemented, there were a few categories we needed to address, from defining the organizational culture and practices to ensuring the policies attached to the new models created were practical enough to be implemented on the ground level. This is so that the Dejima concept remains sustainable for the long run.
Instilling a culture of measurement
Here, “appropriate” reliability is the key. According to the conventional way of thinking at JCB, “service failure must not occur” and “SLA should be maintained as high as possible.” We started by discussing what was the “appropriate reliability” that our customers really needed, but it was not as easy as we thought because the level of reliability for user satisfaction differed from application to application.
Eventually, the business, development and operations teams formulated specific SLIs and SLOs together, something we would never have been able to do if we discussed separately. This is because the business is required to compromise on lower service levels, since our reliability standard used to be too high. The collaboration of development and operations teams is necessary to understand how our system works upon our users’ interactions.
After Google Cloud helped us run a series of workshops where all teams participated, we saw change within the organization. The business team started evangelizing SRE to other members in the business department, and the development and operations teams started collaborating autonomously. We felt like we were working at Google speed, accomplishing so much in a short amount of time.
Understanding SRE as an entire company is necessary to progress. We are now working on creating internal training materials to spread the SRE concept throughout the company.
Eliminating ambiguity
With the cooperation of Google Cloud, we have created a Team Charter that defines the team’s mission, values and engagement models. We also created policy documents that include Incident Response Policy, Postmortem Policy, On-call Policy, Toil Policy and Error Budget Policy, to eliminate ambiguity in day-to-day operations.
For example, when an incident occurs, we can identify exactly the level of importance, the roles that are assigned to each person, and in what order they need to follow. When to do a postmortem, who owns it? What to do if the error budget is exhausted? How do other teams reach out to SRE when they have problems? The written policy documents will dramatically improve efficiency and motivate teams to adopt a culture of learning from failures.
The format for such policies are written in Google’s SRE book, but when we adopt it, it needs to take into account the circumstances specific to our company. Simply copying an existing policy won’t work, which is why it’s important to formulate a policy that fits the situation each team is in.
Reformalizing teams
Based on these policies, JCB’s SRE team has two sub-teams. One is called Sheriff which works as the platform SRE, and provides infrastructure services for the application team. The other is called the Diplomat which works as the embedded SRE, and participates in the application team to lead productionisation. There is also a team called Architecture that is separate from the SRE teams whose role is to consult SRE on system design and review architecture.
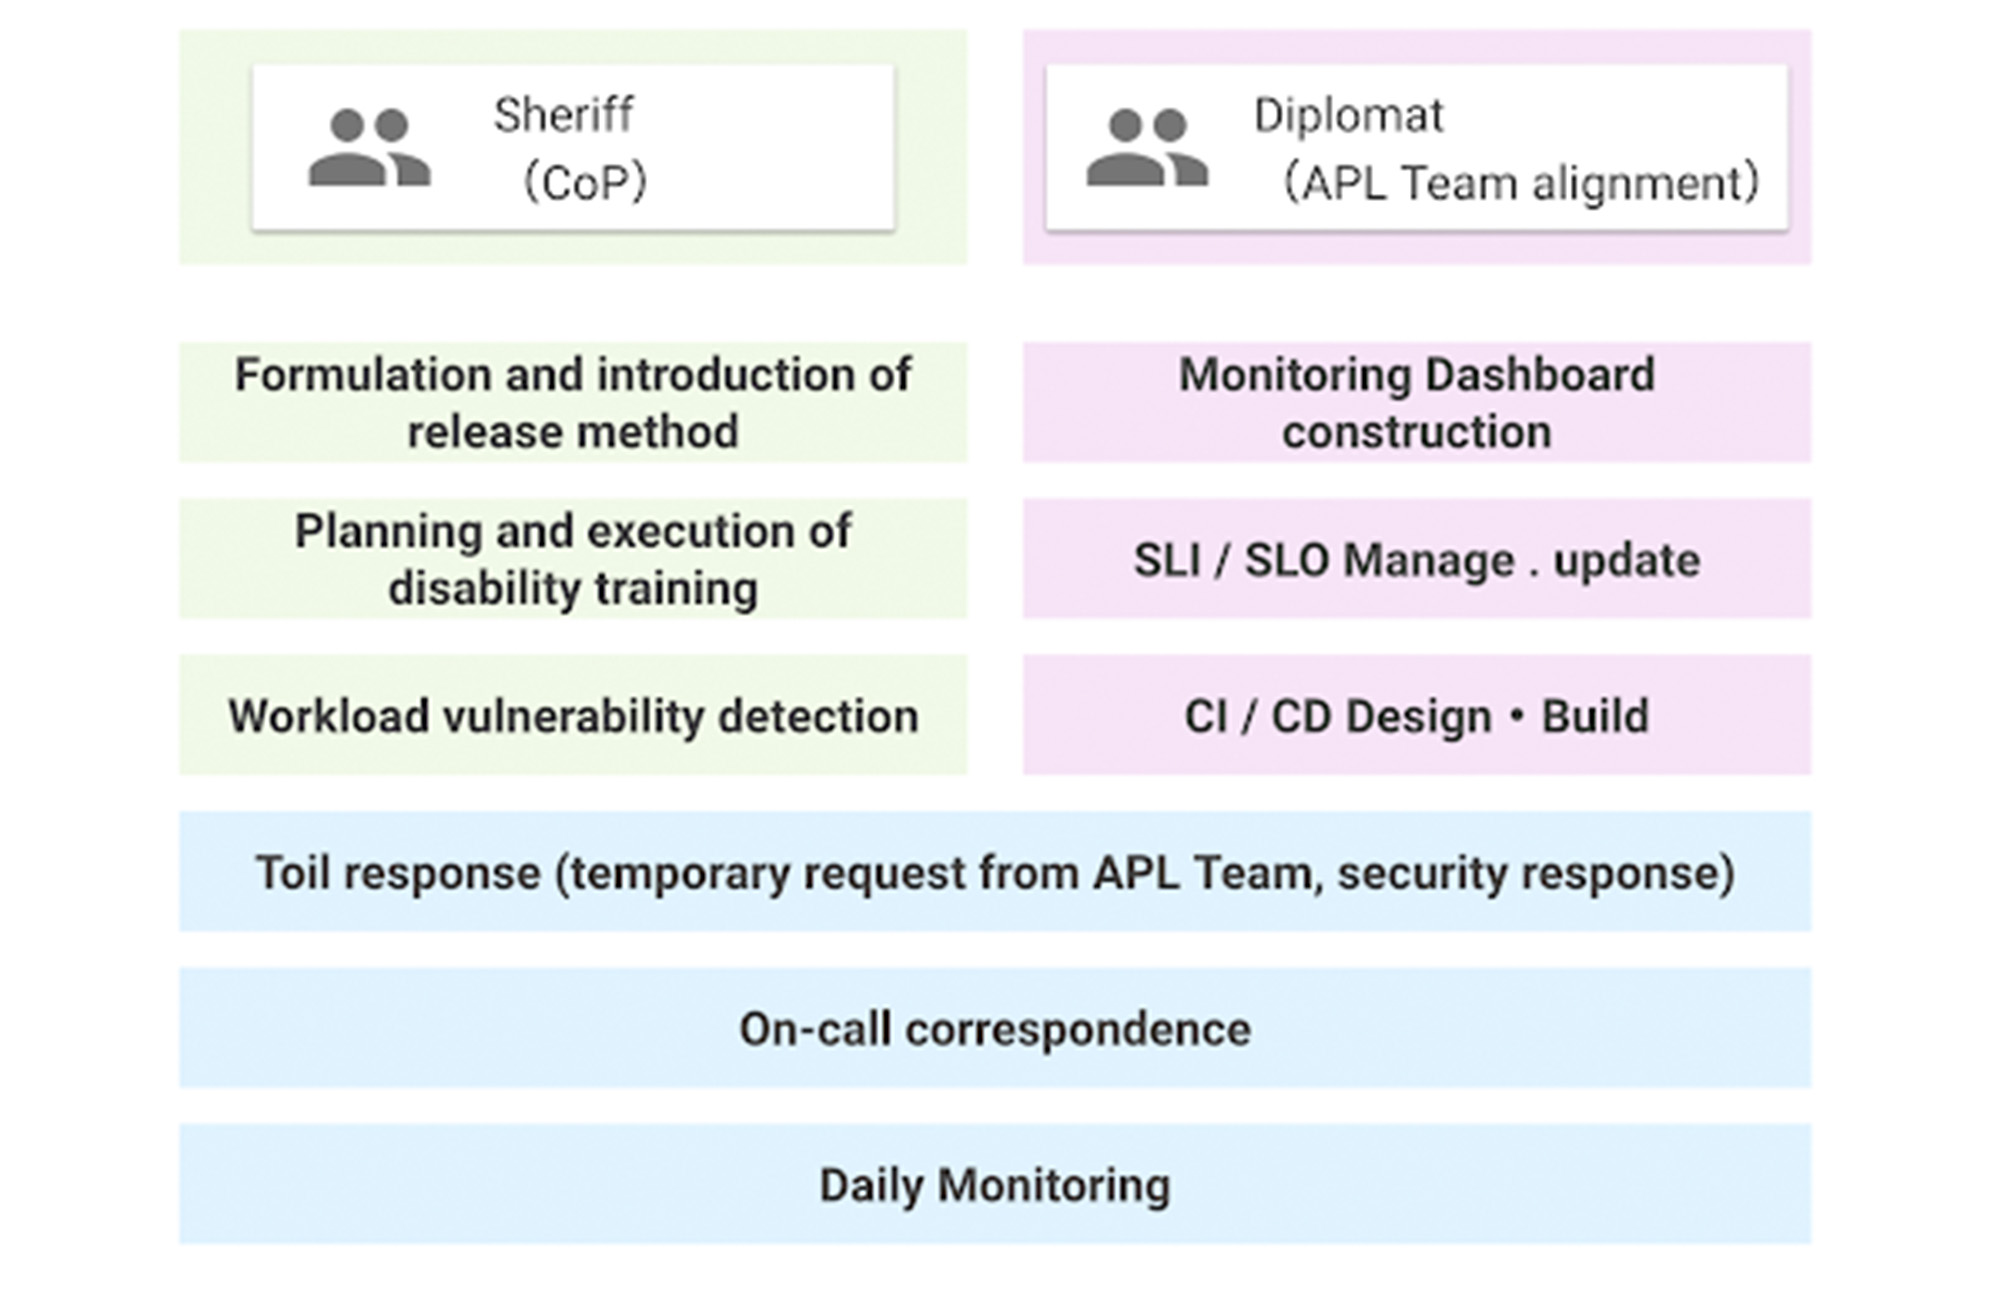
The SRE team was a single role when it was first launched, but now has two sub-teams. This is because as the number of application teams increases, the number of support tasks for the teams also increases, which can result in a shortage of resources to work on overall improvement. Securing people who are not interrupted from day-to-day support tasks and focusing on the main task improves efficiency.
Whereas both sub-teams share the on-call duty, some engineers are not allowed to do it by contract as they are not allowed to get paged. For those who cannot participate in on-call duties, we created what’s called a Toil Shift, which allows them to focus on resolving tickets in our backlogs instead.
This works well so far, but we will keep evolving as our business grows.
The Query Execution Graph: Your Key to Better BigQuery Analytics

3083
Of your peers have already read this article.
2:30 Minutes
The most insightful time you'll spend today!
BigQuery offers strong query performance, but it is also a complex distributed system with many internal and external factors that can affect query speed. When your queries are running slower than expected or are slower than prior runs, understanding what happened can be a challenge.
The query execution graph provides an intuitive interface for inspecting query execution details. By using it, you can review the query plan information in graphical format for any query, whether running or completed.
You can also use the query execution graph to get performance insights for queries. Performance insights provide best-effort suggestions to help you improve query performance. Since query performance is multi-faceted, performance insights might only provide a partial picture of the overall query performance.
Execution graph
When BigQuery executes a query job, it converts the declarative SQL statement into a graph of execution, broken up into a series of query stages, which themselves are composed of more granular sets of execution steps. The query execution graph provides a visual representation of the execution stages and shows the corresponding metrics. Not all stages are made equal. Some are more expensive and time consuming than others. The execution graph provides toggles for highlighting critical stages, which makes it easier to spot the potential performance bottlenecks in the query.
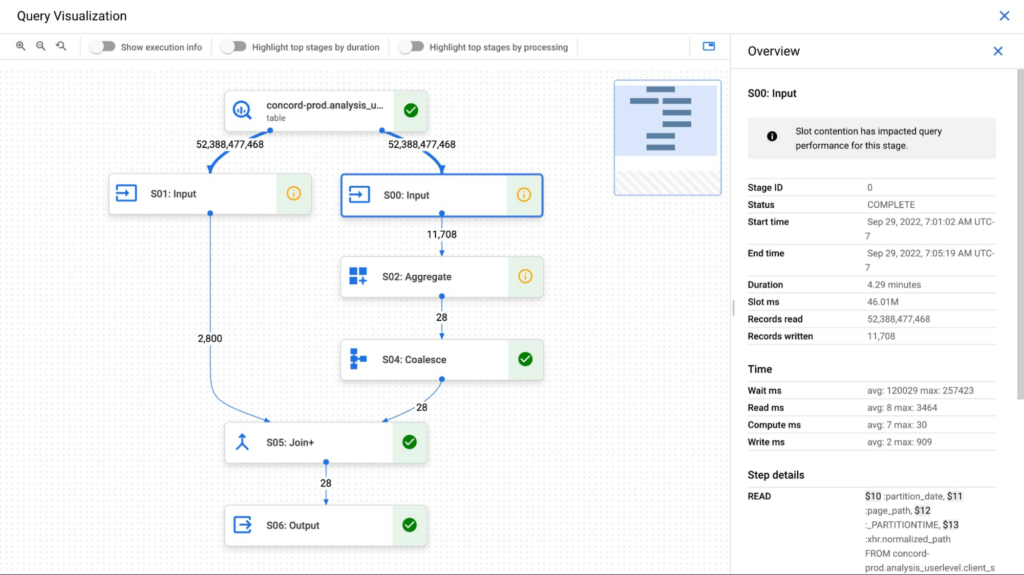
Query performance insights
In addition to the detailed execution graph BigQuery also provides specific insights on possible factors that might be slowing query performance.
Slot contention
When you run a query, BigQuery attempts to break up the work needed by your query into tasks. A task is a single slice of data that is input into and output from a stage. A single slot picks up a task and executes that slice of data for the stage. Ideally, BigQuery slots execute tasks in parallel to achieve high performance. Slot contention occurs when your query has many tasks ready for slots to start executing, but BigQuery can’t get enough available slots to execute them.
Insufficient shuffle quota
Before running your query, BigQuery breaks up your query’s logic into stages. BigQuery slots execute the tasks for each stage. When a slot completes the execution of a stage’s tasks, it stores the intermediate results in shuffle. Subsequent stages in your query read data from shuffle to continue your query’s execution. Insufficient shuffle quota occurs when you have more data that needs to get written to shuffle than you have shuffle capacity.
Data input scale change
Getting this performance insight indicates that your query is reading at least 50% more data for a given input table than the last time you ran the query and hence experiencing query slowness. You can use table change history to see if the size of any of the tables used in the query has recently increased.
What’s next?
We continue to work on improving the visualization of the graph. We are working on adding additional metrics to each step and adding more performance insights that will make query diagnosis significantly easier. We are just getting started.
More Relevant Stories for Your Company

Held Back by Database Scalability, This Financial Services Company Switches to Google Cloud and Cloud Spanner
Azimut Group operates an international network of companies handling investment and asset management, mutual funds, hedge funds, and insurance. Founded in Milan, Italy in 1988, Azimut Group today has branches in fifteen countries, including Brazil, China, and the USA. “We have subsidiaries and manage funds all over the world,” explains Simone
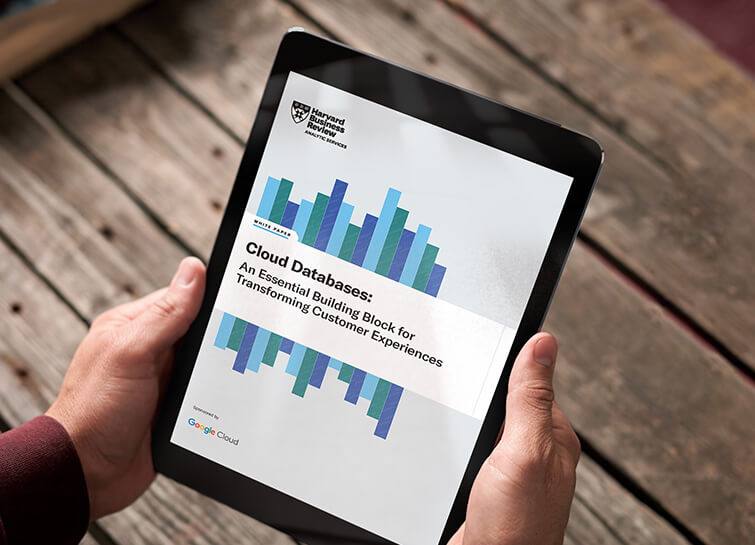
Cloud Databases: An Essential Building Block for Transforming Customer Experiences
Around the globe, companies realize that iterating and innovating the customer experience (CX) is the key to their business transformation and success goals. Customers expect exceptional and speedy service from organizations through personalized experiences and easy-to-use apps. However, while most companies want data-driven innovation, many of them overlook a key

Guide for Measuring Cloud Spanner Performance for Your Custom Workload
Database migration to a new database platform or technology can be daunting for various reasons. One of the common concerns is database performance. It is hard to evaluate database performance early in the evaluation cycle without performing actual data migration and application changes. This becomes even more important in the

Principles to Make Organizations Data Engineering Driven
In the “What type of data processing organisation” paper, we examined that you can build a data culture whether your organization consists mostly of data analysts, or data engineers, or data scientists. However, the path and technologies to become a data-driven innovator are different and success comes from implementing the right
