





Geospatial Data for Business Apps Drive Sustainable and Accurate Decision-making

4357
Of your peers have already read this article.
1:30 Minutes
The most insightful time you'll spend today!
Organizations that collect geospatial data can use that information to understand their operations, help make better business decisions, and power innovation. Traditionally, organizations have required deep GIS expertise and tooling in order to deliver geospatial insights. In this post, we outline some ways that geospatial data can be used in various business applications.
Assessing environmental risk
Governments and businesses involved in insurance underwriting, property management, agriculture technology, and related areas are increasingly concerned with risks posed by environmental conditions. Historical models that predict natural disasters like pollution, flooding, and wildfires are becoming less accurate as real-world conditions change. Therefore, organizations are incorporating real-time and historical data into a geospatial analytics platform and using predictive modeling to more effectively plan for risk and to forecast weather.
Selecting sites and planning expansion
Businesses that have storefronts, such as retailers and restaurants, can find the best locations for their stores by using geospatial data like population density to simulate new locations and to predict financial outcomes. Telecom providers can use geospatial data in a similar way to determine the optimal locations for cell towers. A site selection solution can combine proprietary site metrics with publicly-available data like traffic patterns and geographic mobility to help organizations make better decisions about site selection, site rationalization, and expansion strategy.
Planning logistics and transport
For freight companies, courier services, ride-hailing services, and other companies that manage fleets, it’s critical to incorporate geospatial context into business decision-making. Fleet management operations include optimizing last-mile logistics, analyzing telematics data from vehicles for self-driving cars, managing precision railroading, and improving mobility planning. Managing all of these operations relies extensively on geospatial context. Organizations can create a digital twin of their supply chain that includes geospatial data to mitigate supply chain risk, design for sustainability, and minimize their carbon footprint.
Understanding and improving soil health and yield
AgTech companies and other organizations that practice precision agriculture can use a scalable analytics platform to analyze millions of acres of land. These insights help organizations understand soil characteristics and help them analyze the interactions among variables that affect crop production. Companies can load topography data, climate data, soil biomass data, and other contextual data from public data sources. They can then combine this information with data about local conditions to make better planting and land-management decisions. Mapping this information using geospatial analytics not only lets organizations actively monitor crop health and manage crops, but it can help farmers determine the most suitable land for a given crop and to assess risk from weather conditions.
Managing sustainable development
Geospatial data can help organizations map economic, environmental, and social conditions to better understand the geographies in which they conduct business. By taking into account environmental and socio-economic phenomena like poverty, pollution, and vulnerable populations, organizations can determine focus areas for protecting and preserving the environment, such as reducing deforestation and soil erosion. Similarly, geospatial data can help organizations design data-driven health and safety interventions. Geospatial analytics can also help an organization meet its commitments to sustainability standards through sustainable and ethical sourcing. Using geospatial analytics, organizations can track, monitor, and optimize the end-to-end supply chain from the source of raw materials to the destination of the final product.
What’s next
Google Cloud provides a full suite of geospatial analytics and machine learning capabilities that can help you make more accurate and sustainable business decisions without the complexity and expense of managing traditional GIS infrastructure. Get started today by learning how you can use Google Cloud features to get insights from your geospatial data, see Geospatial analytics architecture.
Acknowledgements: We’d like to thank Chad Jennings, Lak Lakshmanan, Kannappan Sirchabesan, Mike Pope, and Michael Hao for their contributions to this blog post and the Geospatial Analytics architecture.
11217
Of your peers have already watched this video.
1:30 Minutes
The most insightful time you'll spend today!
Indian Retailer Figures Optimizes Hyperlocal Delivery to Increase Customer Experience
Anyone who follows the Indian e-commerce scene knows that one of the largest challenges these companies face is hyperlocal delivery.
That was a problem facing Wellness Forever, a retail chain of pharmacies with 150-plus stores across India.
“Exactly a year ago, we started our journey of hyperlocal deliveries. This optimization was a big time challenge for us to understand how to optimize this,” Palani Subbiah, CTO, Wellness Forever.
The problem in front of Wellness Forever was to identify which customer could can be sold from which store, so that a delivery could be made within 90 minutes.
“We handle a large amount of customer data and we wanted to use insights to help and improve the customer satisfaction index,” says Subbiah.
To do that Wellness Forever leveraged Google Big Query to run massive amount of data to come up with the operational insights. They also used Firebase and Google Maps.
“By 2021, we are going to have about 450 stores. Those stores are going to be not only a physical store, which is a digital store.
12009
Of your peers have already watched this video.
3:26 Minutes
The most insightful time you'll spend today!
How L&T Financial Services Processes 95% of Motorcycle Loans in Less Than Two Minutes
L&T Financial Services is one of the largest lenders in India. India’s demonetization policy in recent years has led to a shift from cash transactions to digital payments. In 2016, the government withdrew 500 and 1000 rupee notes from circulation and encouraged a heavily cash-based population to deposit their canceled notes in banks. Financial institutions needed to pivot to a new way of doing business to stay competitive. L&T Financial Services modernized its IT infrastructure to keep up with changes and capture digital opportunities.
“Working capital is crucial to stimulate growth in rural communities. Our role as a lender is to provide access to funds. We don’t want to burden borrowers with the complexities of getting a loan. Towards this end, digitization is an important step,” says Dinanath Dubhashi, Managing Director and CEO at L&T Financial Services. “Google Cloud helps us streamline service delivery and identify the right customers. By offering the fastest processing time in the industry, we want to be the go-to lender for all customers.”
L&T Financial Services considered multiple cloud providers before choosing Google Cloud. According to Dinanath, Google Cloud understands both the need for businesses to move fast and the need for IT to modernize at different speeds. “We weren’t forced to abandon existing IT systems and migrate lock, stock, and barrel to Google Cloud on day one.”
L&T Financial Services engaged Google Cloud Professional Services to guide its digital transformation journey. The smooth migration from proof of concept to full-scale deployment on Google Cloud took a matter of months.
“Collaboration: a small idea with big opportunities. G Suite helps us connect remote branches with the head office, easily access shared files to submit and track approvals, and conduct face-to-face discussions to accelerate approval processes.”
—Dinanath Dubhashi, MD and CEO, L&T Financial Services
Digitizing the workforce with G Suite
The move to the cloud at L&T Financial Services started in 2017 when the company introduced G Suite to its 14,500 employees. The legacy email system was cumbersome to use, especially for frontline staff who need email access while they are on the road. Using Gmail, employees can connect with customers and co-workers from anywhere, on any device. Employees save time by scheduling meetings with Calendar, collaborating on Docs, and conducting video calls using Hangouts Meet.
Converting data into credit insights using BigQuery
Taking data intelligence one step further, L&T Financial Services adopts a responsible lending approach by applying algorithm-based data analytics to improve credit standards. Beyond traditional data such as credit score and credit payment history, the company also considers macro-economic indicators for risk audits. For example, a farmer’s ability to pay off the loan of his new tractor depends on a successful planting and harvest. So L&T Financial Services feeds long-term data into BigQuery and runs queries to predict loan defaults based on rainfall and crop yield.

3696
Of your peers have already downloaded this article
16:30 Minutes
The most insightful time you'll spend today!
Organizations today are being forced to make difficult decisions. Innovation has moved down the list for many companies, replaced with realities like making sure your business systems stay up and running during a disaster, managing unexpected shifts in demand,and above all, staying in business.
In the short term, this means looking for cost savings wherever possible, and making sure you’re up and running, no matter what circumstances come your way. In the longer term, it means identifying areas to reduce capital expenditures—including things like data center commitments, migration costs, and other overhead.
Google Cloud database solutions can help with both the short- and longer-term issues. Our solutions provide the opportunity to reduce the load that managing legacy applications is placing on your IT department and ensure you can manage unforeseen demand, all while making sure your databases are up and running, no matter what circumstances come your way.
In this whitepaper we’ll look in detail at some Google Cloud database solutions that can help you re-host, re-platform, or re-write your enterprise database with Google Cloud. You’ll see how we can help you plan for both the short- and long-term health of your Oracle workloads.
How Vertex AI Helps Coca-Cola Bottlers Japan Analyze Billions of Data Records

6194
Of your peers have already read this article.
4:00 Minutes
The most insightful time you'll spend today!
Japan is home to millions of vending machines installed on streets and in buildings, sports stadiums and other facilities. Vending machine owners and operators, including beverage manufacturers, stock these machines with different product combinations depending on location and demand. For example, they primarily display coffee and energy drinks in machines placed in offices and sports drinks and mineral water in machines at sports facilities. The combinations also vary by season: for example, owners and operators may display cold beverages in summer and hot beverages in winter.
Traditionally, vending machine operators have relied on the intuition and experience of sales managers to determine the optimum product mix for each vending machine. However, in recent years, manufacturers such as Coca-Cola Bottlers Japan (CCBJ) have turned to data to analyze and make strategic decisions about when and where to locate products in machines.
CCBJ is the number one Coca-Cola bottler in Asia and vending machines comprise the bulk of its business. The organization operates about 700,000 machines across Tokyo, Osaka, Kyoto, and 35 prefectures. Minori Matsuda, Google Developer Expert and also Data Science Manager at CCBJ, says “The billions of data records collected from 700,000 physical devices are a great asset and a treasure trove we can take advantage of.”
Minori points out that when considering the mix of products in vending machines in sporting facilities, the managers naturally assume sports drinks would generally sell well. However, analysis of purchase data – including hot drinks and hot drinks plus sports drinks – found many parents purchased sweet drinks such as milk tea when they attended games or sessions involving their children. “Analyzing data gives us new discoveries and, by using catchy storytelling techniques from exploratory data analysis, we are instilling a data culture within our company,” he says. “It’s worth creating by looking at facts rather than making assumptions!”
Minori believes that to analyze the vast amount of data collected from more than 700,000 vending machines, the business needs a powerful analytical platform. However, until recently, CCBJ had to extract data for analysis from its core systems, load this data into a warehouse it created and perform the required analyses. The billions of records of data generated across the fleet – including transaction data – exposed some challenges for traditional analysis platforms. They could not efficiently process data at a considerable scale: it could take a day to return results and required extensive maintenance due to the size.
CCBJ considered building a machine learning (ML) platform as a layer on top of existing systems in August 2020 and opted for Google Cloud the following month. “I feel that Google Cloud has an edge in all products and is very well thought out,“ says Minori, noting the scalability and cost of the platform allow the business to take a ‘trial and error’ approach to achieve the best outcomes from ML. Google Cloud also delivered the required visibility and flexibility to help the business deliver change every day against key performance indicators.
MLOps platform streamlines ML pipeline development
CCBJ built its analysis platform using Vertex AI (formerly AI Platform) centered on a BigQuery analytics data warehouse, and partly using AutoML for tabular data. “We have created a prediction model of where to place vending machines, what products are lined up in the machines and at what price, how much they will sell, and implemented a mechanism that can be analyzed on a map,” says Minori, adding that building the platform with Google Cloud was not difficult. “We were able to realize it in a short period of time with a sense of speed, from platform examination to introduction, prediction model training, on-site proof of concept to rollout.”
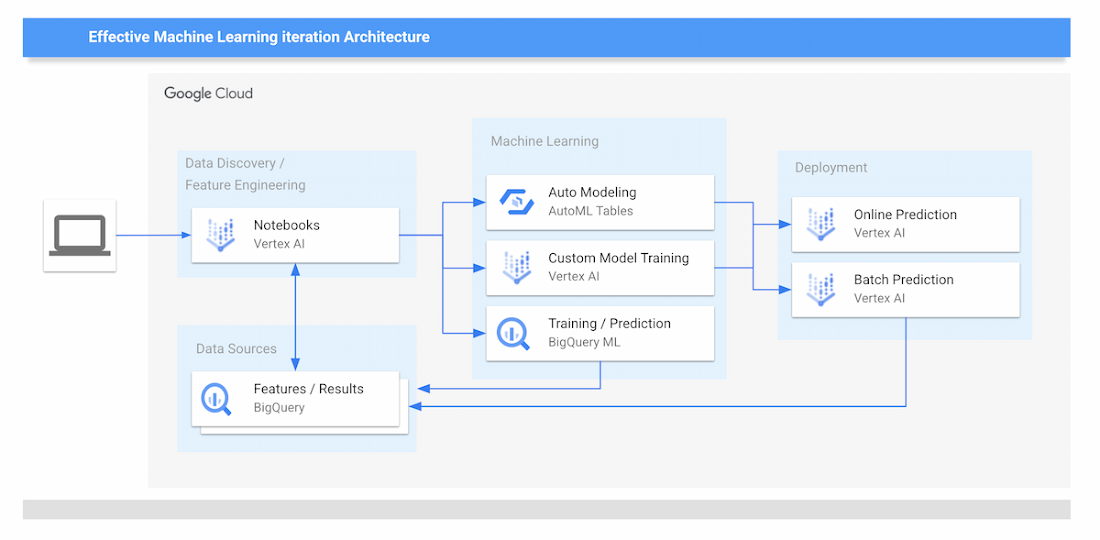
The new data analytics platform of CCBJ consists of the following parts:
Data Sources
- The data collected from the vending machines are all stored on BigQuery.
Data Discovery and Feature Engineering
- Minori and other data scientists at CCBJ are using Vertex Notebooks, where they access the data on BigQuery by executing SQL queries directly from the Notebooks. This environment is used for the data discovery process and feature engineering.
ML Training
- For ML training, CCBJ uses AutoML for Tabular data, Custom model training on Vertex AI, and BigQuery ML. AutoML gives model performance with AUC curves and also feature importance graphs.
ML Prediction and Serving
- For ML prediction, CCBJ uses Online Prediction for AutoML models and Online Prediction for custom models for real-time prediction when the salesperson finds the interesting point
- Batch Prediction is used for generating a large prediction map that covers the whole country
- The prediction results are distributed to sales managers’ tablets
CCBJ started constructing the platform in September 2020, and completed it within a month. The business has conducted proofs of concept at its base in Kyoto since February 2021, and since April, has rolled out the platform to sales managers in 35 prefectures in one metropolitan area. “Data analysis is built into the day-to-day routines of sales managers with 100% utilization,” says Minori. “They can utilize the prediction results on tablets that were able to achieve pretty high accuracy from the start.”
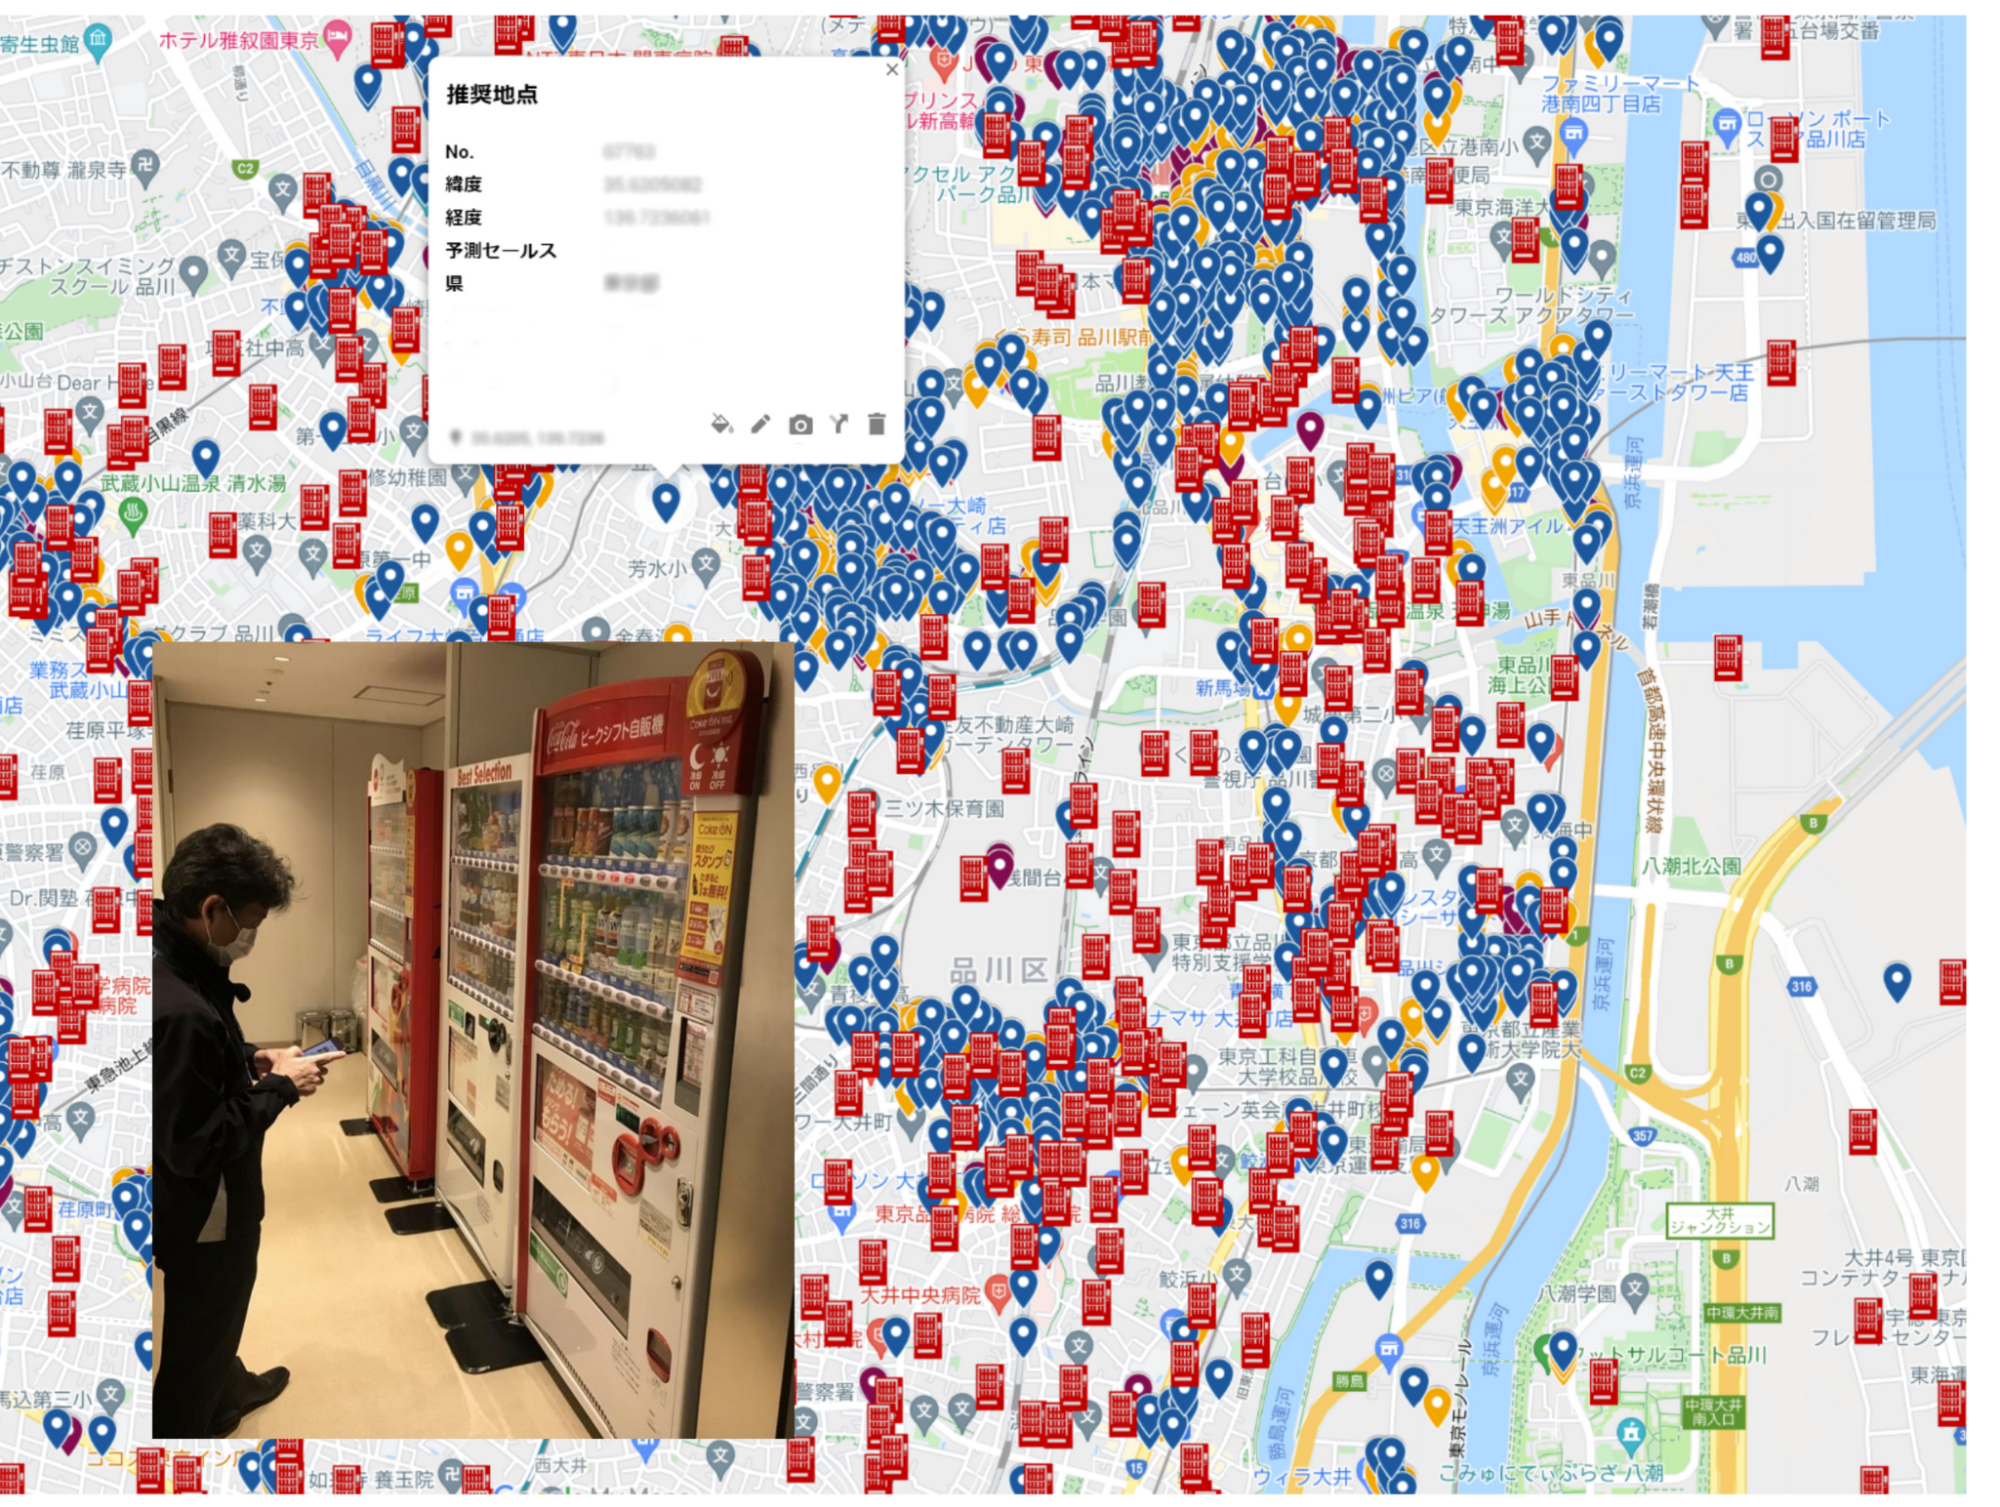
The hardest part was the education of sales managers in the field; having them understand the reasoning behind the ML prediction results for particular outcomes, so they could be convinced to make use of the results. “For example, regarding a new installation location predicted by the model, it seemed that there was no effective information for installation from the map information, but when I actually went there, there was a motorcycle shop and it was a place where young people who like motorcycles gathered,” says Minori. “Or there is a small meeting place where the elderly in the neighborhood are active.
“In many cases, new discoveries that cannot be understood from map information alone can be derived from the data.”
Minori also points to a phenomenon whereby humans pursued and confirmed factors inferred by the model – meaning that once they experienced analysis and it worked effectively, they asked why the same type of analysis or prediction could not be undertaken next time. The resulting cycle of more inquiries generated, more information gathered and more data captured for analysis meant the accuracy of results was improved.
Minori describes Vertex AI as having a number of strengths in helping CCBJ build a ML data analysis platform. “One of the major merits of Vertex AI was that we were able to realize MLOps that streamlines the entire development life cycle from construction of the ML pipeline to its execution,” he says.
With near real-time data analysis through Google Cloud, CCBJ teams can spend time developing strategies rather than waiting for data requested from the IT systems department. Exploratory data analysis is also considerably easier as repeated trial and error has greatly improved the accuracy of analyses. Before we used Machine Learning, most machine placement processes were done by human senses, by looking at a map to find the suggestion points. By using Machine Learning to generate a massive number of placement point suggestions, the efficiency of routing of salespeople has been dramatically improved.
In the future, CCBJ aims to automate the continuous training pipeline with Vertex AI. “CCBJ is a tech company that operates in the food industry,” says Minori. With the organization operating a vending machine network of 700,000 units, it would like to create new businesses based on utilization and analyzing data. Some of these businesses may be based on Sustainable Development Goals (SDGs) initiatives such as the utilization of recycled PET bottles, measures to prevent food loss and ways of using vending machines to contribute to local communities, which we have been working on for some time. It would be interesting if we could collaborate with Google Cloud on these in the future.”

How to Enhance Incremental Pipeline Performance while Ingesting Data into BigQuery

6324
Of your peers have already read this article.
3:00 Minutes
The most insightful time you'll spend today!
When you build a data warehouse, the important question is how to ingest data from the source system to the data warehouse. If the table is small you can fully reload a table on a regular basis, however, if the table is large a common technique is to perform incremental table updates. This post demonstrates how you can enhance incremental pipeline performance when you ingest data into BigQuery.
Setting up a standard incremental data ingestion pipeline
We will use the below example to illustrate a common ingestion pipeline that incrementally updates a data warehouse table. Let’s say that you ingest data into BigQuery from a large and frequently updated table in the source system, and you have Staging and Reporting areas (datasets) in BigQuery.

The Reporting area in BigQuery stores the most recent, full data that has been ingested from the source system tables. Usually you create the base table as a full snapshot of the source system table. In our running example, we use BigQuery public data as the source system and create reporting.base_table as shown below. In our example each row is identified by a unique key which consists of two columns: block_hash and log_index.
CREATE TABLE reporting.base_table --156 GB processedPARTITION BY TIMESTAMP_TRUNC(block_timestamp, DAY) ASSELECT log_index, data, topics, block_timestamp, block_hashFROM bigquery-public-data.crypto_ethereum.logsWHERE block_timestamp BETWEEN TIMESTAMP '2020-01-01' AND TIMESTAMP '2020-11-30';
In data warehouses it is common to partition a large base table by a datetime column that has a business meaning. For example, it may be a transaction timestamp, or datetime when some business event happened, etc. The idea is that data analysts who use the data warehouse usually need to analyze only some range of dates and rarely need the full data. In our example, we partition the base table by block_timestamp which comes from the source system.
After ingesting the initial snapshot you need to capture changes that happen in the source system table and update the reporting base table accordingly. This is when the Staging area comes into the picture. The staging table will contain captured data changes that you will merge into the base table. Let’s say that in our source system on a regular basis we have a set of new rows and also some updated records. In our example we mock the staging data as follows: first, we create new data, than we mock the updated records:
CREATE TABLE staging.load_delta AS --5 GB processedSELECT log_index, data, topics, block_timestamp, block_hashFROM bigquery-public-data.crypto_ethereum.logsWHERE block_timestamp BETWEEN TIMESTAMP '2020-12-01' AND TIMESTAMP '2020-12-07';INSERT INTO staging.load_delta --2 GB processedSELECT log_index, CONCAT(data, RAND()), topics, block_timestamp, block_hashFROM bigquery-public-data.crypto_ethereum.logs TABLESAMPLE SYSTEM (5 PERCENT)WHERE block_timestamp BETWEEN TIMESTAMP '2020-10-01' AND TIMESTAMP '2020-11-30';
Next, the pipeline merges the staging data into the base table. It joins two tables by unique key and than updates the changed value or inserts a new row
MERGE INTO reporting.base_table T --161 GB processedUSING staging.load_delta SON T.block_hash = S.block_hashAND T.log_index = S.log_indexWHEN MATCHED THEN UPDATE SETT.data = S.dataWHEN NOT MATCHED THEN INSERT (log_index, data, topics, block_timestamp, block_hash)VALUES (log_index, data, topics, block_timestamp, block_hash);
It is often the case that the staging table contains keys from various partitions but the number of those partitions are relatively small. It holds, for instance, because in the source system the recently added data may get changed due to some initial errors or ongoing processes but older records are rarely updated. However, when the above MERGE gets executed, BigQuery scans all partitions in the base table and processes 161 GB of data. You might add additional join condition on block_timestamp:
MERGE INTO reporting.base_table T --161 GB processedUSING staging.load_delta SON T.block_hash = S.block_hashAND T.log_index = S.log_indexAND T.block_timestamp = S.block_timestampWHEN MATCHED THEN UPDATE SETT.data = S.dataWHEN NOT MATCHED THEN INSERT (log_index, data, topics, block_timestamp, block_hash)VALUES (log_index, data, topics, block_timestamp, block_hash);
But BigQuery would still scan all partitions in the base table because condition T.block_timestamp = S.block_timestamp is a dynamic predicate and BigQuery doesn’t automatically push such predicates down from one table to another in MERGE.
Can you improve the MERGE efficiency by making it scan less data? The answer is Yes.
As described in the MERGE documentation, pruning conditions may be located in a subquery filter, a merge_condition filter, or a search_condition filter. In this post we show how you can leverage the first two. The main idea is to turn a dynamic predicate into a static predicate.
Steps to enhance your ingestion pipeline
The initial step is to compute the range of partitions that will be updated during the MERGE and store it in a variable. As was mentioned above, in data ingestion pipelines, staging tables are usually small so the cost of the computation is relatively low.
DECLARE src_range STRUCT<date_min TIMESTAMP, date_max TIMESTAMP> --115 MB processedDEFAULT(SELECT STRUCT(MIN(block_timestamp) AS date_min,MAX(block_timestamp) AS date_max) FROM staging.load_delta);
Based on your existing ETL/ELT pipeline, you can add the above code as-is to your pipeline or you can compute date_min, data_max as part of some already existing transformation step. Alternatively, date_min, data_max can be computed on the Source System side while capturing the next ingestion data batch.
After computing date_min, date_max you pass those values to the MERGE statement as static predicates. There are several ways to enhance the MERGE and prune partitions in the base table based on precomputed date_min, data_max.
If your initial MERGE statement uses a subquery, you can incorporate a new filter into it:
BEGINDECLARE src_range STRUCT<date_min TIMESTAMP, date_max TIMESTAMP> --115 MB processedDEFAULT(SELECT STRUCT(MIN(block_timestamp) AS date_min,MAX(block_timestamp) AS date_max) FROM staging.load_delta);MERGE INTO reporting.base_table T --41 GB processedUSING (SELECT *FROM staging.load_deltaWHERE block_timestamp BETWEEN src_range.date_min AND src_range.date_max) SON T.block_hash = S.block_hashAND T.log_index = S.log_indexAND T.block_timestamp = S.block_timestampWHEN MATCHED THEN UPDATE SETT.data = S.dataWHEN NOT MATCHED THEN INSERT (log_index, data, topics, block_timestamp, block_hash)VALUES (log_index, data, topics, block_timestamp, block_hash);END;
Note that you add the static filter to the staging table and keep T.block_timestamp = S.block_timestamp to convey to BigQuery that it can push that filter to the base table. This MERGE processes 41 GB of data in contrast to the initial 161 GB. You can see in the query plan that BigQuery pushes the partition filter from the staging table to the base table:
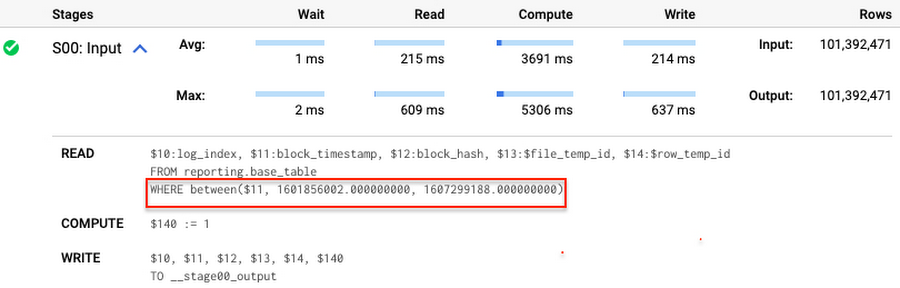
This type of optimization, when a pruning condition is pushed from a subquery to a large partitioned or clustered table, is not unique for MERGE. It also works for other types of queries. For instance:
SELECT * -- 41 GB processedFROM reporting.base_table TINNER JOIN staging.load_delta SON T.block_hash = S.block_hashAND T.log_index = S.log_indexAND T.block_timestamp = S.block_timestampWHERE S.block_timestamp BETWEEN TIMESTAMP '2020-10-05' AND TIMESTAMP '2020-12-07'
And you can check the query plan to verify that BigQuery pushed down the partition filter from one table to another.
Moreover, for SELECT statements, BigQuery can automatically infer a filter predicate on a join column and push it down from one table to another if your query meets the following criteria:
- The target table must be clustered or partitioned.
- The result size of the other table, i.e. after applying all filters, must qualify for broadcast join. Namly, the result set must be relatively small, less than ~100MB.
In our running example, reporting.base_table is partitioned by block_timestamp. If you define a selective filter on staging.load_delta and join two tables, you can see an inferred filter on the join key pushed to the target table
SELECT *FROM reporting.base_table TINNER JOIN staging.load_delta SON T.block_timestamp = S.block_timestampWHERE S.block_hash = '0x0c1caa16b34d94843aabfebc0d5a961db358135988f7498a6fdc450ad55f0870'
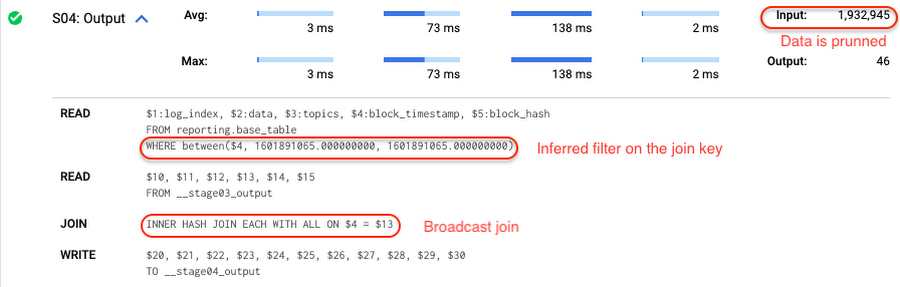
There is no requirement to join tables by partitioning or clustering key to kick off this type of optimization. However, in this case the pruning effect on the target table would be less significant.
But let us get back to the pipeline optimizations. Another way to enhance MERGE is to modify the merge_condition filter by adding static predicate on the base table:
BEGINDECLARE src_range STRUCT<date_min TIMESTAMP, date_max TIMESTAMP> --115 MB processedDEFAULT(SELECT STRUCT(MIN(block_timestamp) AS date_min,MAX(block_timestamp) AS date_max) FROM staging.load_delta);MERGE INTO reporting.base_table T --41 GB processedUSING staging.load_delta SON T.block_hash = S.block_hashAND T.log_index = S.log_indexAND T.block_timestamp BETWEEN src_range.date_min AND src_range.date_maxWHEN MATCHED THEN UPDATE SETT.data = S.dataWHEN NOT MATCHED THEN INSERT (log_index, data, topics, block_timestamp, block_hash)VALUES (log_index, data, topics, block_timestamp, block_hash);END;
To summarize, here are the steps that you can perform to enhance incremental ingestion pipelines in BigQuery. First you compute the range of updated partitions based on the small staging table. Next, you tweak the MERGE statement a bit to let BigQuery know to prune data in the base table.
All the enhanced MERGE statements scanned 41 GB of data, and setting up the src_range variable took 115 MB. Compare it with the initial 161 GB scan. Moreover, given that computing src_range may be incorporated into some existing transformation in your ETL/ELT, it results in a good performance improvement which you can leverage in your pipelines.
In this post we described how to enhance data ingestion pipelines by turning dynamic filter predicates into static predicates and letting BiQuery prune data for us. You can find more tips on BigQuery DML tuning here.
Special thanks to Daniel De Leo, who helped with examples and provided valuable feedback on this content.
More Relevant Stories for Your Company

Soundtrack Your Brand: Delivering Sound That Stands Out From the Crowd with BigQuery
Editor’s note: Soundtrack Your Brand is an award-winning streaming service with the world’s largest licensed music catalog built just for businesses, backed by Spotify. Today, we hear how BigQuery has been a foundational component in helping them transform big data into music. Soundtrack Your Brand is a music company at

World’s Largest Online-only Grocery Retailer Uses AI to Figure Which Customers Need Most Attention
In the United Kingdom, the popularity of online grocery shopping is expected to surge from about 6% of the market today to 9% by 2021, according to market research firm Mintel. One of the pioneers of online-only grocery retailing is Ocado, based in Hatfield, Hertfordshire in the U.K. Since starting commercial deliveries

Developers and Practitioners’ Guide for Moving On-prem Data Warehouse to BigQuery
Data teams across companies have continuous challenges of consolidating data, processing it and making it useful. They deal with challenges such as a mixture of multiple ETL jobs, long ETL windows capacity-bound on-premise data warehouses and ever-increasing demands from users. They also need to make sure that the downstream requirements

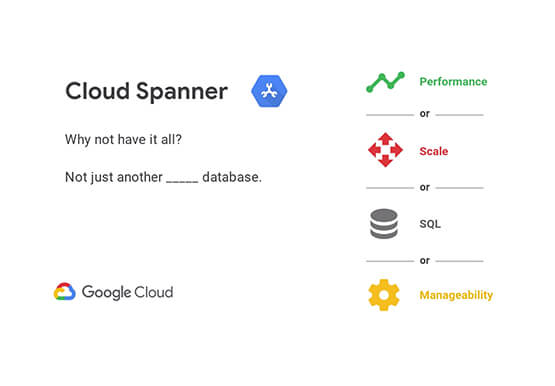
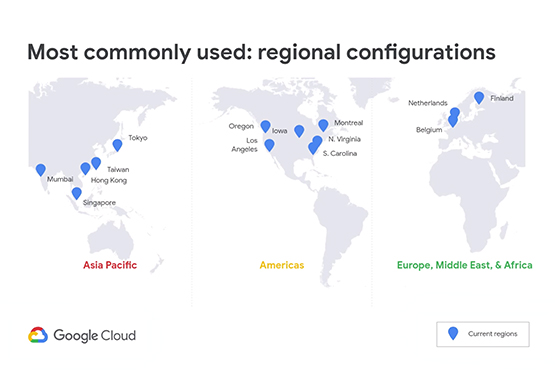

What is Cloud Spanner and Is It the Right Database for You?
You’ve probably heard about Cloud Spanner, but what exactly does it do that is so different from other databases out there? How do you know if it’s worth spending your valuable time trying out? Cloud Spanner is the first enterprise-grade, globally distributed, and strongly consistent database service built for the
