





Soundtrack Your Brand: Delivering Sound That Stands Out From the Crowd with BigQuery

2840
Of your peers have already read this article.
6:00 Minutes
The most insightful time you'll spend today!
Editor’s note: Soundtrack Your Brand is an award-winning streaming service with the world’s largest licensed music catalog built just for businesses, backed by Spotify. Today, we hear how BigQuery has been a foundational component in helping them transform big data into music.
Soundtrack Your Brand is a music company at its heart, but big data is our soul. Playing the right music at the right time has a huge influence on the emotions a brand inspires, the overall customer experience, and sales. We have a catalog of over 58 million songs and their associated metadata from our music providers and a vast amount of user data that helps us deliver personalized recommendations, curate playlists and stations, and even generate listening schedules. As an example, through our Schedules feature our customers can set up what to play during the week. Taking that one step further, we provide suggestions on what to use in different time slots and recommend entire schedules.
Using BigQuery, we built a data lake to empower our employees to access all this content and metadata in a structured way. Ensuring that our data is easily discoverable and accessible allows us to build any type of analytics or machine learning (ML) use case and run queries reliably and consistently across the complete data set. Today, our users are benefiting from this advanced analytics through the personalized recommendations we offer across our core features: Home, Search, Playlists, Stations, and Schedules.
Fine-tuning developer productivity
The biggest business value that comes from BigQuery is how much it speeds up our development capabilities and allows us to ship features faster. In the past 3 years, we have built more than 150 pipelines and more than 30 new APIs within our ML and data teams that total about 10 people. That is an impressive rate of a new pipeline every week and a new API every month. With everything in BigQuery, it’s easy to simply write SQL and have it be orchestrated within a CI/CD toolchain to automate our data processing pipelines. An in-house tool built as a github template, in many ways very similar to Dataform, helps us build very complex ETL processes in minutes, significantly reducing the time spent on data wrangling.
BigQuery acts as a cornerstone for our entire data ecosystem, a place to anchor all our data and be our single source of truth. This single source of truth has expanded the limits of what we can do with our data. Most of our pipelines start from a data lake, or end at a data lake, increasing re-usability of data and collaboration. For example, one of our interns built an entire churn prediction pipeline in a couple of days on top of existing tables that are produced daily. Nearly a year later, this pipeline is still running without failure largely due to its simplicity. The pipeline is BigQuery queries chained together into a BigQuery ML model running on a schedule with Kubeflow Pipelines.
Once we made BigQuery the anchor for our data operations, we discovered we could apply it to use cases that you might not expect, such as maintaining our configurations or supporting our content management system. For instance, we created a Google Sheet where our music experts are able to correct genre classification mistakes for songs by simply adding a row to a Google Sheet. Instead of hours or days to create a bespoke tool, we were able to set everything up in a few minutes.
BigQuery’s ability to consume Excel spreadsheets allows business users who play key roles in improving our recommendations engine and curating our music, such as our content managers and DJs, to contribute to the data pipeline.
Another example is our use of BigQuery as an index for some of our large Cloud Storage buckets. By using cloud functions to subscribe to read/write events for a bucket, and writing those events to partitioned tables, our pipelines can easily and in a natural way quickly search and access files, such as downloading and processing the audio of new track releases. We also make use of Log Events when a table is added to a dataset to trigger pipelines that process data on demand, such as JSON/CSV files from some of our data providers that are newly imported into BQ. Being the place for all file integration and processing, BQ allows new data to be quickly available to our entire data ecosystem in a timely and cost effective manner while allowing for data retention, ETL, ACL and easy introspection.
BigQuery makes everything simple. We can make a quick partitioned table and run queries that use thousands of CPU hours to sift through a massive volume of data in seconds — and only pay a few dollars for the service. The result? Very quick, cost-effective ETL pipelines.
In addition, centralizing all of our data in BigQuery makes it possible to easily establish connections between pipelines providing developers with a clear understanding of what specific type of data a pipeline will produce. If a developer wants a different outcome, she can copy the github template and change some settings to create a new, independent pipeline.
Another benefit is that developers don’t have to coordinate schedules or sync with each other’s pipelines: they just need to know that a table that is updated daily exists and can be relied on as a data source for an application. Each developer can progress their work independently without worrying about interfering with other developers’ use of the platform.
Making iteration our forte
Out of the box, BigQuery met and exceeded our performance expectations, but ML performance was the area that really took us by surprise. Suddenly, we found ourselves going through millions of rows in a few seconds, where the previous method might have taken an hour. This performance boost ultimately led to us improving our artist clustering workload from more than 24 hours on a job running 100 CPU workers to 10 minutes on a BigQuery pipeline running inference queries in a loop until convergence. This more than 140x performance improvement also came at 3% of the cost.
Currently we have more than 100 Neural Network ML models being trained and run regularly in batch in BQML. This setup has become our favorite method for both fast prototyping and creating production ready models. Not only is it fast and easy to hypertune in BQML, but our benchmarks show comparable performance metrics to using our own Tensorflow code. We now use Tensorflow sparingly. Differences in input data can have an even greater impact on the experience of the end user than individual tweaks to the models.
BigQuery’s performance makes it easy to iterate with the domain experts who help shape our recommendations engine or who are concerned about churn, as we are able to show them the outcome on our recommendations from changes to input data in real-time. One of our favorite things to do is to build a Data Studio report that has the ML.predict query as part of its data source query. This report shows examples of good/bad predictions in the report along with bias/variance summaries and a series of drop-downs, thresholds and toggles to control the input features and the output threshold. We give that report to our team of domain experts to help manually tune the models, putting the model tuning right in the hands of the domain experts. Having humans in the loop has become trivial for our team. In addition to fast iteration, the BigQuery ML approach is also very low maintenance. You don’t need to write a lot of Python or Scala code or maintain and update multiple frameworks—everything can be written as SQL queries run against the data store.
Helping brands to beat the band—and the competition
BigQuery has allowed us to establish a single source of truth for our company that our developers and domain experts can build on to create new and innovative applications that help our customers find the sound that fits their brand.
Instead of cobbling together data from arbitrary sources, our developers now always start with a data set from BigQuery and build forward. This guarantees the stability of our data pipeline and makes it possible to build outward into new applications with confidence. Moreover, the performance of BigQuery means domain experts can interact with the analytics and applications that developers create more easily and see the results of their recommended improvements to ML models or data inputs quickly. This rapid iteration drives better business results, keeps our developers and domain experts aligned, and ensures Soundtrack Your Brand keeps delivering sound that stands out from the crowd.
Serverless and BigQuery Together on Google Cloud: Behind the L’Oreal Beauty Tech Data Platform

5351
Of your peers have already read this article.
4:00 Minutes
The most insightful time you'll spend today!
Editor’s note: In Today’s guest post we hear from beauty leader L’Oréal about their approach to building a modern data platform on fully managed services: managing the ingest of diverse datasets into BigQuery with Cloud Run, and orchestrating transformations into relevant business domain representations for stakeholders across the organization. Learn more about how businesses have benefited from Cloud Run in Forrester’s report on Total Economic Impact.
L’Oréal was born out of science. For over 100 years, we have always shaped the future of beauty, and taken its eternal quest to new horizons. This has earned us our current position as the world’s uncontested beauty leader (~€ 32 B annual sales in 2021), present in 150 countries with over 85,000 employees.
Today, with the power of our game-changing science, multiplied by cutting-edge technologies, we continue our lifelong journey of shaping the future of beauty.
As a Beauty Tech company, we leverage our decades-long heritage of rich data assets to empower our decision-making with instant, sophisticated analysis.
Because we oversee global brands, which must adapt to local requirements, we need to maintain a deep understanding of what a brands’ data represents, while managing disparate legal and regulatory requirements for different countries. Our end goal is to run a safe, compliant and sustainable data warehouse as efficiently and effectively as possible.
We sync and aggregate internal and external data from a wide variety of sources across organizations and retail stores. This made the management of our data warehouse infrastructure used to be very complex and hard to manage before Google Cloud. L’Oréal’s footprint was so large that we once found it impossible to have a standardized method to handle data. Every process was vendor-specific, and the infrastructure was brittle. We went looking for a solution to our complex data infrastructure needs, and defined the following non-negotiable principles:
- No Ops: The job of a developer at L’Oréal is not to manage servers. We need an elastic infrastructure that scales on demand, so that our developers can focus on delivering customized and inclusive beauty experiences to all consumers, rather than focusing on managing servers.
- Secure: We have strict security and compliance requirements which vary by country, and we employ a zero-trust security strategy. We must keep both our own internal data and customer data safe and encrypted.
- Sustainable : Our data lives in multiple environments, including on-prem data centers and public cloud services. We must be able to securely access and analyze this data while minimizing the complexity and environmental impact of moving and duplicating data.
- End-to-end supervision: Because developers shouldn’t be managing servers, we need a “single pane of glass” dashboard to monitor and triage the system if something goes wrong.
- Easy-to-deploy: Deploying code safely should not compromise velocity. We are constantly developing innovations that push the boundaries of science and reinvent beauty rituals. We need integrated tools to make our code deployment process seamless and safe.
- Event-driven architecture: Our data is used globally by research, product, business and engineering teams with high expectations on data quality and timeliness. Many of our internal processes and analysis are based on near real-time data.
- Data products delivered “as a service”: We want to empower our employees to drive business value at record speed. To that end, we need solutions that enable us to remove the developers from the critical path of solution delivery as much as possible.
- Extract-load-transform (ELT): Our goal is to implement the pattern to load data as soon as possible into the data warehouse to take advantage of SQL transformations.
After considering multiple vendors on the market, with these principles in mind, we landed on end-to-end Google Cloud serverless and data tooling. We were already using Google Cloud for a few processes, including BigQuery, and loved the experience.
We’ve now expanded our use of Google Cloud to fully support the L’Oréal Beauty Tech Data Platform.
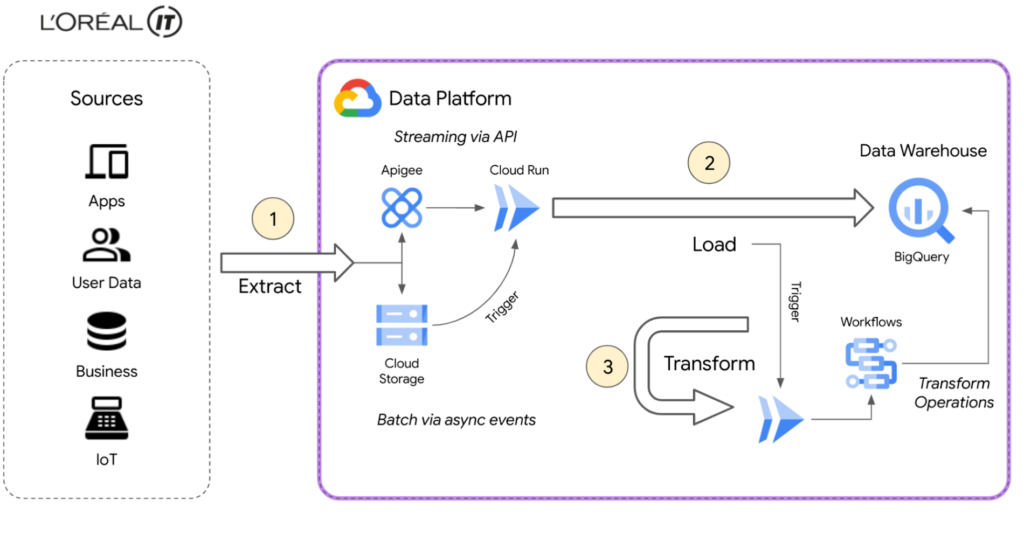
L’Oréal’s Beauty Tech Data Platform incorporates data from two types of sources: directly via API, which is data that adapts easily to our schema and is inserted directly into BigQuery, and bulk data from integrations, which require event-driven transformations using Eventarc mechanisms. These transformations are performed in Cloud Run and Cloud Functions (2nd gen), or directly in SQL. With Google Cloud, we can adapt very quickly.
Today, we currently have 8500 flows for ~5000 users using the native zero-trust capabilities offered by Google Cloud. Indeed, the flows come from Google Cloud and other third-party services.
BigQuery enabled us to adopt standard SQL as our universal language in our data warehouse and meet all expectations for queries and reporting. We were also able to load original data using features like federated queries, and efficiently transitioned from ETL to ELT data ingestion by handling semi-structured data with SQL. This approach of loading original data from sources into BigQuery with non-destructive transformations allows us to reprocess data for new use-cases easily, directly within BigQuery.
Our applications are hosted on multiple environments – on-premises, in Google Cloud, and in other public clouds. This made it difficult for our data engineers and analysts to natively analyze data across clouds until we started using BigQuery Omni. This capability of BigQuery allowed us to globally access and analyze data across clouds through a single pane of glass using the native BigQuery user interface itself. Without BigQuery Omni, it would’ve been impossible for our teams to natively do cross-cloud analytics. Moreover, it eliminated the need for us to move sensitive data, which is not only expensive because of local tax and subsea transport, but also incredibly risky – sometimes even forbidden – because of local regulations.
Today Google Cloud powers our Beauty Tech Data Platform, which stores 100TB of production data in BigQuery and processes 20TB of data each month. We have more than 8000 governed datasets, and 2 millions of BigQuery tables coming from multiple data sources such as Salesforce, SAP, Microsoft, and Google Ads.
For more complex transformations where custom and specific libraries are required, Cloud Workflows help us to manage the complexity very efficiently by orchestrating steps in containers through Cloud Run, Cloud Functions and even BigQuery jobs — the most used way to transform and add value to the L’Oréal data.
Additionally, by using BigQuery and Google Cloud’s serverless compute for API ingestion, bulk data loading, and post-loading transformations, we can keep the entire system in a single boundary of trust at a fraction of the cost. With ingest, queries, and transformations all being fully elastic and on-demand, we no longer have to perform capacity planning for either the compute or analytics components of the system. And of course these services’ pay-as-you-go model perfectly aligns with L’Oréal’s strategy of only paying for something when you use it.
Google Cloud fulfilled the requirements of our Beauty Tech Data Platform. And as if offering us a no-ops, secure, easy-to-deploy, custom-development free, event-based platform with end-to-end supervision wasn’t enough, Google Cloud also helped us with our sustainability efforts.
Being able to measure and understand the environmental footprint of our public cloud usage is also a key part of our sustainable tech roadmap. With Google Cloud Carbon Footprint, we can easily see the impact of our sustainable infrastructure approach and architecture principles. Our Beauty Tech platform is a strategic ambition for L’Oréal: inventing the beauty products of the future while becoming the company of the future.
Sustainable tech is an imperative and a very important step towards this ambition of creating responsible beauty for our consumers, and sustainable-by-design tech services for our employees. We all have a role to play, and by joining forces, we can have a positive impact.
Google Cloud’s data ecosystem and serverless tools are highly complementary, and made it possible to build a next-generation data analytics platform that met all our needs.
Get started using serverless and BigQuery together on Google Cloud today.
Google Cloud Next 21 for Data Analytics Unplugged

4951
Of your peers have already read this article.
4:30 Minutes
The most insightful time you'll spend today!
October 23rd (this past Saturday!) was my 4th Googlevarsery and we are wrapping an incredible Google Next 2021!
When I started in 2017, we had a dream of making BigQuery Intelligent Data Warehouse that would power every organization’s data driven digital transformation.
This year at Next, It was amazing to see Google Cloud’s CEO, Thomas Kurian, kick off his keynote with CTO of WalMart, Suresh Kumar , talking about how his organization is giving its data the “BigQuery treatment”.
AS I recap Next 2021 and reflect on our amazing journey over the past 4 years, I’m so proud of the opportunity I’ve had to work with some of the world’s most innovative companies from Twitter to Walmart to Home Depot, Snap, Paypal and many others.
So much of what we announced at Next is the result of years of hard work, persistence and commitment to delivering the best analytics experience for customers.
I believe that one of the reasons why customers choose Google for data is because we have shown a strong alignment between our strategy and theirs and because we’ve been relentlessly delivering innovation at the speed they require.
Unified Smart Analytics Platform
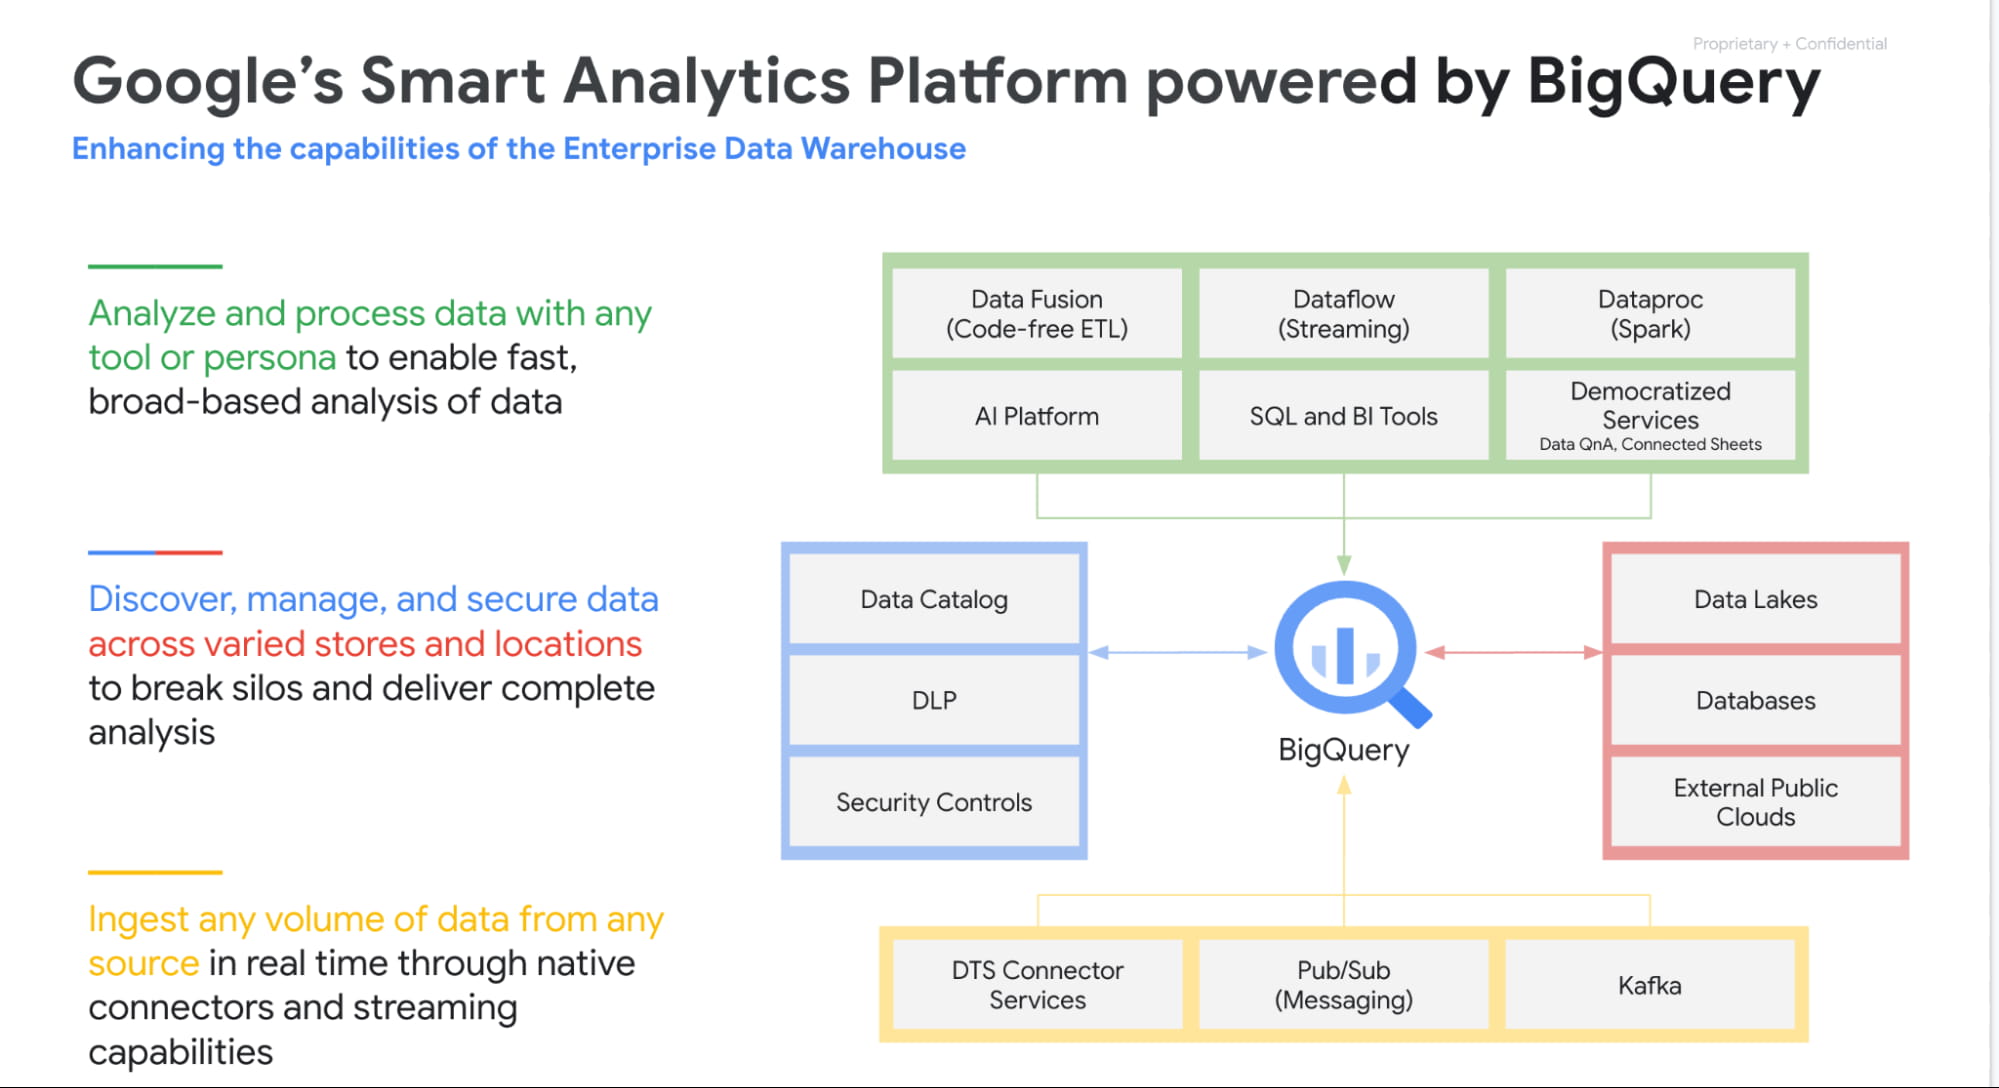
Over the past 4 years our focus has been to build industries leading unified smart analytics platforms. BigQuery is at the heart of this vision and seamlessly integrates with all our other services. Customers can use BigQuery to query data in BigQuery Storage, Google Cloud Storage, AWS S3, Azure Blobstore, various databases like BigTable, Spanner, Cloud SQL etc. They can also use any engine like Spark, Dataflow, Vertex AI with BigQuery. BigQuery automatically syncs all its metadata with Data Catalog and users can then run a Data Loss Prevention service to identify sensitive data and tag it. These tags can then be used to create access policies.
In addition to Google services, all our partner products also integrate with BigQuery seamlessly. Some of the key partners highlighted at Next 21 included Data Ingestion (Fivetran, Informatica & Confluent), Data preparation (Trifacta, DBT), Data Governance (Colibra), Data Science (Databricks, Dataiku) and BI (Tableau, PowerBI, Qlik etc).
Planet Scale analytics with BigQuery
BigQuery is an amazing platform and over the past 11 years we have continued to innovate in various aspects. Scalability has always been a huge differentiator for BigQuery. BigQuery has many customers with more than 100 petabytes of data and our largest customer is now approaching an exabyte of data. Our large customers have run queries over trillions of rows.
But scale for us is not just about storing or processing a lot of data. Scale is also how we can reach every organization in the world. This is the reason we launched BigQuery Sandbox which enables organizations to get started with BigQuery without a credit card. This has enabled us to reach tens of thousands of customers. Additionally to make it easy to get started with BigQuery we have built integrations with various Google tools like Firebase, Google Ads, Google Analytics 360, etc.
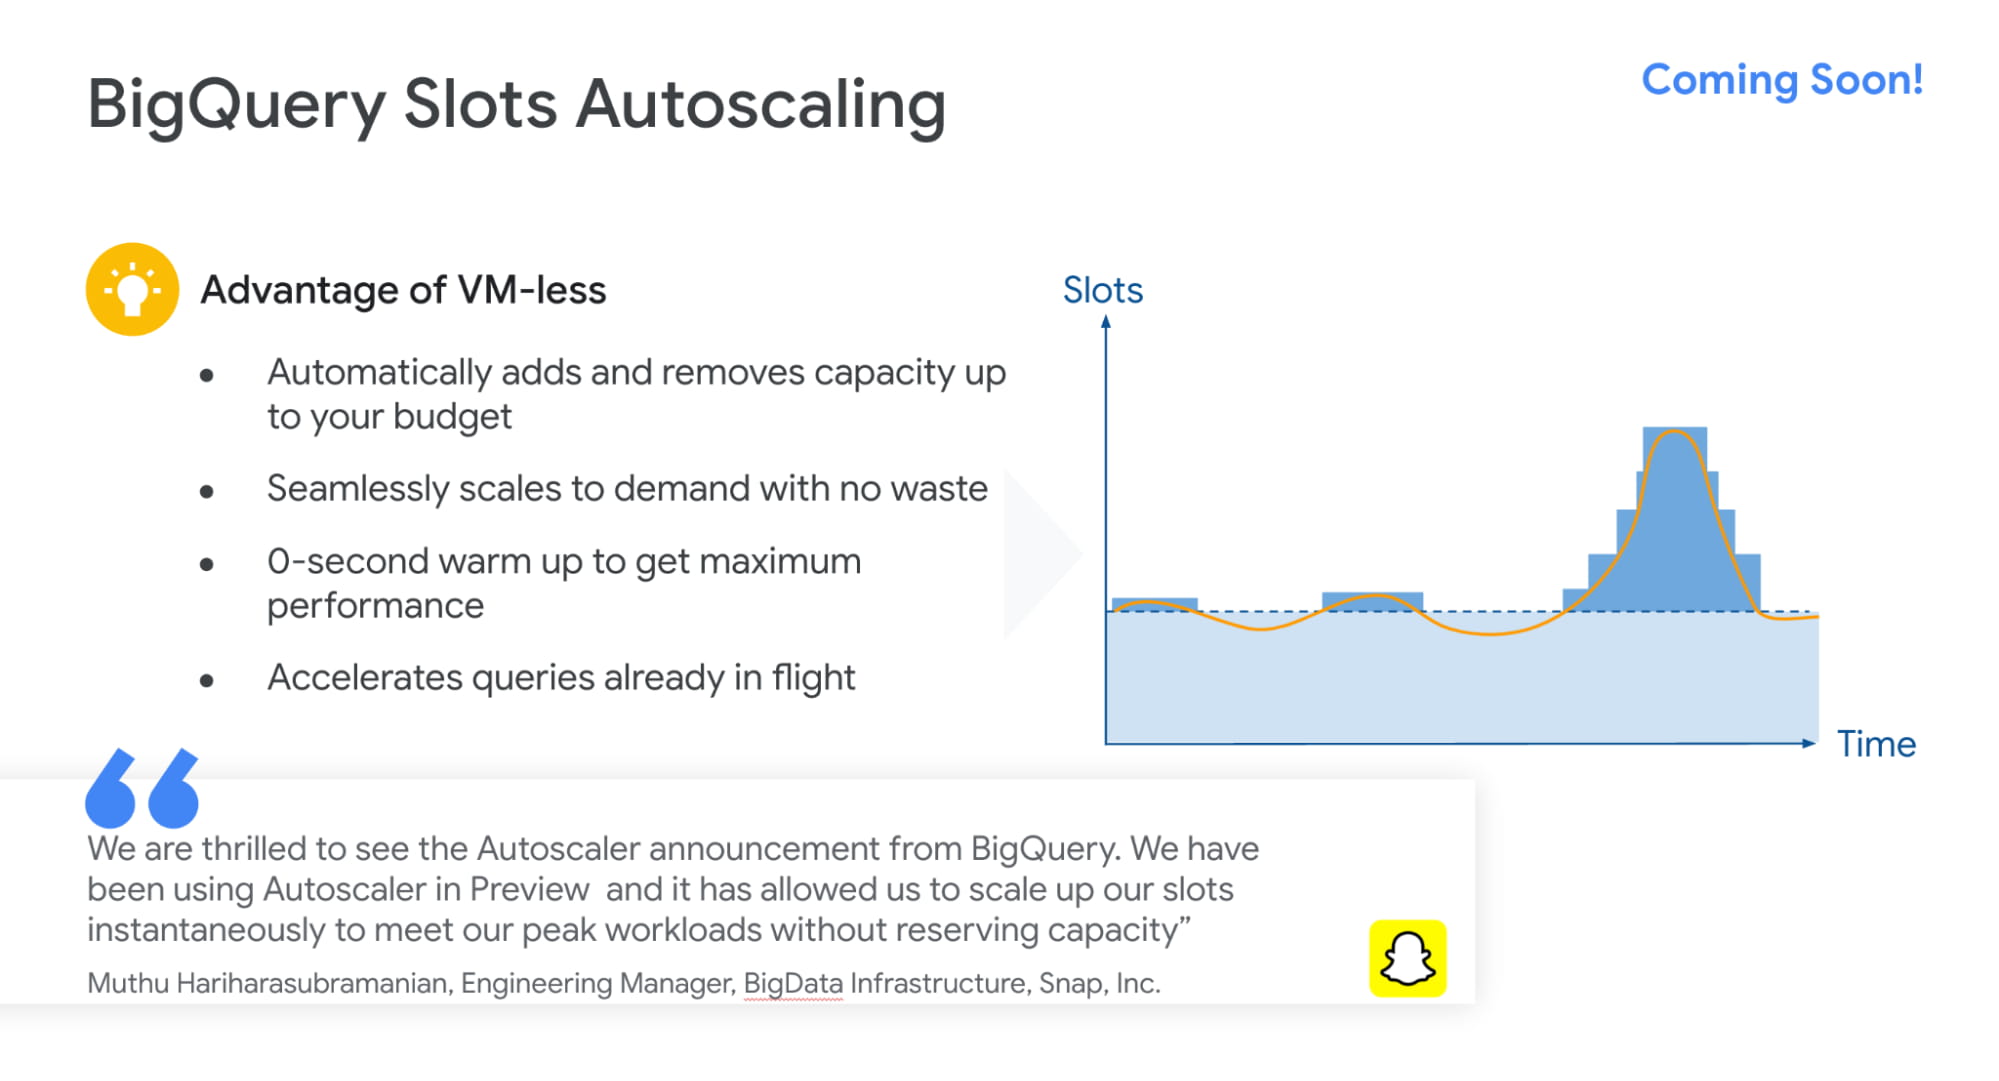
Finally, to simplify adoption we now provide options for customers to choose whether they would like to pay per query, buy flat rate subscriptions or buy per second capacity. With our autoscaling capabilities we can provide customers best value by mixing flat rate subscription discounts with auto scaling with flex slots.
Intelligent Data Warehouse to empower every data analyst to become a data scientist
BigQuery ML is one of the biggest innovations that we have brought to market over the past few years. Our vision is to make every data analyst a data scientist by democratizing Machine learning. 80% of time is spent in moving, prepping and transforming data for the ML platform. This also causes a huge data governance problem as now every data scientist has a copy of your most valuable data. Our approach was very simple. We asked:”what if we could bring ML to data rather than taking data to an ML engine?”
That is how BigQuery ML was born. Simply write 2 lines of SQL code and create ML models.
Over the past 4 years we have launched many models like regression, matrix factorization, anomaly detection, time series, XGboost, DNN etc. These models are used by customers to solve complex business problems simply from segmentation, recommendations, time series forecasting, package delivery estimation etc. The service is very popular: 80%+ of our top customers are using BigQueryML today. When you consider that the average adoption rate of ML/AI is in the low 30%, 80% is a pretty good result!

We announced tighter integration of BQML with Vertex AI. Model explainability will provide the ability to explain the results of predictive ML classification and regression models by understanding how each feature contributes to the predicted result. Also users will be able to manage, compare and deploy BigQuery ML models in Vertex; leverage Vertex Pipelines to train and predict BigQuery ML models.
Real-time streaming analytics with BigQuery
Customer expectations are changing and everyone wants everything in an instant: according to Gartner, by the end of 2024, 75% of enterprises will shift from piloting to operationalizing AI, driving a 5X increase in streaming data and analytics infrastructures.
The BigQuery’s storage engine is optimized for real-time streaming. BigQuery supports streaming ingestion of 10s of millions of events in real-time and there is no impact on query performance. Additionally customers can use materialized views and BI Engine (which is now GA) on top of streaming data. We guarantee always fast, always fresh data. Our system automatically updates MVs and BI Engine.
Many customers also use our PubSub service to collect real-time events and process these through Dataflow prior to ingesting into BigQuery. This is a streaming ETL pattern which is very popular. Last year,we announced PubSub Lite to provide customers with a 90% lower price point and aTCO that is lower than any DIY Kafka deployment.
We also announced Dataflow Prime, it is our next generation platform for Dataflow. Big Data processing platforms have only focused on horizontal scaling to optimize workloads. But we have seen new patterns and use cases like streaming AI where you may have a few steps in pipelines that perform data prep and then customers have to run a GPU based model. Customers want to use different sizes and shapes of machines to run these pipelines in the most optimum manner. This is exactly what Dataflow Prime does. It delivers vertical auto scaling with the right fitting for your pipelines. We believe this should lower costs for pipelines significantly.
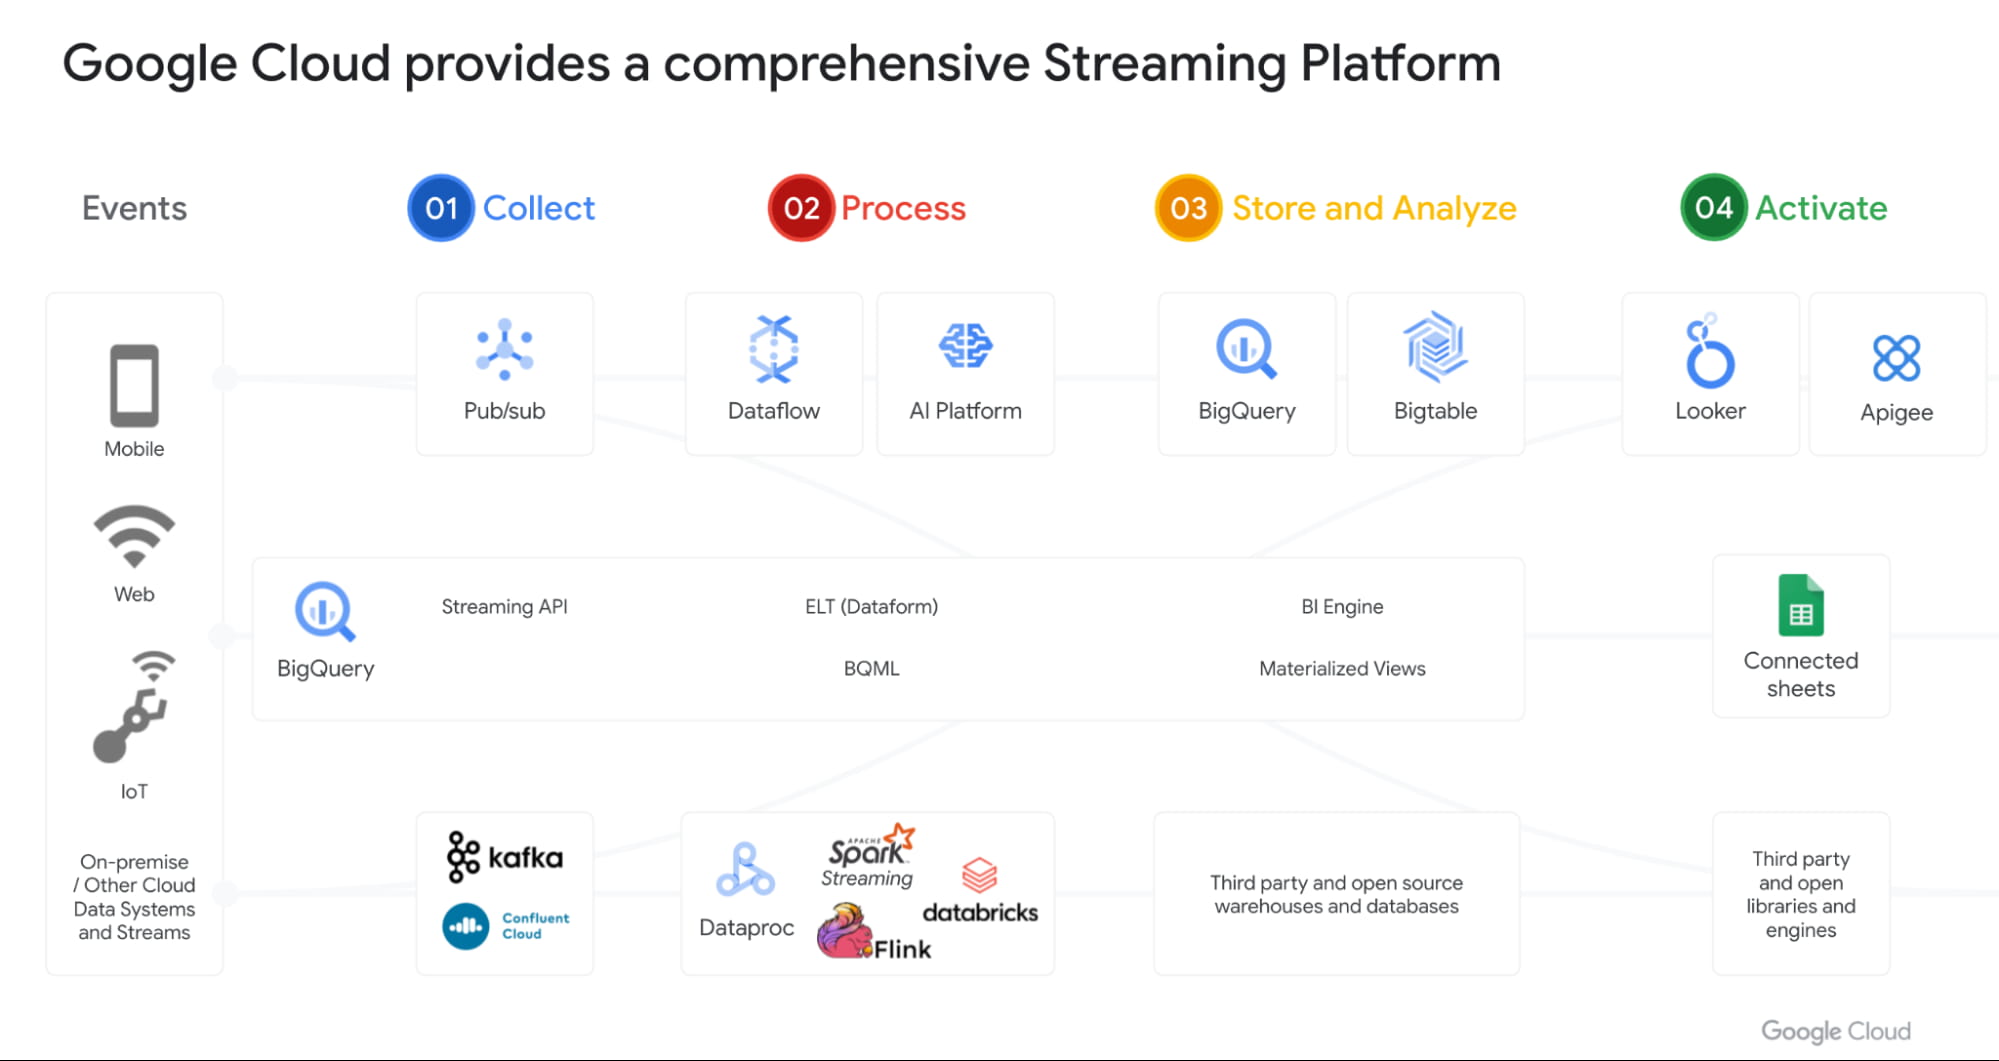
With Datastream as our change data capture service (built on Alooma technology), we have solved the last key problem space for customers. We can automatically detect changes in your operational databases like MySQL, Postgres, Oracle etc and sync them in BigQuery.
Most importantly, all these products work seamlessly with each other through a set of templates. Our goal is to make this even more seamless over next year.
Open Data Analytics with BigQuery
Google has always been a big believer in Open Source initiatives. Our customers love using various open source offerings like Spark, Flink, Presto, Airflow etc. With Dataproc & Composer our customers have been able to run various of these open source frameworks on GCP and leverage our scale, speed and security. Dataproc is a great service and delivers massive savings to customers moving from on-prem Hadoop environments. But customers want to focus on jobs and not clusters.
That’s why we launched Dataproc Serverless Spark (GA) offering at Next 2021. This new service adheres to one of our key design principles we started with: make data simple.
Just like with BigQuery, you can simply RUN QUERY. With Spark on Google Cloud, you simply RUN JOB. ZDNet did a great piece on this. I invite you to check it out!
Many of our customers are moving to Kubernetes and wanted to use that as the platform for Spark. Our upcoming Spark on GKE offering will give the ability to deploy spark workloads on existing Kubernetes clusters.
But for me the most exciting capability we have is, the ability to run Spark directly on BigQuery Storage. BigQuery storage is highly optimized analytical storage. By running Spark directly on it, we again bring compute to data and avoid moving data to compute.
BigSearch to power Log Analytics
We are bringing the power of Search to BigQuery. Customers already ingest massive amounts of log data into BigQuery and perform analytics on it. Our customers have been asking us for better support for native JSON and Search. At Next 21 we announced the upcoming availability of both these capabilities.
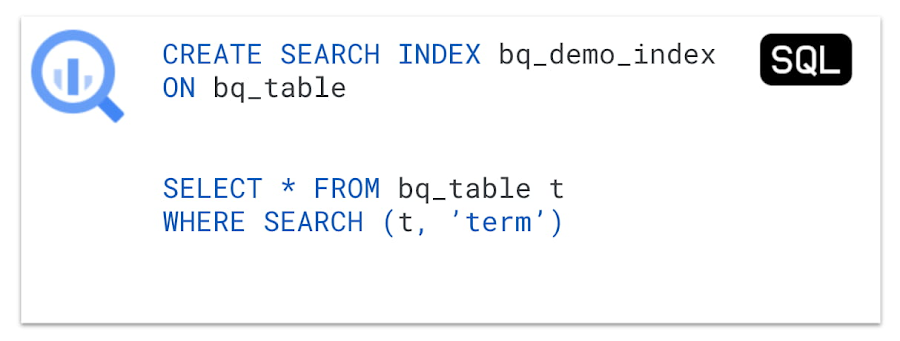
Fast cross column search will provide efficient indexing of structured, semi-structured and unstructured data. User friendly SQL functions let customers rapidly find data points without having to scan all the text in your table or even know which column the data resides in.
This will be tightly integrated with native JSON, allowing customers to get BigQuery performance and storage optimizations on JSON as well as search on unstructured or constantly changing data structures.
Multi & Cross Cloud Analytics
Research on multi cloud adoption is unequivocal — 92% of businesses in 2021 report having a multi cloud strategy. We have always believed in providing customers choice to our customers and meeting them where they are. It was clear that all our customers wanted us to take our gems like BigQuery to other clouds as their data was distributed on different clouds.
Additionally it was clear that customers wanted cross cloud analytics not multi-cloud solutions that can just run in different clouds. In short, see all their data with a single pane of glass, perform analysis on top of any data without worrying about where it is located, avoid egress costs and finally perform cross cloud analysis across datasets on different clouds.
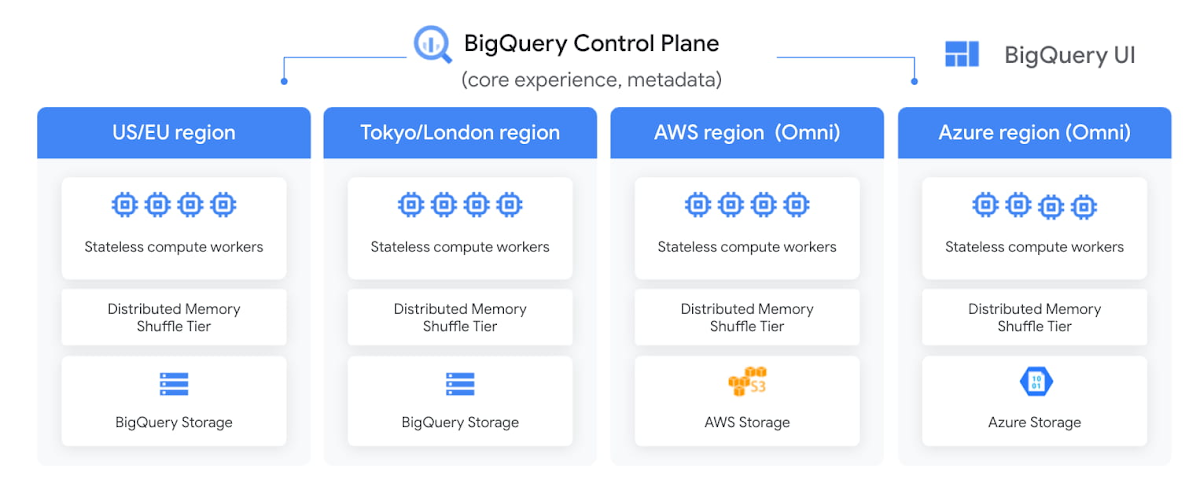
With BigQuery Omni, we deliver on this vision, with a new way of analyzing data stored in multiple public clouds. Unlike competitors, BigQuery Omni does not create silos across different clouds. BigQUery provides a single control plane that shows an analyst all data they have access to across all clouds. Analyst just writes the query and we send it to the right cloud across AWS, Azure or GCP to execute it locally. Hence no egress costs are incurred.
We announced BQ Omni GA for both AWS and Azure at Google Next 21 and I’m really proud of the team for delivering on this vision. Check out Vidya’s session and learn from Johnson and Johnson how they innovate in a multi-cloud world.
Geospatial Analytics with BigQuery and Earth Engine
We have partnered with our Google Geospatial team to deliver GIS functionality inside BigQuery over the years. At Next we announced that customers will be able to integrate Earth Engine with BigQuery, Google Cloud’s ML technologies, and Google Maps Platform.
Think about all the scenarios and use-cases your team’s going to be able to enable sustainable sourcing, saving energy or understanding business risks.
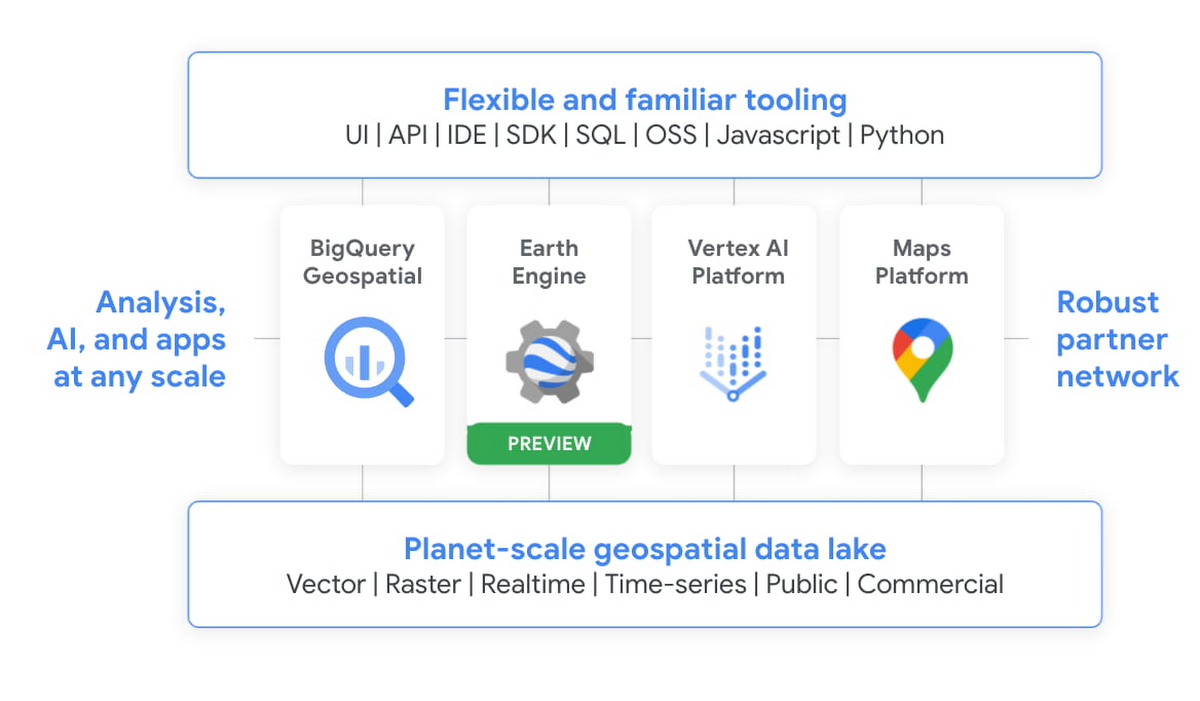
We’re integrating the best of Google and Google Cloud together to – again – make it easier to work with data to create a sustainable future for our planet.
BigQuery as a Data Exchange & Sharing Platform
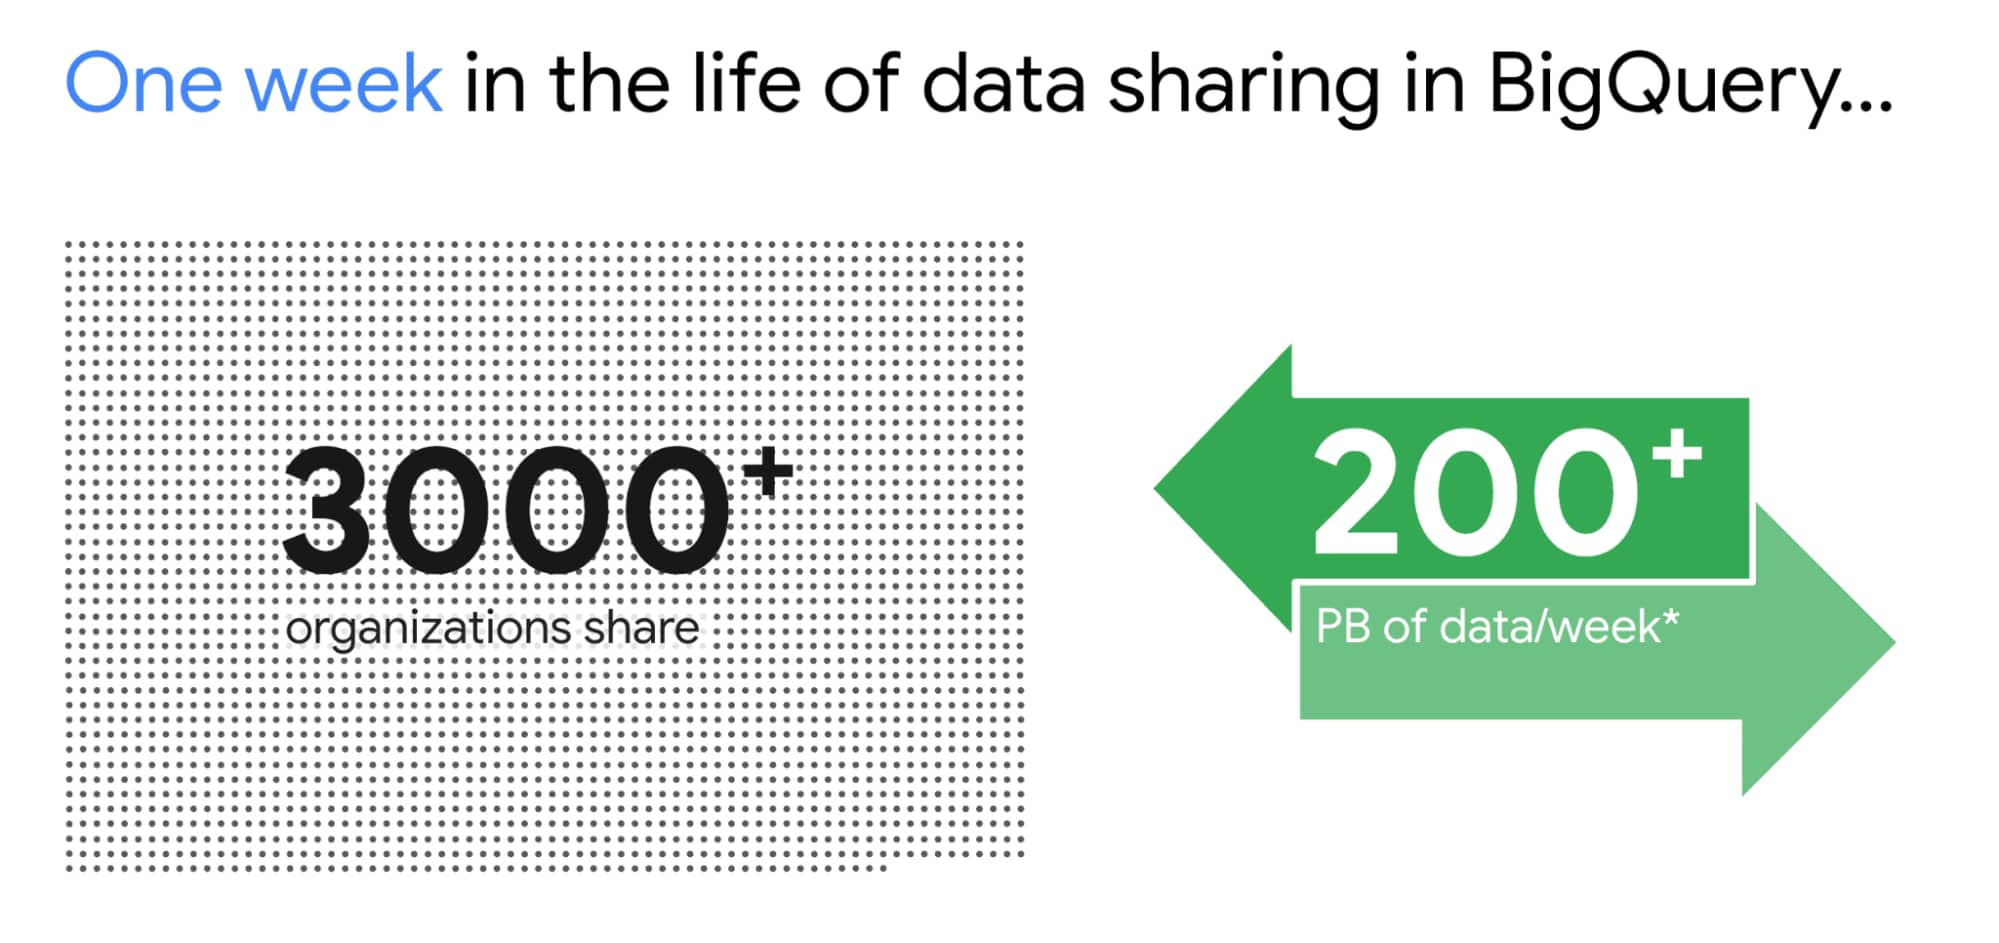
BigQuery was built to be a sharing platform. Today we have 3000+ organizations sharing more than 250 petabytes of data across organizations. Google also brings more than 150 public datasets to be used across various use cases. In addition to this, we are also bringing some of the most unique datasets like Google Trends to BigQuery. This will enable organizations to understand in real-time trends and apply to their business problems.
I am super excited about the Analytics Hub Preview announcement. Analytics Hub will provide the ability for organizations to build private and public analytics exchanges. This will include data, insights, ML Models and visualizations. This is built on top of the industry leading security capabilities of BigQuery.

Breaking Data Silos
Data is distributed across various systems in the organization and making it easy to break the data silo and make all this data accessible to all is critical. I’m also particularly excited about the Migration Factory we’re building with Informatica and the work we are doing for data movement, intelligent data wrangling with players like Trifacta and FiveTran, with whom we share over 1,000 customers (and growing!). Additionally we continue to deliver native Google service to help our customers.
We acquired Cask in 2018 and launched our self service Data Integration service in Data Fusion. Now Fusion allows customers to create complex pipelines with just simple drag and drop. This year we focused on unlocking SAP data for our customers. We have launched various SAP connectors and accelerators to achieve this.
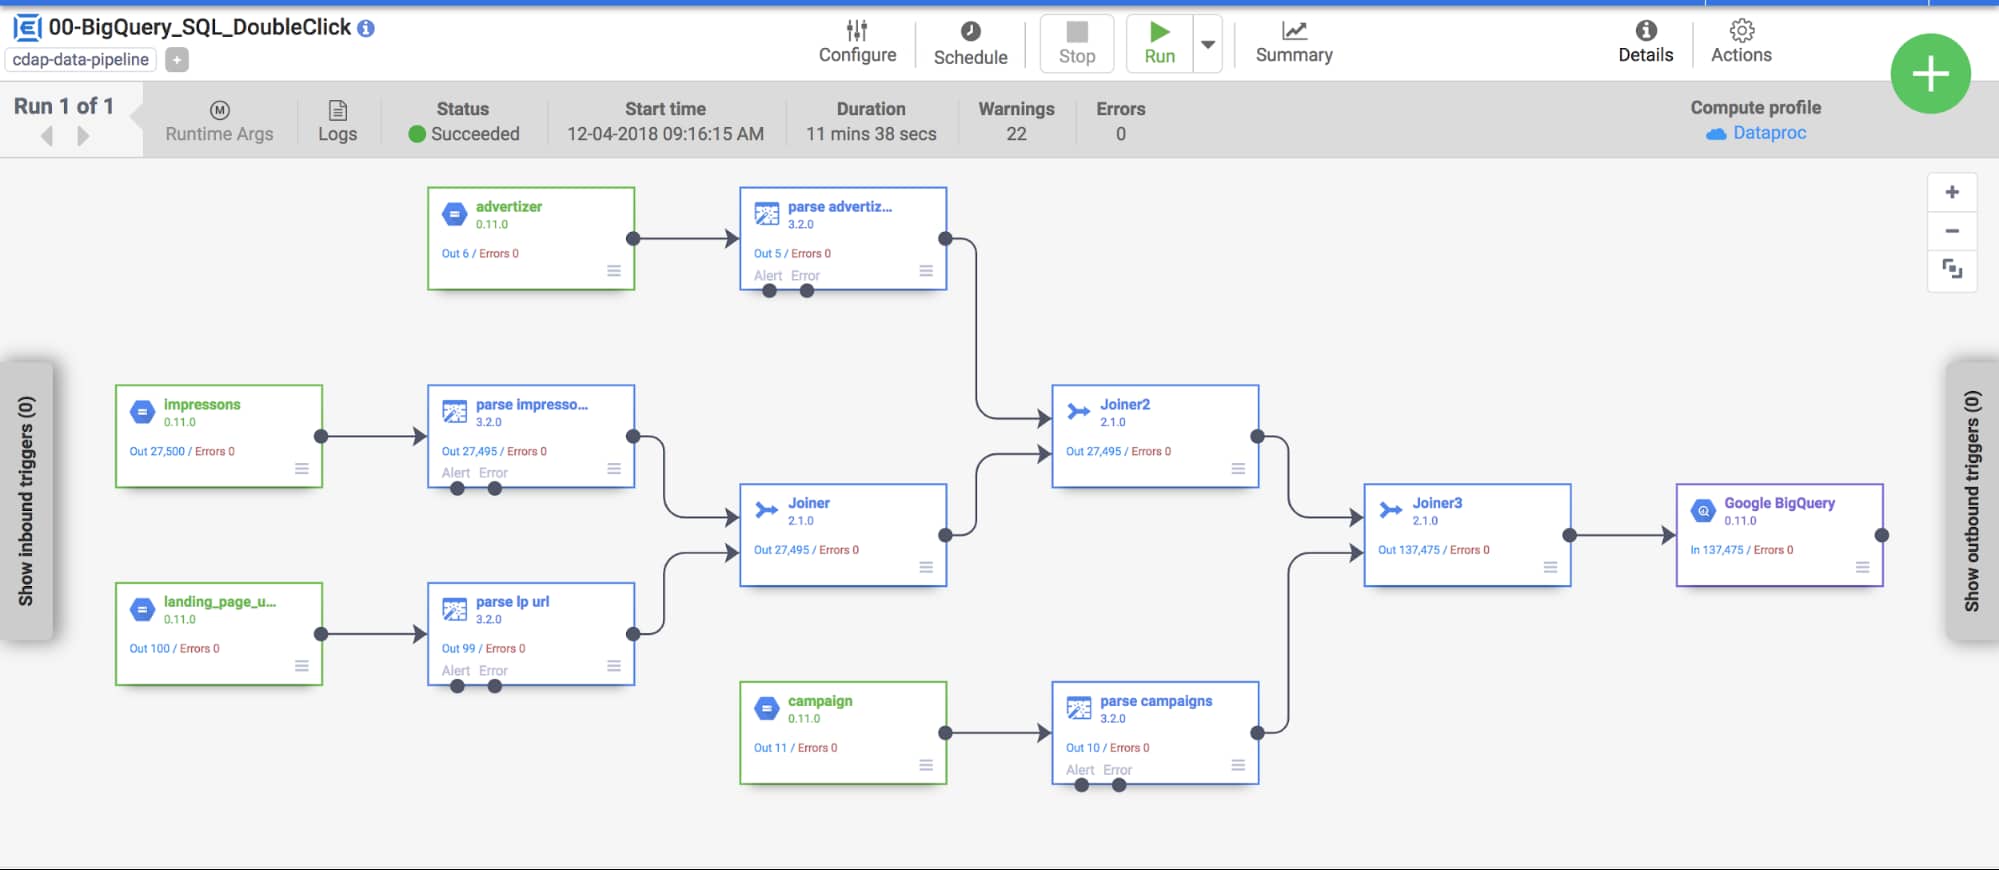
At GCP Next we also announced our BigQuery Migration service in preview. Many of our customers are migrating their legacy data warehouses and data lakes to BigQuery. BigQuery Migration Service provides end-to-end tools to simplify migrations for these customers.
And today, to make migrations to BigQuery easier for even more customers, I am super excited to announce the acquisition of CompilerWorks. CompilerWorks’ Transpiler is designed from the ground up to facilitate SQL migration in the real world and will help our customers accelerate their migrations. It supports migrations from over 10 legacy enterprises data warehouses and we will be making it available as part of our BigQuery Migration service in the coming months.
Data Democratization with BigQuery
Over the past 4 years we have focused a lot on making it very easy to derive actionable insights from data in BigQuery. Our priority has been to provide a strong ecosystem of partners that can provide you with great tools to achieve this but also deliver native Google capabilities.
With our BI engine GA announcement which we introduced in 2019, previewed earlier this year and showcased with tools like Microsoft PowerBI and Tableau, is now available for all to play with.

BigQuery + Data Studio are like peanut butter and Jelly. They just work well together. We launched BI Engine first with Data Studio and scaled it to all the users. More than 40% of our BigQuery customers use Data Studio. Once we knew BI Engine works extremely well we now have made it an integral part of BigQuery API and launched it for all our internal and partner BI tools.
We announced GA for BI Engine at Next 2021 but we were already GA with Data Studio for the past 2 years. We recently moved the Data Studio team back into Google Cloud making the partnership even stronger. If you have not used Data Studio, I encourage you to take a look and get started for free today here!!
Connected Sheets for BigQuery is one of my favorite combinations. You can give every business user in your organization the ability to analyze billions of records using standard Google Sheets experience. I personally use it everyday to analyze all our product data.
We acquired Looker in Feb 2020 with a vision of providing a semantic modeling layer to our customers with a governed BI solution. Looker is tightly integrated with BigQuery including BigQuery ML. Our latest partnership with Tableau where Tableau customers will soon be able to leverage Looker’s semantic model, enabling new levels of data governance while democratizing access to data.
Finally, I have a dream that one day we will bring Google Assistant to your enterprise data. This is the vision of Data QnA. We are in early innings on this and we will continue to work hard to make this vision a reality.
Intelligent Data Fabric to unify the platform
Another important trend that shaped our market is the Data Mesh. Earlier this year, Starburst invited me to talk about this very topic. We have been working for years on this concept, and although we would love for all data to be neatly organized in one place, we know that our customers’ reality is that it is not (If you want to know more about this, read about my debate on this topic with Fivetran’s George Fraser, a16z’s Martin Casado and Databricks’ Ali Ghodsi).
Everything I’ve learned from customers over my years in this field is that they don’t just need a data catalog or a set of data quality and governance tools, they need an intelligent data fabric. That is why we created Dataplex, whose general availability we announced at Next.
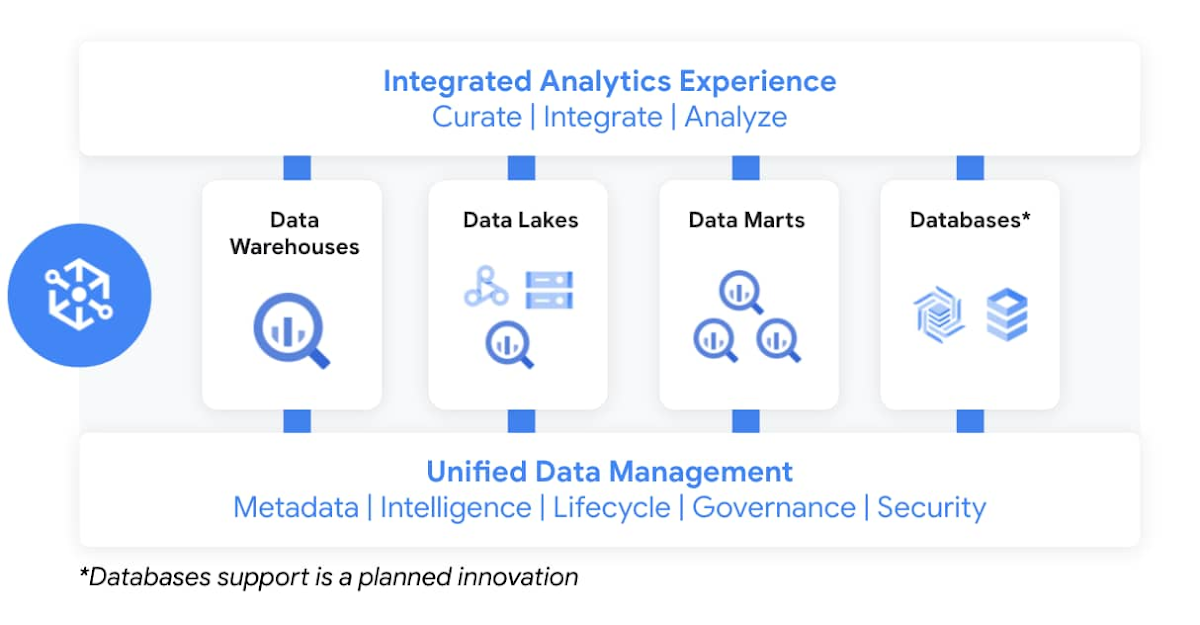
Dataplex enables customers to centrally manage, monitor, and govern data across data lakes, data warehouses, and data marts, while also ensuring data is securely accessible to a variety of analytics and data science tools. It lets customers organize and manage data in a way that makes sense for their business, without data movement or duplication. It provides logical constructs – lakes, data zones, and assets – which enable customers to abstract away the underlying storage systems to build a foundation for setting policies around data access, security, lifecycle management, and so on. Check out Prajakta Damle’s session and learn from Deutsche Bank how they are thinking about a unified data mesh across distributed data.
Closing Thoughts
Analysts have recognized our momentum and, as I look back at this year, I couldn’t thank our customers and partners enough for the support they provided my team and I across our large Data Analytics portfolio: in March, Google BigQuery was named a Leader in The Forrester Wave™: Cloud Data Warehouse, Q1 2021. And in June, Dataflow was named a Leader in The Forrester Wave™: Streaming Analytics, Q2 2021 report.
If you want to get a taste for why customers choose us over other hyperscalers or cloud data warehousing, I suggest you watch the Data Journey series we’ve just launched, which documents the stories of organizations modernizing to the cloud with us.
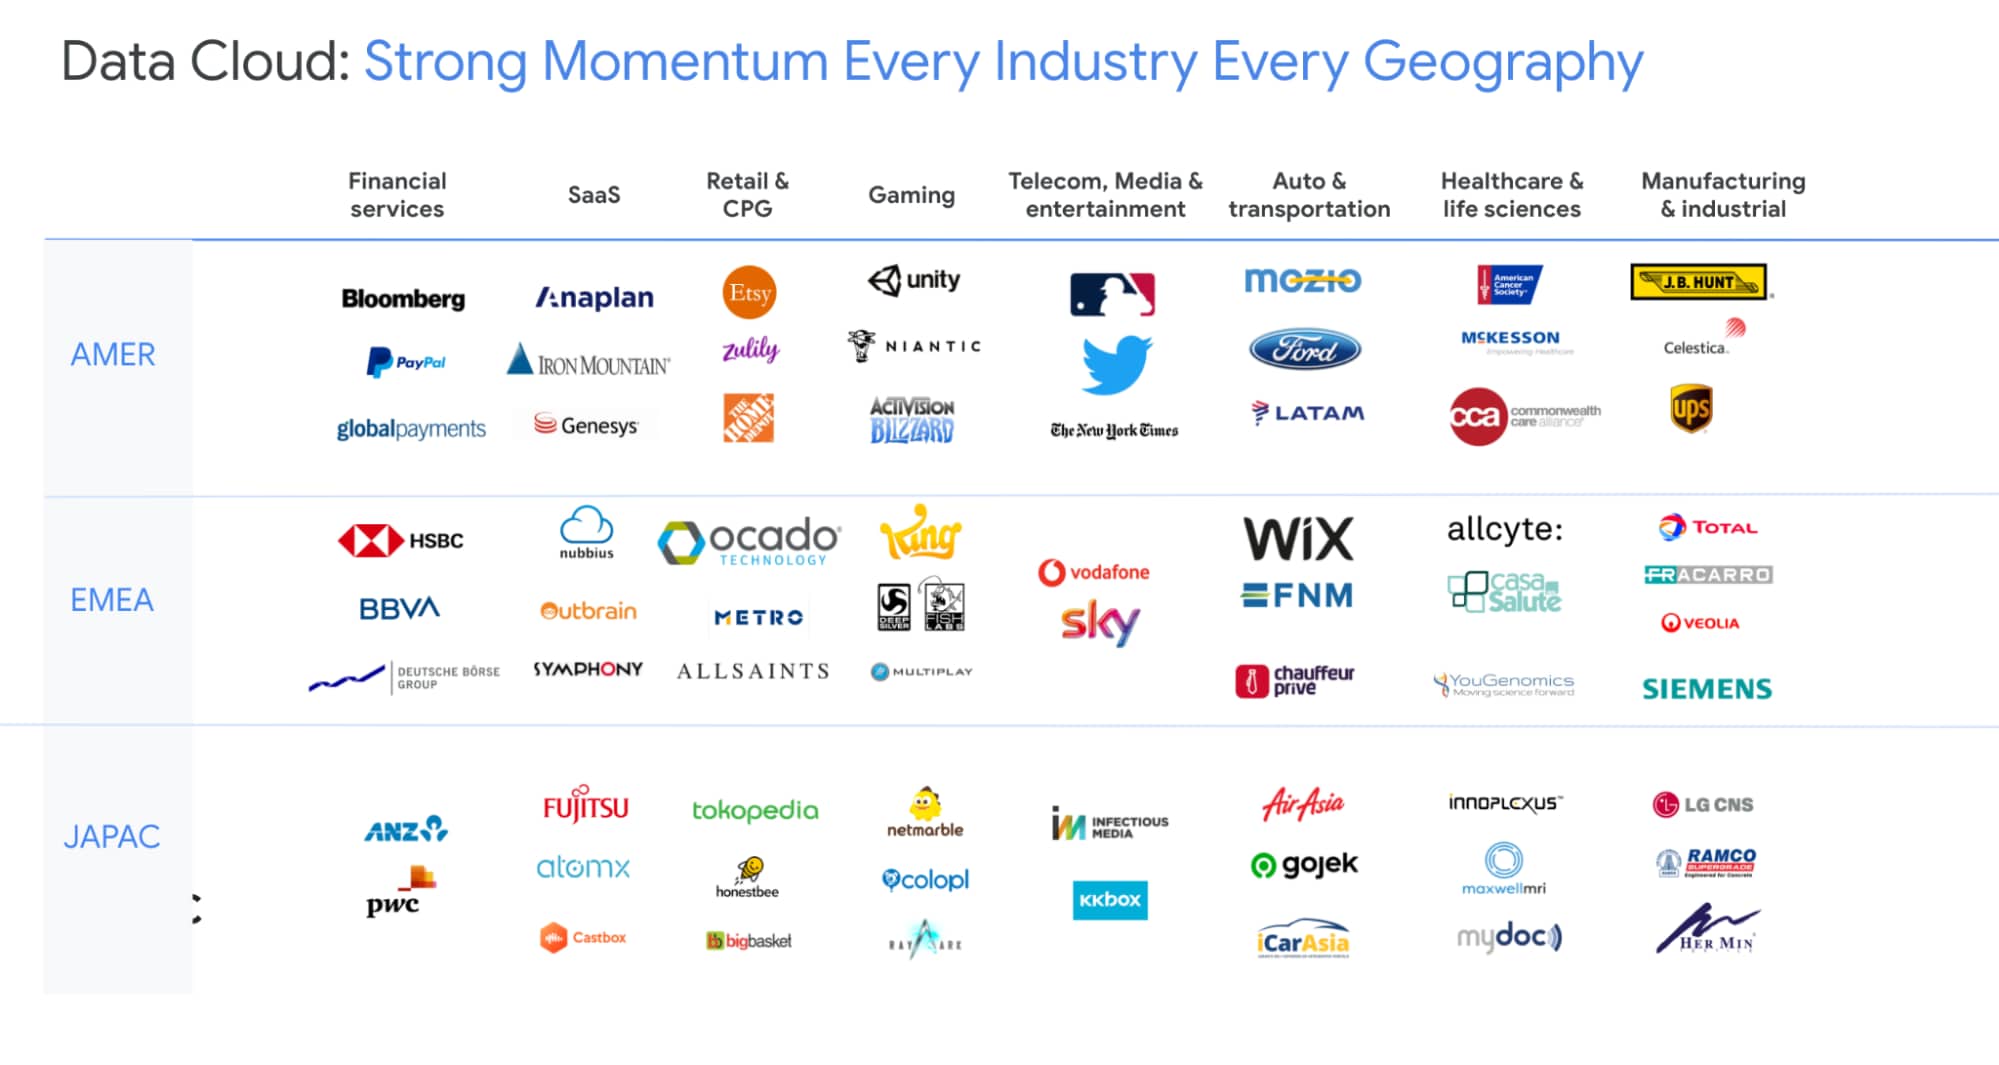
The Google Cloud Data Analytics portfolio has become a leading force in the industry and I couldn’t be more excited to have been part of it. I do miss you, my customers and partners, and I’m frankly bummed that we didn’t get to meet in person like we’ve done so many times before (see a photo of my last in-person talk before the pandemic), but this Google Next was extra special, so let’s dive into the product innovation and their themes.
I hope that I will get to see you in person next time we run Google Next!

Gartner Identifies Critical Capabilities for Data Management Solutions
DOWNLOAD WHITEPAPER4000
Of your peers have already downloaded this article
3:30 Minutes
The most insightful time you'll spend today!
Data management solutions for analytics offerings are consolidating, with major vendors able to address a range of use cases and smaller vendors addressing a subset of use cases. Data and analytics leaders can use this research to guide evaluation and initial vendor selection for DMSA offerings.
For data and analytics leaders responsible for data management solutions as part of strategizing and planning information infrastructure should:
- Evaluate the capabilities of incumbent solution(s) against new use cases, to determine if existing expertise could be used to reduce development time with a good-enough solution already in place.
- Plan on using a heterogeneous solution landscape overall, but try and reduce duplication of effort by categorizing use cases with regard to their target deployment platform.
- Use a logical data warehouse architecture when you need to integrate separate data repositories efficiently, keeping in mind performance SLAs that may be impacted by remote access.
- Plan for eventual integration with other data silos when scoping the effort needed to implement a specific solution, to avoid crippling overhead caused by proliferating data silos.
Download this report to know more.
What Drives Your Organization to be Data-driven?

4888
Of your peers have already read this article.
4:00 Minutes
The most insightful time you'll spend today!
Every organization has its own unique data culture and capabilities. Yet each is expected to use technology trends and solutions in the same way as everyone else. Your organization may be built on years of legacy applications, you may have developed a considerable amount of expertise and knowledge, yet you may be asked to adopt a new approach based on a technology trend. On the other hand, you may be on the other side of the spectrum, a digitally native organization built with engineering principles from scratch without legacy systems but expected to follow the same principles as process driven, established organizations. The question is, should we treat these organizations in the same way when it comes to data processing? In this series of blogs and papers this is what we are exploring: how to set up an organization from the first principles from data analyst, data engineering and data science point of view. In reality, there is no such organization that is solely driven by one of these but it is likely to be a combination of multiple types. What type of organization you become is then driven by how much you are influenced by each of these principles.
When you are considering what data processing technology encompasses, take a step back and make a strategic decision based on your key goals. This can be whether you optimize for performance, cost, reduction in operational overhead, increase in operational excellence, integration of new analytical and machine learning approaches. Or perhaps you’re looking to leverage existing employees’ skills while meeting all your data governance and regulatory requirements. We will be exploring these different themes and will focus on how they guide your decision-making process. You may be coming from technologies which are solving some of the past problems and some of the terminologies may be more familiar, however they don’t scale your capabilities. There is also the opportunity cost of prioritizing legacy and new issues that arise from a transformation effort, and as a result your new initiative can set you further behind on your core business while you play catch up to an ever changing technology landscape.
Data value chain
The key for any ingestion and transformation tool is to extract data from a source and start acting on it. The ultimate goal is to reduce the complexity and increase the timeliness of the data. Without data, it is impossible to create a data driven organization and act on the insights. As a result, data needs to be transformed, enriched, joined with other data sources, and aggregated to make better decisions. In other words, insights on good timely data mean good decisions.
While deciding on the data ingestion pipeline, one of the best approaches is to look into the volume of data, the velocity of the data, and type of data that is arriving. Other considerations include the number of different data sources you are managing, whether you need to scale to thousands of sources using generic pipelines, whether you want to create one generic pipeline but then apply data quality rules and governance. ETL tools are ideal for this use case as generic pipelines can be written and then parameterized.
On the other hand, consider the data source. Can the data be directly ingested without transforming and formatting the data? If the data does not need to be transformed and can be ingested directly into the data warehouse as a managed solution. This not only reduces the operational costs but also allows for more timely data delivery. If the data is coming in through an unstructured format such as XML or in a format such as EBCDIC and needs to be transformed and formatted, then a tool with ETL Capabilities can be used depending on the speed of the data arrival.
It is also important to understand the speed and time of arrival of the data. Think about your SLAs and time durations/windows that are relevant for your data ingestion plans. This would not only drive the ingestion profiles but would also dictate which framework to use. As discussed above, velocity requirements would drive the decision-making process.
Type of Organization
Different organizations can be successful by employing different strategies based on the talent that they have. Just like in sports, each team plays with a different strategy with the ultimate goal of winning.
Organizations often need to decide on what’s the best strategy to take in respect to data ingestion and processing – whether you need to hire an expensive group of data engineers, or exploit your data wizards and analysts to enrich and transform data that can be acted on, or whether it would be more realistic to train the current workforce to do more functional/high value work rather than to focus on building generally understood and available foundational pieces.
On the other hand, the transformation part of ETL pipelines as we know it, dictates where the load will be. All of these are made a reality in the cloud native world where data can be enriched, aggregated, and joined. Loading data into a powerful and modern data warehouse means that you can already join and enrich the data using ELT. Consequently, ETL isn’t really needed in its strict terms anymore if the data can be loaded directly into the data warehouse.
All of the above was not possible in the traditional, siloed, and static data warehouses and data ecosystems whereby systems would not talk to each other or there were capacity constraints in respect to both storing and processing the data in the expensive Data Warehouse. This is no longer the case in the BigQuery world as storage is now cheap and transformations are now much more capable without constraints of virtual appliances.
If your organization is already heavily invested into an ETL tool, one option is to use them to load BigQuery and transform the data initially within the ETL tool. Once the as-is and to-be are verified to be matching, then with the improved knowledge and expertise one can start moving workloads into BigQuery SQL, and effectively do ELT.
Furthermore, if your organization is coming from a more traditional data warehouse that extensively relies on stored procedures and scripting, then the question that one may ask is, do I continue leveraging these skills and expertise and use these capabilities that are also provided in BigQuery? ELT with BigQuery is more natural, similar to what’s already in Teradata BTEQ, Oracle PL/SQL but migrating from ETL to ELT requires changes. This change then enables exploiting streaming use cases, such as real-time use cases in retail. This is because there is no preceding step before data is loaded and made available.
Organizations can be broadly classified under 3 types as Data Analyst Driven, Data Engineering driven, and Blended organization. We will be covering a Data Science driven organization within the Blended category.
Data Analyst Driven
Analysts understand the business and are used to using SQL/spreadsheets. Allowing them to do advanced analytics through interfaces that they are accustomed to enables scaling. As a result, easy to use ETL tooling to bring data quickly into the target system becomes a key driver. Ingesting data directly from a source or staging area then also becomes critical as it allows analysts to exploit their key skills using ELT and increases timeliness of the data. This is commonplace with traditional EDWs and realized by extended capabilities of using Stored Procedures and Scripting. Data is enriched, transformed, and cleansed using SQL and ETL tools act as the orchestration tools.
The capabilities brought by cloud computing on separation of data and computation changes the face of the EDW as well. Rather than creating complex ingestion pipelines, the role of the ingestion becomes, bringing data close to the cloud, staging on a storage bucket or on a messaging system before being ingested into the cloud EDW. This then releases data analysts to focus on looking into data insights using tools and interfaces that they are accustomed to.
Data Engineering / Data Science Driven
Building complex data engineering pipelines is expensive but enables increased capabilities. This allows creating repeatable processes and scaling the number of sources. Once complemented with cloud it enables agile data processing methodologies. On the other hand, data science organizations allow carrying out experiments and producing applications that work for specific use cases but are not often productionised or generalized.
Real-time analytics enables immediate responses and there are specific use cases where low latency anomaly detection applications are required to run. In other words, business requirements would be such that it has to be acted upon as the data arrives on the fly. Processing this type of data or application requires transformation done outside of the target.
All the above usually requires custom applications or state-of-the-art tooling which is achieved by organizations that excel with their engineering capabilities. In reality, there are very few organizations that can be truly engineering organizations. Many fall into what we call here as the blended organization.
Blended org
The above classification can be used on tool selection for each project. For example, rather than choosing a single tool, choose the right tool for the right workload, because this would reduce operational cost, license cost and use the best of the tools available. Let the deciding factor be driven by business requirements: each business unit or team would know the applications they need to connect with to get valuable business insights. This coupled with the data maturity of the organization would be the key to making sure the right data processing tool would be the right fit.
In reality, you are likely to be somewhere on a spectrum. Digital native organizations are likely to be closer to being engineering driven, due to their culture and business that they are in. However, brick and mortar organizations would be closer to being analyst driven due to the significant number of legacy systems and processes they possess. These organizations are either considering or working toward digital transformation with an aspiration of having a data engineering / software engineering culture like Google.
The blended organization with strong skills around data engineering, would have built the platform and built frameworks, to increase reusable patterns would increase productivity and then reduce costs. Data engineers focus on running Spark on Kubernetes whereas infrastructure engineers focus on container work. This in turn provides unparalleled capabilities as application developers focus on the data pipelines and even the underlying technologies or platforms changes code stays the same. As a result, security issues, latency requirements, cost demands and portability are addressed at multiple layers.
Conclusion – What type of organization are you?
Often an organization’s infrastructure is not flexible enough to react to a fast changing technological landscape. Whether you are part of an organization which is engineering driven or analyst driven, organizations frequently look at technical requirements that inform which architecture to implement. But a key, and frequently overlooked, component needed to truly become a data-driven organization is the impact of the architecture on your data users. When you take into account the responsibilities, skill sets, and trust of your data users, you can create the right data platform to meet the needs of your IT department as well as your business.
To become a truly data-driven organization, the first step is to design and implement an analytics data platform that meets your technical and business needs. The reality is that each organization is different and has a different culture, different skills, and capabilities. Key is to leverage its strengths to stay competitive while adopting new technologies when it is needed and as it fits to your organization.
To learn more about the elements of how to build an analytics data platform depending on the organization you are, read our paper here.
New Capabilities in BigQuery to Ease Anomalies Detection in the Absence of Labeled Data

6337
Of your peers have already read this article.
4:00 Minutes
The most insightful time you'll spend today!
When it comes to anomaly detection, one of the key challenges that many organizations face is that it can be difficult to know how to define what an anomaly is. How do you define and anticipate unusual network intrusions, manufacturing defects, or insurance fraud? If you have labeled data with known anomalies, then you can choose from a variety of supervised machine learning model types that are already supported in BigQuery ML. But what can you do if you don’t know what kind of anomaly to expect, and you don’t have labeled data? Unlike typical predictive techniques that leverage supervised learning, organizations may need to be able to detect anomalies in the absence of labeled data.
Today we are announcing the public preview of new anomaly detection capabilities in BigQuery ML that leverage unsupervised machine learning to help you detect anomalies without needing labeled data. Depending on whether or not the training data is time series, users can now detect anomalies in training data or on new input data using a new ML.DETECT_ANOMALIES function (documentation), with the following models:
- Autoencoder model, now in Public Preview (documentation)
- K-means model, already GA (documentation)
- ARIMA_PLUS time series model, already GA (documentation)
How does anomaly detection with ML.DETECT_ANOMALIES work?
To detect anomalies in non-time-series data, you can use:
- K-means clustering models: When you use
ML.DETECT_ANOMALIESwith a k-means model, anomalies are identified based on the value of each input data point’s normalized distance to its nearest cluster. If that distance exceeds a threshold determined by the contamination value provided by the user, the data point is identified as an anomaly. - Autoencoder models: When you use
ML.DETECT_ANOMALIESwith an autoencoder model, anomalies are identified based on the reconstruction error for each data point. If the error exceeds a threshold determined by the contamination value, it is identified as an anomaly.
To detect anomalies in time-series data, you can use:
- ARIMA_PLUS time series models: When you use
ML.DETECT_ANOMALIESwith an ARIMA_PLUS model, anomalies are identified based on the confidence interval for that timestamp. If the probability that the data point at that timestamp occurs outside of the prediction interval exceeds a probability threshold provided by the user, the datapoint is identified as an anomaly.
Below we show code examples of anomaly detection in BigQuery ML for each of the above scenarios.
Anomaly detection with a k-means clustering model
You can now detect anomalies using k-means clustering models, by running ML.DETECT_ANOMALIES to detect anomalies in the training data or in new input data. Begin by creating a k-means clustering model:
Language: SQL
CREATE MODEL `mydataset.my_kmeans_model`OPTIONS(MODEL_TYPE = 'kmeans',NUM_CLUSTERS = 8,KMEANS_INIT_METHOD = 'kmeans++') ASSELECT* EXCEPT(Time, Class)FROM`bigquery-public-data.ml_datasets.ulb_fraud_detection`;
With the k-means clustering model trained, you can now run ML.DETECT_ANOMALIES to detect anomalies in the training data or in new input data.
To detect anomalies in the training data, use ML.DETECT_ANOMALIES with the same data used during training:
Language: SQL
SELECT*FROMML.DETECT_ANOMALIES(MODEL `mydataset.my_kmeans_model`,STRUCT(0.02 AS contamination),TABLE `bigquery-public-data.ml_datasets.ulb_fraud_detection`);

To detect anomalies in new data, use ML.DETECT_ANOMALIES and provide new data as input:
Language: SQL
SELECT*FROMML.DETECT_ANOMALIES(MODEL `mydataset.my_kmeans_model`,STRUCT(0.02 AS contamination),(SELECT * FROM `mydataset.newdata`));

How does anomaly detection work for k-means clustering models?
Anomalies are identified based on the value of each input data point’s normalized distance to its nearest cluster, which, if exceeds a threshold determined by the contamination value, is identified as an anomaly. How does this work exactly? With a k-means model and data as inputs, ML.DETECT_ANOMALIES first computes the absolute distance for each input data point to all cluster centroids in the model, then normalizes each distance by the respective cluster radius (which is defined as the standard deviation of the absolute distances of all points in this cluster to the centroid). For each data point, ML.DETECT_ANOMALIES returns the nearest centroid_id based on normalized_distance, as seen in the screenshot above. The contamination value, specified by the user, determines the threshold of whether a data point is considered an anomaly. For example, a contamination value of 0.1 means that the top 10% of descending normalized distance from the training data will be used as the cut-off threshold. If the normalized distance for a datapoint exceeds the threshold, then it is identified as an anomaly. Setting an appropriate contamination will be highly dependent on the requirements of the user or business.
For more information on anomaly detection with k-means clustering, please see the documentation here.
Anomaly detection with an autoencoder model
You can now detect anomalies using autoencoder models, by running ML.DETECT_ANOMALIES to detect anomalies in the training data or in new input data.
Begin by creating an autoencoder model:
Language: SQL
CREATE MODEL `mydataset.my_autoencoder_model`OPTIONS(model_type='autoencoder',activation_fn='relu',batch_size=8,dropout=0.2,hidden_units=[32, 16, 4, 16, 32],learn_rate=0.001,l1_reg_activation=0.0001,max_iterations=10,optimizer='adam') ASSELECT* EXCEPT(Time, Class)FROM`bigquery-public-data.ml_datasets.ulb_fraud_detection`;
To detect anomalies in the training data, use ML.DETECT_ANOMALIES with the same data used during training:
Language: SQL
SELECT*FROMML.DETECT_ANOMALIES(MODEL `mydataset.my_autoencoder_model`,STRUCT(0.02 AS contamination),TABLE `bigquery-public-data.ml_datasets.ulb_fraud_detection`);

To detect anomalies in new data, use ML.DETECT_ANOMALIES and provide new data as input:
Language: SQL
SELECT*FROMML.DETECT_ANOMALIES(MODEL `mydataset.my_autoencoder_model`,STRUCT(0.02 AS contamination),(SELECT * FROM `mydataset.newdata`));

How does anomaly detection work for autoencoder models?
Anomalies are identified based on the value of each input data point’s reconstructed error, which, if exceeds a threshold determined by the contamination value, is identified as an anomaly. How does this work exactly? With an autoencoder model and data as inputs, ML.DETECT_ANOMALIES first computes the mean_squared_error for each data point between its original values and its reconstructed values. The contamination value, specified by the user, determines the threshold of whether a data point is considered an anomaly. For example, a contamination value of 0.1 means that the top 10% of descending error from the training data will be used as the cut-off threshold. Setting an appropriate contamination will be highly dependent on the requirements of the user or business.
For more information on anomaly detection with autoencoder models, please see the documentation here.
Anomaly detection with an ARIMA_PLUS time-series model

With ML.DETECT_ANOMALIES, you can now detect anomalies using ARIMA_PLUS time series models in the (historical) training data or in new input data. Here are some examples of when might you want to detect anomalies with time-series data:
Detecting anomalies in historical data:
- Cleaning up data for forecasting and modeling purposes, e.g. preprocessing historical time series before using them to train an ML model.
- When you have a large number of retail demand time series (thousands of products across hundreds of stores or zip codes), you may want to quickly identify which stores and product categories had anomalous sales patterns, and then perform a deeper analysis of why that was the case.
Forward looking anomaly detection:
- Detecting consumer behavior and pricing anomalies as early as possible: e.g. if traffic to a specific product page suddenly and unexpectedly spikes, it might be because of an error in the pricing process that leads to an unusually low price.
- When you have a large number of retail demand time series (thousands of products across hundreds of stores or zip codes), you would like to identify which stores and product categories had anomalous sales patterns based on your forecasts, so you can quickly respond to any unexpected spikes or dips.
How do you detect anomalies using ARIMA_PLUS? Begin by creating an ARIMA_PLUS time series model:
Language: SQL
CREATE OR REPLACE MODEL mydataset.my_arima_plus_modelOPTIONS(MODEL_TYPE='ARIMA_PLUS',TIME_SERIES_TIMESTAMP_COL='date',TIME_SERIES_DATA_COL='total_amount_sold',TIME_SERIES_ID_COL='item_name',HOLIDAY_REGION='US') ASSELECTdate,item_description AS item_name,SUM(bottles_sold) AS total_amount_soldFROM`bigquery-public-data.iowa_liquor_sales.sales`GROUP BYdate,item_nameHAVINGdate BETWEEN DATE('2016-01-04') AND DATE('2017-06-01')AND item_name IN ("Black Velvet", "Captain Morgan Spiced Rum","Hawkeye Vodka", "Five O'Clock Vodka", "Fireball Cinnamon Whiskey");
To detect anomalies in the training data, use ML.DETECT_ANOMALIES with the model obtained above:
Language: SQL
SELECT*FROMML.DETECT_ANOMALIES(MODEL `mydataset.my_arima_plus_model`,STRUCT(0.8 AS anomaly_prob_threshold));

To detect anomalies in new data, use ML.DETECT_ANOMALIES and provide new data as input:
Language: SQL
WITHnew_data AS (SELECTdate,item_description AS item_name,SUM(bottles_sold) AS total_amount_soldFROM`bigquery-public-data.iowa_liquor_sales.sales`GROUP BYdate,item_nameHAVINGdate BETWEEN DATE('2017-06-02')AND DATE('2017-10-01')AND item_name IN ('Black Velvet','Captain Morgan Spiced Rum','Hawkeye Vodka',"Five O'Clock Vodka",'Fireball Cinnamon Whiskey') )SELECT*FROMML.DETECT_ANOMALIES(MODEL `mydataset.my_arima_plus_model`,STRUCT(0.8 AS anomaly_prob_threshold),(SELECT*FROMnew_data));

For more information on anomaly detection with ARIMA_PLUS time series models, please see the documentation here.
Thanks to the BigQuery ML team, especially Abhinav Khushraj, Abhishek Kashyap, Amir Hormati, Jerry Ye, Xi Cheng, Skander Hannachi, Steve Walker, and Stephanie Wang.
More Relevant Stories for Your Company

Cloud Bigtable brings database stability and performance to Precognitive
At Precognitive, we were able to start with a blank technology slate to support our fraud detection software products. When we started building the initial version of our platform in 2017, we had some decisions to make: What coding language to use? What cloud infrastructure provider to choose? What database

How TapClicks’ Google Cloud Migration Makes Life Easy for Marketers
Editor’s note: In this blog post we learn how TapClicks migrated to Google Cloud to offer their marketing customers a unified platform for data management, operations, insights, and analysis. TapClicks is a smart marketing cloud, powered by data, that unifies our customer’s marketing. By choosing to migrate our core applications last

The Fantastic Story of How BMG Enables a Micropayments Strategy So Music Artists Get Paid
The music industry is rapidly changing. Only 20 years ago, the availability of music and the infrastructure that was required to make an album a sales success were incredibly complex and expensive. With the decline of physical sales and a fundamental shift to digital, music streaming now accounts for more

Updating Twitter’s Ad Engagement Analytics Platform for the Modern Age
As part of the daily business operations on its advertising platform, Twitter serves billions of ad engagement events, each of which potentially affects hundreds of downstream aggregate metrics. To enable its advertisers to measure user engagement and track ad campaign efficiency, Twitter offers a variety of analytics tools, APIs, and
