





The Divercity Story: Using Google Cloud to Achieve a More Inclusive and Sustainable Workforce

4749
Of your peers have already read this article.
2:30 Minutes
The most insightful time you'll spend today!
Despite a growing number of diversity, equity, and inclusion (DEI) initiatives, Black and Latinx people remain highly underrepresented in tech. Although comprising 12.6% and 18% of the U.S. labor force respectively, Black professionals hold only 5% of tech positions, while Latinx professionals fill just 6% of tech roles.
Long-standing biases in hiring practices and non-inclusive work environments are the primary contributors to this lack of diversity. Even when underrepresented professionals are successfully recruited, invisible barriers to promotion and layoffs that disproportionally impact Black and Latinx employees make it extremely challenging for tech firms to retain top talent.
We founded Divercity to help employers build diverse workforces that are more inclusive and sustainable. With our comprehensive recruiting and retention platform, tech companies can accurately measure employee diversity and gender parity, seamlessly connect with underrepresented talent, and significantly reduce turnover.
As Divercity continues to grow, we’ll introduce new services and solutions that empower the tech world to build inclusive companies while improving compliance with state and federal equal opportunity laws. We also hope to expand the reach of Divercity to support DEI initiatives in non-tech industries and bolster recruiting underrepresented professionals in other countries as well.

Scaling Divercity with the help of the Google for Startups Black Founders Fund
Shortly after founding Divercity, we participated in the 2021 Techstars Workforce Development Accelerator. The incredible support and guidance we received during and after the program highlighted the importance of long-term collaboration with reliable technology partners who actively champion diversity and inclusion.
That’s why we became part of the Google for Startups Cloud Program. After completing the program, we used Google Cloud credits and Google for Startups Black Founders Fund funding to cost-effectively trial, deploy, and scale key Google Cloud solutions. In just months, we rolled out new inclusion tracking and recruiting tools on the highly secure-by-design infrastructure of Google Cloud to expedite the sourcing and hiring of underrepresented talent in the tech industry.
With the support and mentorship of the Google for Startups Cloud Program and the Black Founders Fund, Divercity is well on its way to becoming one of the industry’s most trusted sites for DEI measurement, recruitment, and retention.
Delivering predictive diversity analyses with a 99% accuracy rate
We rely on the expansive Google Cloud ecosystem to power all the services offered on the Divercity platform. Specifically, we leverage Colab to write and execute the sophisticated TensorFlow machine learning (ML) models that deliver our predictive diversity analyses with a 99% accuracy rate.
We also use BigQuery to democratize insights and run analytics at scale with 27% lower three-year TCO than cloud data warehouse alternatives. BigQuery seamlessly integrates with Looker and Data Studio to display company diversity and recruitment data on interactive dashboards—and automatically populate reports with detailed demographic information.
We also accelerate the development, launch, and management of new Divercity tools with Firebase, while taking advantage of key features such as A/B testing and messaging campaigns to boost user engagement.
In the future, we plan to explore how Google Cloud AI and machine learning products such as Vertex AI and AutoML can further refine our diversity score analyses and applicant recruiting pipeline. We’ll also continue leveraging the many resources provided by the Google Black Founders Fund, including opportunities for technical project partnerships, early access to new Google Cloud products and tools, and collaboration with dedicated Google experts.
The Google for Startups Cloud Program and Google Black Founders Fund have been invaluable to our success. Since completing the Black Founders Accelerator program, we’ve been named a top 10 HR tech product by HR Tech Outlook, significantly increased our subscriber base, and received positive feedback from investors. We can’t wait to see what we accomplish next as we empower tech companies to build more diverse, inclusive, and sustainable workforces.

If you want to learn more about how Google Cloud can help your startup, visit our page here to get more information about our program, and sign up for our communications to get a look at our community activities, digital events, special offers, and more.
4494
Of your peers have already watched this video.
4:00 Minutes
The most insightful time you'll spend today!
How to Create, Manage and Run SQL Instances in Google Cloud SQL
Database admins and application developers can easily create a database on Google Cloud SQL, which helps manage mundane administrative tasks so that they can focus on what matters the most. From MySQL to Postgres databases, they can spin up an instance in just a few simple steps.
An instance can easily be created in just a few clicks by navigating to Cloud SQL in the GCP console, selecting the database of choice, and naming it and setting a password. Users can configure options like instance size, the number of cores, the amount of memory, and storage amount and type, from the same place. In addition, users can also isolate the database from failures by selecting the high availability option.
Once they click on create, the database instance spins up in just a few minutes. Once the instance is created, all the users would have to do is to connect to the database. Users can connect using Google App Engine, Compute Engine, or Container Engine or from anywhere else by authorizing the IP address or by using the Cloud SQL Proxy.
In just a few clicks and in a matter of minutes, users can easily spin up a database instance and manage routine administrative tasks.
How BigQuery’s Unique Features Support Your Data at Petabyte-scale

4796
Of your peers have already read this article.
3:00 Minutes
The most insightful time you'll spend today!
Organizations rely on data warehouses to aggregate data from disparate sources, process it, and make it available for data analysis in support of strategic decision-making. BigQuery is the Google Cloud enterprise data warehouse designed to help organizations to run large scale analytics with ease and quickly unlock actionable insights. You can ingest data into BigQuery either through batch uploading or by streaming data directly to unlock real-time insights. As a fully-managed data warehouse, BigQuery takes care of the infrastructure so you can focus on analyzing your data up to petabyte-scale. BigQuery supports SQL (Structured Query Language), which you’re likely already familiar with if you’ve worked with ANSI-compliant relational databases.
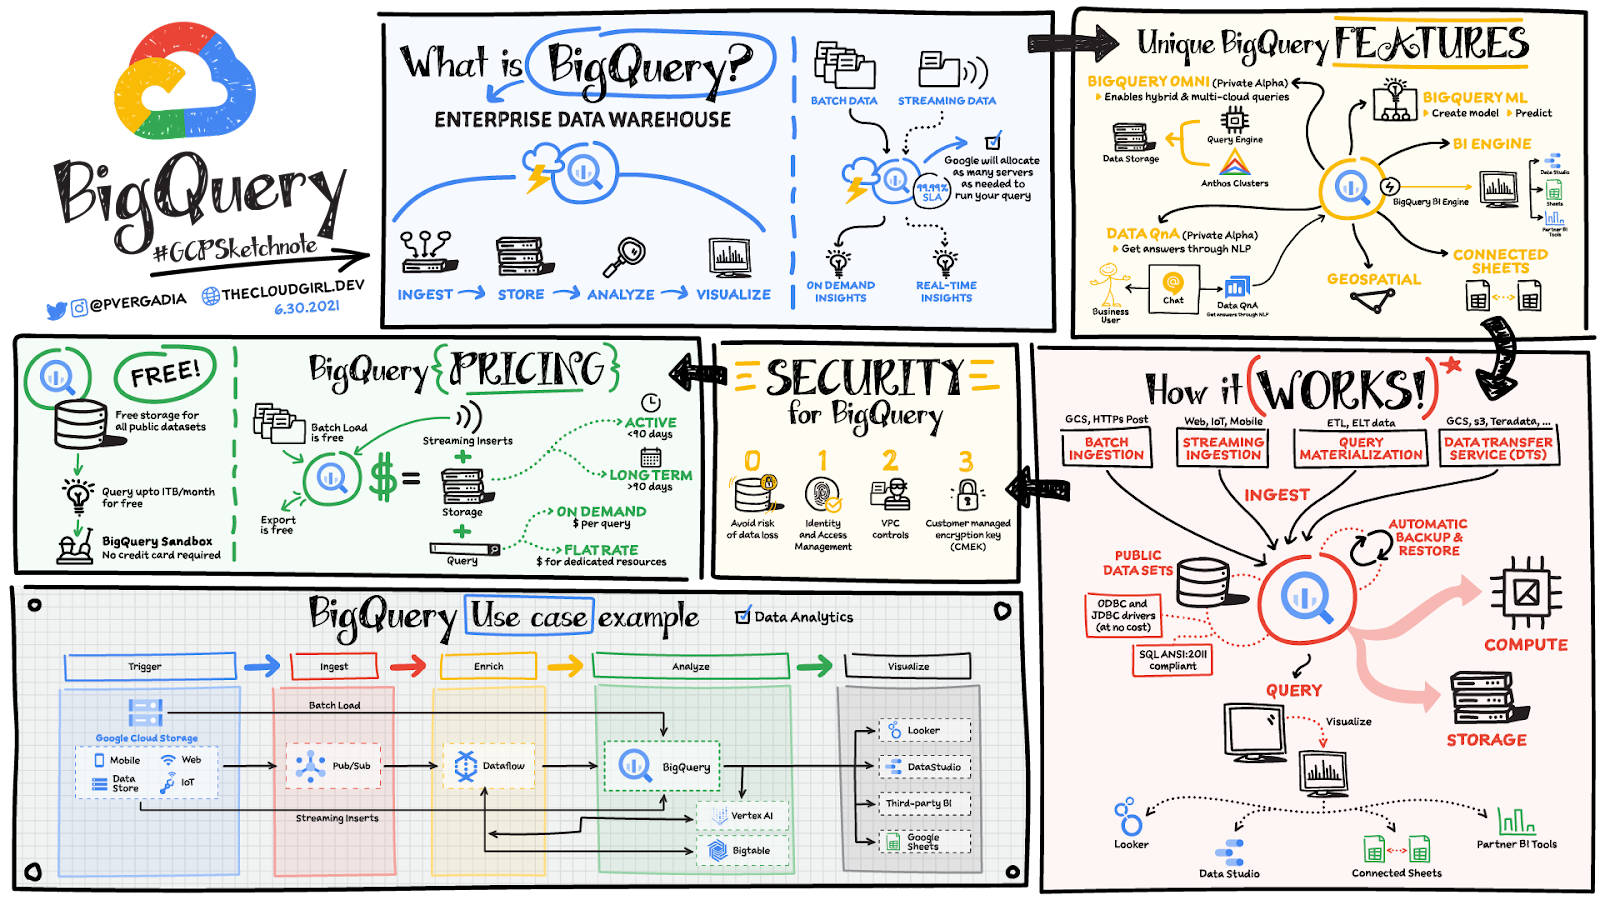
BigQuery unique features
BI Engine – BigQuery BI Engine is a fast, in-memory analysis service that provides subsecond query response times with high concurrency. BI Engine integrates with Google Data Studio and Looker for visualizing query results and enables integration with other popular business intelligence (BI) tools.
BigQuery ML: BigQuery ML is unlocking machine learning for millions of data analysts. It enables data analysts and data scientists to build and operationalize machine learning models directly within BigQuery, using simple SQL.
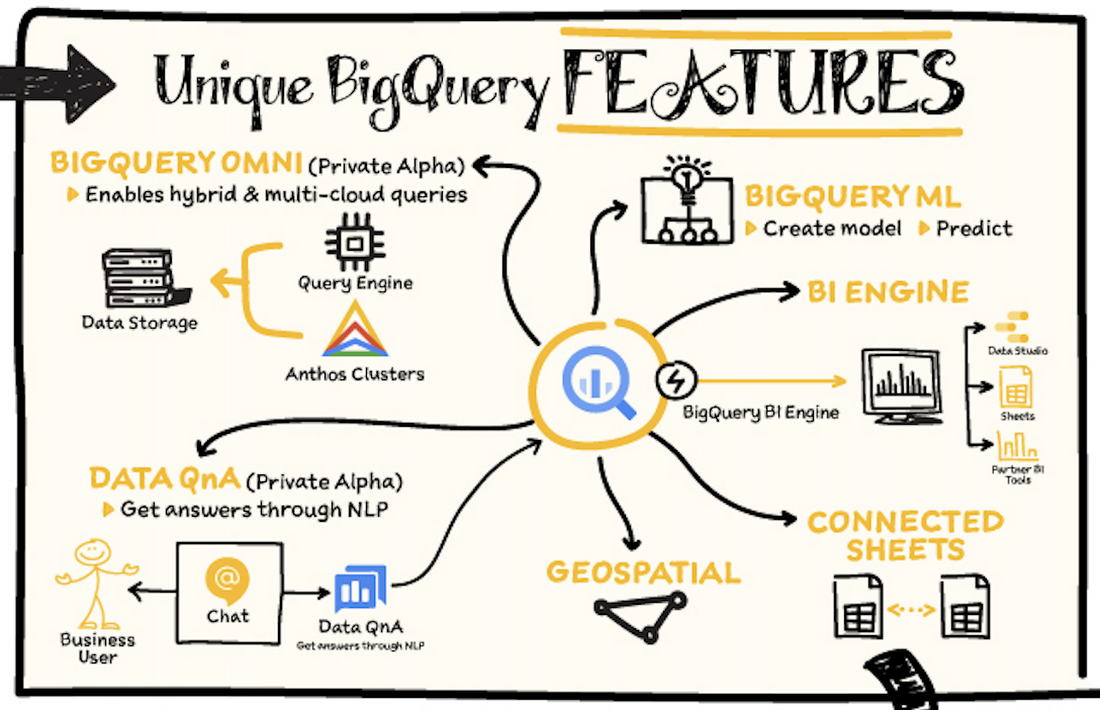
BigQuery Omni – BigQuery Omni is a flexible, multi-cloud analytics solution powered by Anthos that lets you cost-effectively access and securely analyze data across Google Cloud, Amazon Web Services (AWS), and Azure, without leaving the BigQuery user interface (UI). Using standard SQL and familiar BigQuery APIs, you can break down data silos and gain critical business insights from a single pane of glass.
Data QnA: Data QnA enables self-service analytics for business users on BigQuery data as well as federated data from Cloud Storage, Bigtable, Cloud SQL, or Google Drive. It uses Dialogflow and enables users to formulate free-form text analytical questions, with auto-suggested entities while users type a question.
Connected Sheets -The native integration between Sheets and BigQuery makes it possible for all business stakeholders, who are already quite familiar with spreadsheet tools, to get their own up-to-date insights at any time.
Geospatial data – BigQuery offers accurate and scalable geospatial analysis with geography data types. It supports core GIS functions – measurements, transforms, constructors, and more – using standard SQL.
How does it work?
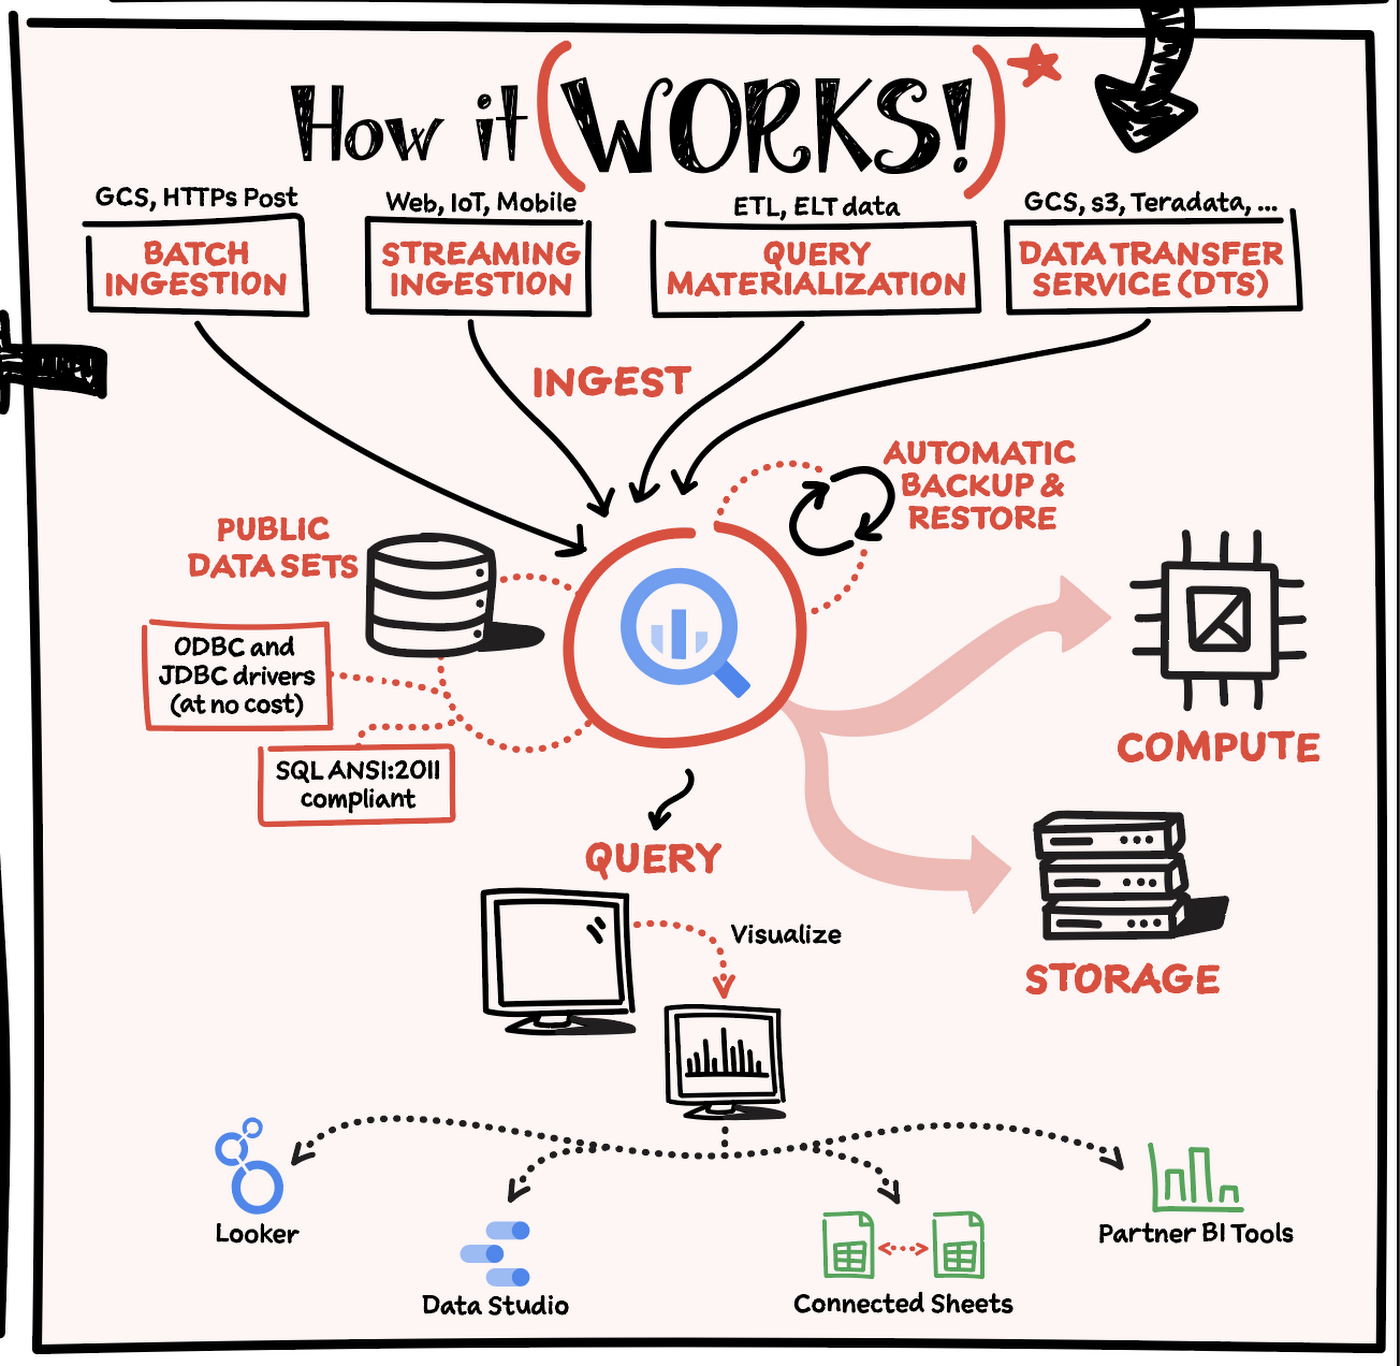
Here’s how it works: You ingest your own data into BigQuery or use data from the public datasets. Storage and compute are decoupled and can scale independently on demand. This offers immense flexibility and cost control for your business as you don’t need to keep expensive compute resources up and running all the time. As a result, BigQuery is much more cost-effective than traditional node-based cloud data warehouse solutions or on-premises systems. BigQuery also provides automatic backup and restore of your data.
You can ingest data into BigQuery in batches or stream real-time data from web, IoT, or mobile devices via Pub/Sub. You can also use Data Transfer Service to ingest data from other clouds, on-premises systems or third-party services. BigQuery also supports ODBC and JDBC drivers to connect with existing tools and infrastructure.
Interacting with BigQuery to load data, run queries, or create ML models can be done in three different ways. You can use the UI in the Cloud Console, the BigQuery command-line tool, or the API via client libraries available in several languages.
When it comes time to visualize your data, BigQuery integrates with Looker as well as several other business intelligence tools across the Google partner ecosystem.
What about security?
BigQuery offers built-in data protection at scale. It provides security and governance tools to efficiently govern data and democratize insights within your organization.
- Within BigQuery, users can assign dataset-level and project-level permissions to help govern data access. Secure data sharing ensures you can collaborate and operate your business with trust.
- Data is automatically encrypted both while in transit and at rest, ensuring that your data is protected from intrusions, theft, and attacks.
- Cloud DLP helps you discover and classify sensitive data assets.
- Cloud IAM provides access control and visibility into security policies.
- Data Catalog helps you discover and manage data.
How much does it cost?
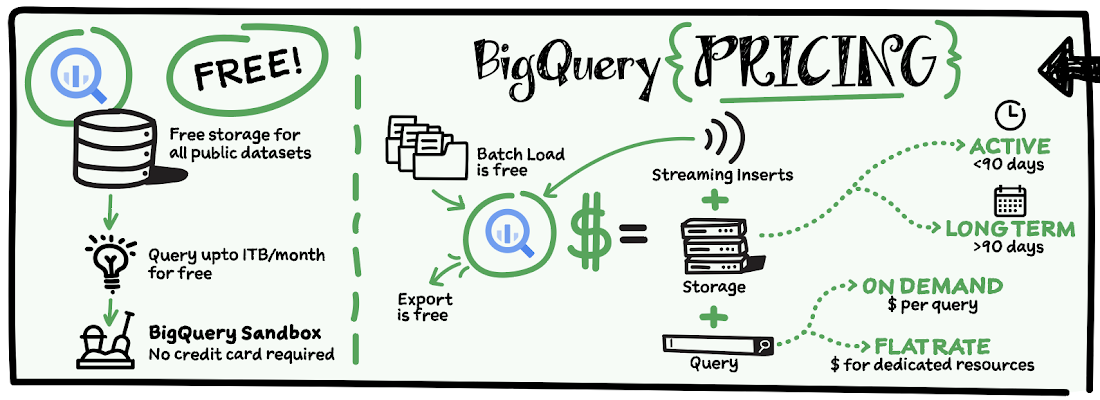
The BigQuery sandbox lets you explore BigQuery capabilities at no cost and confirm that BigQuery fits your needs. With BigQuery you get predictable price-performance: you pay for storing and querying data, and for streaming inserts. Loading and exporting data are free of charge. Storage costs are based on the amount of data stored, and have two rates based on how often the data is changing. Query costs can be either:
- On-demand – you are charged per query by the amount of data processed
- Flat-rate – if you prefer to purchase dedicated resources
You can start with the pay-as-you-go, on-demand option and later move to flat-rate if that better suits your usage. Or, start with flat-rate, get a better understanding of your usage and move to the pay-as-you-go models for additional workloads.
To explore BigQuery and its capabilities a bit more, check out the sandbox; and when you’re ready to modernize your data warehouse with BigQuery then check out the documentation to streamline your migration process here. https://www.youtube.com/embed/So-tVyBQt8E?enablejsapi=1&
For more #GCPSketchnote, follow the GitHub repo. For similar cloud content follow me on Twitter @pvergadia and keep an eye out on thecloudgirl.dev.
How Pantheon Improved Performance and Reliability by Moving to Google Cloud

5577
Of your peers have already read this article.
1:30 Minutes
The most insightful time you'll spend today!
Google Cloud Results
- Improves performance and reliability, enabling Pantheon to serve larger customers
- Supports 99.95% uptime across 200,000+ websites
- Reduces cloud infrastructure costs by 40%
- Enables future analytics offerings based on machine learning and big data analytics
Nearly every business needs a web presence—but the vast majority of companies don’t want to be involved in the technical aspects of coding, deployment, hosting, security, and scaling websites. To stay focused on the business value and creative aspects of their websites and avoid managing infrastructure, thousands of companies turn to Pantheon, a website operations and hosting platform that powers over 200,000 websites.
Pantheon promises its customers speed, reliability, and scalability plus world-class collaboration and workflow tools. For five years, the company was able to deliver high service levels in all three areas running its platform on bare-metal virtual cloud servers. However, as its business grew, network links began to saturate under heavy load, risking instability. As Pantheon’s business evolved to focus on servicing some of the largest websites in the world, the company wanted to partner with a more innovative cloud services provider.
“We wanted a partner that could give us what we offer to our own customers: the flexibility to scale smoothly and consume services without building them from scratch,” says David Strauss, CTO, Pantheon. “It was time to move beyond custom containers on managed VMs and extend our cloud strategy to include next-generation technologies for container management and analytics.”
Pantheon evaluated several leading cloud providers and determined that Google Cloud Platform would be the best fit for its business and customers. Engineering had the final say, running a battery of functionality and performance tests at the storage, database, and web server layers.
“In every test our engineers did, Google Cloud Platform came in as better, faster, and more cost effective than the competition,” says Niall Hayes, COO, Pantheon. “We compared MariaDB to Google Cloud SQL and Cassandra to Google Bigtable, and container density improved from 250 to 400 containers per server.”
Migrating 200,000+ sites in 2 weeks
Pantheon wanted to make the transition transparent to its customers, so a fast and smooth migration to Google Cloud Platform was essential. With help from Google, Pantheon completed the migration quickly and moved 500TB of databases, code, and files with zero customer impact.
“We migrated over 200,000 websites to Google Cloud Platform in 2 weeks, including 50,000 that are heavily trafficked and actively developed, and nobody noticed,” says Josh Koenig, Co-founder and Head of Products at Pantheon. “The speed was incredible. There was no downtime, and we filed no additional support tickets with Google during the entire process.”
The platform for platforms
For its content management system runtime environment, Pantheon runs its own homegrown container management technology on Google Compute Engine. To automate scaling for other core services such as its routing layer and distributed file system, it uses Google Kubernetes Engine for cluster management and orchestration.
“Google is the clear leader in Kubernetes and container management, which aligns very well with our open source values and our vision for the future,” says Niall. “With Google Kubernetes Engine we get better resource efficiency, and automated operations and autoscaling take a lot of administration off our plate.”
In addition to smooth scaling, Pantheon and its customers benefit from improved performance and reliability thanks to the high-quality private network offered by Google.
Further, the Google partnership with Fastly enables direct connectivity to Google Cloud Platform to improve performance for edge caching. As a result of these improvements, Pantheon raised its availability service level agreement (SLA) from 99.9% to 99.95% and can now take on even larger customers.
“Google’s network topology, both locally and globally, performs better and more reliably than competing solutions, making Google Cloud Platform the best choice for us and for our customers,” says David. “Google beats any other cloud provider as the best platform-for-platforms.”
Adds Josh: “Google has unbelievable technology around persistence and replication between zones and regions, and that is not something we could find anywhere else. This allows us to offer advanced disaster recovery and failover services to our customers.”
Strengthening customer relationships
Pantheon uses Google BigQuery, a fully managed, cloud-based data warehouse, to integrate with Fastly and analyze website traffic on behalf of its customers. Previously, Pantheon was unable to ingest edge data quickly enough from Fastly, limiting its ability to identify issues and provide the best customer service. Today, Fastly streams logs in real time into Google BigQuery for analysis, giving Pantheon a wealth of insights.
“We use Google BigQuery to identify customers that have outgrown their infrastructure or need to right-size for business growth,” says David. “We can have proactive conversations and add a lot of value to the relationships. Soon, we plan to make Google BigQuery available to our customers so they can better understand their own traffic.”
Adds Niall: “Google Cloud Platform is more data-oriented than other cloud providers, making it a better match for our needs and our customers’ strategic initiatives.”
Integrated, granular security
Pantheon appreciates that Google Cloud services are built for public cloud, with granular security as a core design and development requirement. Employees simply use their G Suite credentials to gain access to Google Cloud Platform infrastructure and services.
“We’ve been a G Suite shop for years because of the paperless collaboration benefits,” says Josh. “G Suite connects our distributed company, and it was very natural to use those same logins for Google Cloud Platform.”
Staying competitive and productive
Moving to Google Cloud Platform opens up new possibilities for services Pantheon can offer to customers in the future, including machine learning and big data analytics, to give them a more complete view of how digital experiences are driving their businesses. Internally, engineers can move faster, do more effective capacity planning, and provide better service as Pantheon moves its products upmarket.
Pantheon expected to save 20% on cloud infrastructure costs by moving to Google Cloud Platform, but was able to double that savings with resource optimization and managed services.
“Since moving to Google Cloud Platform, our platform is more secure, reliable, and scalable than ever. We reduced our cloud infrastructure costs by 40%, and our customers’ sites run 45% faster than industry benchmarks,” says Niall. “Our engineers are Google fans for a reason—they’re happier, more efficient, and more productive on Google Cloud Platform.”
4953
Of your peers have already watched this video.
49:30 Minutes
The most insightful time you'll spend today!
How to Migrate an Oracle Database to Google Cloud
As more enterprises migrate a growing number of workloads to the cloud, migrating databases, too, has become a key focus.
But migrating databases is also really tough. This is due to a number of different reasons.
The first one is that there’s a lot of proprietary technology and functionality that’s built into a lot of the legacy database technologies.
With Oracle, for example, that may be things like stored procedure, custom functions, Oracle RAC, so on and so forth.
This makes it really hard for database administrators to migrate to an equivalent cloud-native technology.
The second challenge is that historical on-prem databases are all quite monolithic.
These are humongous servers which don’t really fit into the cloud way of doing things.
So often, database administrators have to split these up into multiple servers in the cloud.
The third challenge, which a lot of companies underestimate, is the reliance of applications on databases.
Say, you are a company that’s been around for 10 to 15 years. As the business has grown, it’s added tens to hundreds of apps, both internal- and external-facing, that are all relying on the database.
So as you’re thinking about migration, it’s really important to consider the risks that are associated of migrating to different cloud technologies. Obviously, you would like to minimize your company’s exposure.
With that background, here are the steps, procedures, best practices, and how to solve the challenges associated with migrating on-premises Oracle databases to Google Cloud SQL PostgreSQL.
From source database migration assessment to schema conversion, data replication, and performance tuning, we will cover all of the basics required to get you started with your first Oracle to Cloud SQL migration project.
Make Meaningful Analysis with Geo Boundary Public Datasets on BigQuery

6345
Of your peers have already read this article.
4:00 Minutes
The most insightful time you'll spend today!
Geospatial data is a critical component for a comprehensive analytics strategy. Whether you are trying to visualize data using geospatial parameters or do deeper analysis or modeling on customer distribution or proximity, most organizations have some type of geospatial data they would like to use – whether it be customer zipcodes, store locations, or shipping addresses. However, converting geographic data into the correct format for analysis and aggregation at different levels can be difficult. In this post, we’ll walk through some examples of how you can leverage the Google Cloud platform alongside Google Cloud Public Datasets to perform robust analytics on geographic data. The full queries can be accessed from this notebook here.
Public US Geo Boundaries dataset
BigQuery hosts a slew of public datasets for you to access and integrate into your analytics. Google pays for the storage of these datasets and provides public access to the data via the bigquery-public-data project. You only pay for queries against the data. Plus, the first 1 TB per month is free! These public datasets are valuable on their own, but when joined against your own data they can unlock new analytics use cases and save the team a lot of time.
Within the Google Cloud Public Datasets Program there are several geographic datasets. Here, we’ll work with the geo_us_boundaries dataset, which contains a set of tables that have the boundaries of different geospatial areas as polygons and coordinates based on the center point (GEOGRAPHY column type in BigQuery), published by the US Census Bureau.

Mapping geospatial points to hierarchical areas
Many times you will find yourself in situations where you have a string representing an address. However, most tools require lat/long coordinates to actually plot points. Using the Google Maps Geocoding API we can convert an address into a lat/long and then store the results in the BigQuery table.
With a lat/long representation of our point, we can join our initial dataset back onto any of the tables here using the ST_WITHIN function. This allows us to check and see if a point is within the specified polygon.
ST_WITHIN(geography_1, geography_2)
This can be helpful for ensuring standard nomenclature; for example, metropolitan areas that might be named differently. The query below maps each customers’ address to a given metropolitan area name.
SELECTcust.id as customer_id,metro.name as metro_nameFROM `looker-private-demo.retail.customers` as cust,`bigquery-public-data.geo_us_boundaries.metropolitan_divisions` as metroWHERE ST_WITHIN(ST_GEOGPOINT(cust.longitude, cust.latitude),metro.metdiv_geom)
It can also be useful for converting to designated market area (DMA), which is often used in creating targeted digital marketing campaigns.
SELECTcust.id as customer_id,dma.dma_nameFROM `looker-private-demo.retail.customers` as cust,`bigquery-public-data.geo_us_boundaries.designated_market_area` as dmaWHERE ST_WITHIN(ST_GEOGPOINT(cust.longitude, cust.latitude),dma.dma_geom)
Or for filling in missing information; for example, some addresses may be missing zip code which results in incorrect calculations when aggregating up to the zipcode level. By joining onto the zip_codes table we can ensure all coordinates are mapped appropriately and aggregate up from there.
SELECTzip.zip_code,count(distinct cust.id) as unique_customersFROM `looker-private-demo.retail.customers` as cust,`bigquery-public-data.geo_us_boundaries.zip_codes` as zipWHERE ST_WITHIN(ST_GEOGPOINT(cust.longitude, cust.latitude),zip.zip_code_geom)GROUP BY 1
Note that the zip code table isn’t a comprehensive list of all US zip codes, they are zip code tabulation areas (ZCTAs). Details about the differences can be found here. Additionally, the zip code table gives us hierarchical information, which allows us to perform more meaningful analytics. One example is leveraging hierarchical drilling in Looker. I can aggregate my total sales up to the country level, and then drill down to state, city and zipcode to identify where sales are highest. You can also use the BigQuery GeoViz tool to visualize geospatial data!

Aside from simply checking if a point is within an area, we can also use ST_DISTANCE to do something like find the closest city using the centerpoint for the metropolitan area table.
SELECTcust.id as customer_id,ARRAY_AGG(metro.name order by ST_DISTANCE(ST_GEOGPOINT(cust.longitude, cust.latitude),metro.internal_point_geom) asc limit 1)[offset(0)] as metro_nameFROM`looker-private-demo.retail.customers` as cust,`bigquery-public-data.geo_us_boundaries.metropolitan_divisions` as metroGROUP BY cust.id
This concept doesn’t just hold true for points, we can also leverage other GIS functions to see if a geospatial area is contained within areas that are listed in the boundaries datasets. If your data comes into BigQuery as a GeoJSON string, we can convert it to a GEOGRAPHY type using the ST_GEOGFROMGEOJSON function. Once our data is in a GEOGRAPHY type we can do things like check to see what urban area the geo is within – using either ST_WITHIN or ST_INTERSECTS to account for partial coverage. Here, I am using the customer’s zip code to find all metropolitan divisions where the zip code polygon and the metropolitan polygon intersect. I am then selecting the metropolitan area that has the most overlap (or the intersection has the largest area) to be the customer’s metro that we use for reporting.
SELECTcust.id as customer_id,ARRAY_AGG(metro.name order by ST_AREA(ST_INTERSECTION(zip.zip_code_geom,metro.metdiv_geom)) desc limit 1)[offset(0)] as metro_nameFROM`looker-private-demo.retail.customers` as custJOIN `bigquery-public-data.geo_us_boundaries.zip_codes` as zip on cust.zip=zip.zip_code,`bigquery-public-data.geo_us_boundaries.metropolitan_divisions` as metroWHERE ST_INTERSECTS(zip.zip_code_geom,metro.metdiv_geom)GROUP BY cust.id
The same ideas can be applied to the other tables in the dataset including the county, urban areas and National Weather Service forecast regions (which can also be useful if you want to join your datasets onto weather data).
Correcting for data discrepancy
One problem that we may run into when working with geospatial data is that different data sources may have different representations of the same information. For example, you might have one system that records state as a two letter abbreviation and another using the full name. Here, we can use the state table to join the different datasets.
SELECTst.state_name,sum(ab.sales+fn.sales) as total_salesFROM `bigquery-public-data.geo_us_boundaries.states` as stLEFT JOIN abbreviated_table as ab on ab.state = st.stateLEFT JOIN fullname_table as fn on fn.state = st.state_nameWHERE COALESCE(ab.state, fn.state) IS NOT NULLGROUP BY 1
Another example might be using the tables as a source of truth for fuzzy matching. If the address is a manually entered field somewhere in your application, there is a good chance that things will be misspelled. Different representations of the same name may prevent tables from joining with each other or lead to duplicate entries when performing aggregations. Here, I use a simple Soundex algorithm to generate a code for each county name, using helper functions from this blog post. We can see that even though some are misspelled they have the same Soundex code.

Next, we can join back onto our counties table so we make sure to use the correct spelling of the county name. Then, we can simply aggregate our data for more accurate reporting.
SELECTc.county_name,sum(sales) as total_salesFROMtableJOIN `bigquery-public-data.geo_us_boundaries.counties` as con testing.dq_fm_Soundex(table.county) = testing.dq_fm_Soundex(c.county_name)WHERE c.state_fips_code = cast(36 as string)GROUP BY 1
Note that fuzzy matching definitely isn’t perfect and you might need to try different methods or apply certain filters for it to work best depending on the specifics of your data.
The US Geo Boundary datasets allow you to perform meaningful geographic analysis without needing to worry about extracting, transforming or loading additional datasets into BigQuery. These datasets, along with all the other Google Cloud Public Datasets, will be available in the Analytics Hub. Please sign up for the Analytics Hub preview, which is scheduled to be available in the third quarter of 2021, by going to g.co/cloud/analytics-hub.
More Relevant Stories for Your Company

Groupe Dauphinoise Grows it Customer Base with G Suite and Google Cloud Platform
As a leading French agricultural cooperative, Groupe Dauphinoise places collaboration at the heart of its philosophy. Working with farmers in the Rhone-Alpes region, Groupe Dauphinoise takes on a diverse range of activities from agricultural production to research and development to running retail outlets. As its operations expanded and strained its

Discover Effingo: Google’s Solution to Moving Data at Massive Scale
Every hour of every day, Google moves a lot of data around the world. But how? With the Effingo (Latin for ‘to duplicate’ or ‘copy’) data copying service, a Google-only service that moves data internally and on Google Cloud customers’ behalf. As a Google Cloud customer perhaps you move data

Dataplex: Google Cloud’s Intelligent Data Fabric to Manage Data and Analytics at Scale
Enterprises are struggling to make high quality data easily discoverable and accessible for analytics, across multiple silos, to a growing number of people and tools within their organization. They are often forced to make tradeoffs—to move and duplicate data across silos to enable diverse analytics use cases or leave their

Discover Latest Resources on Google Cloud’s Datasets Solution
Editor’s note: With Google Cloud’s datasets solution, you can access an ever-expanding resource of the newest datasets to support and empower your analyses and ML models, as well as frequently updated best practices on how to get the most out of any of our datasets. We will be regularly updating this
