





Dataflow Guarantees 50+% Increase in Developer Productivity and Infrastructure Cost Savings: Read More

8381
Of your peers have already read this article.
3:00 Minutes
The most insightful time you'll spend today!
In our conversations with technology leaders about data-driven transformation using Google Data Cloud – industry’s leading unified data and AI solution – , one important topic is incorporating continuous intelligence to move from answering questions such as “What has happened? to questions like “What is happening?” and “What might happen?”. The core to this evolution is the need for an underlying data processing that not only provides powerful real-time capabilities for events happening close to origination, but also brings together existing data sources under one unified data platform to enable organizations to draw insights and take actions holistically. Dataflow, Google’s cloud-native data processing and streaming analytics platform, is a key component of any modern data and AI architecture and data transformation journey, along with BigQuery, Google’s internet-scale warehouse with built-in streaming, BI engine and ML; Pub/Sub, a global no-ops event delivery service; and Looker, a modern BI and embedded analytics platform. One of the key evaluation factors is potential economic value of Dataflow to their organization, particularly in the context of engaging other stakeholders is key for many of the leaders that we engage with. So we commissioned Forrester Consulting to conduct a comprehensive study on the impact that Dataflow had on their organization by interviewing actual customers .
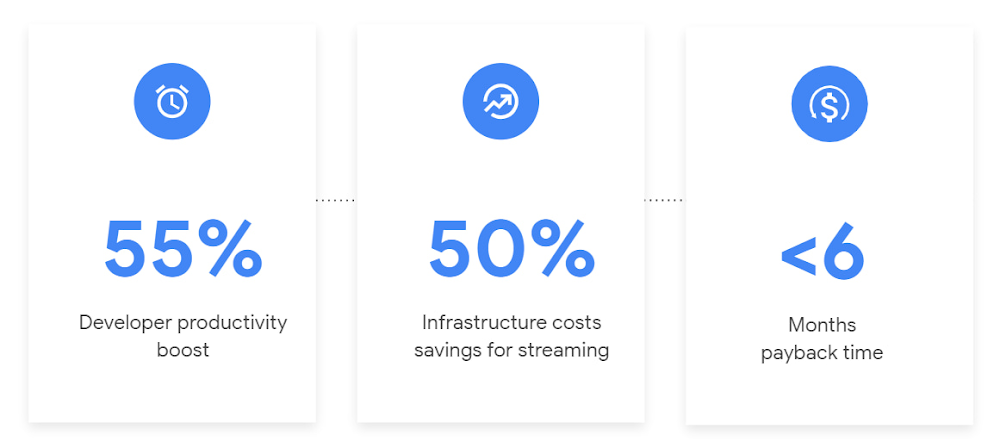
Today we’re excited to share our commissioned study conducted by Forrester Consulting, the Total Economic Impact™ of Google Cloud Dataflow, which allows data leaders to understand and quantify the benefits of Dataflow, and use cases it enables. Forrester conducted interviews with Dataflow customers to evaluate the benefits, costs, and risks of investing in Dataflow across an organization. Based on their interviews, Forrester identified major financial benefits across four different areas: business growth, infrastructure cost savings, data engineer productivity, and administration efficiency. In fact, Forrester found that customers adopting Dataflow can achieve a 55% boost in developer productivity and a 50% reduction in infrastructure costs. In fact, Forrester projects that customers adopting Dataflow can achieve a range of up to 171% Return on Investment (ROI) and a less than six months payback period. Customers can now use figures in the report to compute their own Return on Investment (ROI) and payback period.
“Dataflow is integral to accelerating time-to-market, decreasing time-to-production, reducing time to figure out how to use data for use cases, focusing time on value-add tasks, streamlining ingestion, and reducing total cost of ownership.” – Lead technical architect, CPG
Let’s take a deeper look at the ways that Forrester found that Dataflow can help you achieve your goals and unlock your business potential.
Benefit #1: Increase data engineer productivity by 55%
Developers can choose among a variety of programming languages to define and execute data workflows. Dataflow also seamlessly integrates with other Google Cloud Platform and open source technologies to maximize value and applicability to a wide variety of use cases. Dataflow streamlined workflows with code reusability,dynamic templates, and the simplicity of a managed service. Engineers trusted pipelines to run correctly and adhere to governance. Data engineers avoided laborious issue-monitoring and remediation tasks that were common in the legacy environments such as poor performance, lack of availability, and failed jobs. Teams valued the language flexibility and open source base.
“Dataflow provided us with ETL replacement that opened limitless potential use cases and enabled us to do smarter data enhancement while data remains in motion.” — Director of data projects, financial services
Benefit #2: Reduce infrastructure costs by up-to 50% for batch and streaming workloads
Dataflow’s serverless autoscaling and discrete control of job needs, scheduling, and regions eliminated overhead and optimized technology spending. Consolidating global data processing solutions to Dataflow further eliminated excess costs while ensuring performance, resilience, and governance across environments. Dataflow’s unified streaming and batch data platform gives organizations the flexibility to define either workload in the same programming model, run it on the same infrastructure, and manage it from a single operational management tool.
“Our costs with our cloud data platform using Dataflow are just a fraction of the costs we faced before. Now we only pay for cloud infrastructure consumption because the open source base helps us avoid licensing costs. We spend about $120,000 per year with Dataflow, but we’d be spending millions with our old technologies.” – Lead technical architect, CPG
Benefit #3: Increase top-line revenue by improving customer experience and retention with payback time of < 6 months
Streaming analytics is an essential capability in today’s digital world to gain real-time actionable insights. Likewise, organizations must also have flexible, high- performance batch environments to analyze historical data for building machine learning models, business intelligence, and advanced analytics. Dataflow enabled real-time streaming use cases, improved data enrichment, encouraged data exploration,improved performance and resiliency, reduced errors, increased trust, and eliminated barriers to scale. As a result, organizations provided customers with more accurate, relevant, and in-the-moment data-backed services and insights — boosting customer experience, creating new revenue streams, and improving acquisition, retention, and enrichment.
“It’s already been proven that we are getting more business [with Dataflow] because we can turn around results faster for customers.” – VP of technology, financial services technology
“When we provide data to our customers and partners with Dataflow, we are much more confident in those numbers and can provide accurate data within a minute. Our customers and partners have taken note and commented on this. It’s reduced complaints and prevented churn.” – Senior software engineer, media
Other benefits
Eliminated administrative overhead and toil
As a cloud-native managed service, all administration tasks such as provisioning, scaling, and updates are automatically handled by Google Cloud. Teams no longer need to manage servers and related software for legacy data processing solutions. Admins also streamlined processes for setting up data sources, adding pipelines, and enforcing governance.
Saved business operations costs for support teams and data end users
Dataflow improved the speed, quality, reliability, and ease of access to data for insights for general business users, saving time and empowering users to drive better data-backed outcomes. It also reduced support inquiry volume while automating manual job creation.
What’s next?
Download the Forrester Total Economic Impact study today to dive deep into the economic impact Dataflow can deliver your organization. We would love to partner with you to explore the potential Dataflow can unlock in your teams. Please reach out to our sales team to start a conversation about your data transformation with Google Cloud.
Query Insights for Spanner: A blessing for developers and DBAs

3294
Of your peers have already read this article.
1:30 Minutes
The most insightful time you'll spend today!
Today, application development teams are more agile and are shipping features faster than ever before. In addition to these rapid development cycles and the rise of microservices architectures, the end-to-end ownership of feature development (and performance monitoring) has moved to a shared responsibility model between advanced database administrators and full-stack developers. However, most developers don’t have the years of experience or the time needed to debug complex query performance issues and database administrators are now a scarce resource in most organizations. As a result, there is a dire need for tools for developers and DBAs alike to quickly diagnose performance issues.
Introducing Query Insights for Spanner
We are delighted to announce the launch of Query Insights for Spanner, a set of visualization tools that provide an easy way for developers and database administrators to quickly diagnose query performance issues on Spanner. Using Query Insights, users can now troubleshoot query performance in a self-serve way. We’ve designed Query Insights using familiar design patterns with world-class visualizations to provide an intuitive experience for anyone who is debugging issues with query performance on Spanner. Query Insights is available at no additional cost.
By using out-of-the-box visual dashboards and graphs, developers can visualize aberrant behavior like peaks and troughs in various performance metrics over a time-series and quickly identify problematic queries. Time series data provides significant value to organizations because it enables them to analyze important real-time and historical metrics. Data is valuable only if it’s easy to comprehend;. that’s where being able to view intuitive dashboards becomes a force multiplier for organizations looking to expose their time series data across teams.
Follow a visual journey with pre-built dashboards
With Query Insights, developers can seamlessly move from detection of database performance issues to diagnosis of problematic queries using a single interface. Query Insights will help identify query performance issues easily with pre-built dashboards.
The user could do this by following a simple journey where they can quickly confirm, identify and analyze query performance issues. Let’s walk through an example scenario.
Understand database performance
This journey will start by the user setting up an alert on Google Cloud Monitoring for CPU utilization going above a certain threshold. The alert could be configured in a way that if this threshold is crossed, the user will be notified with an email alert, with a link to the “Monitoring” dashboard.
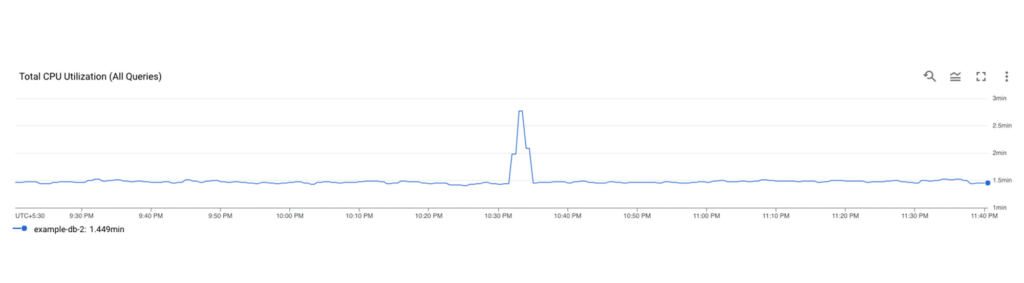
Once the user receives this alert, they would click on the link in the email, and navigate to the “Monitoring” dashboard. If they observe high CPU Utilization and high read latencies, the possible root cause could be expensive queries. A spike in CPU Utilization could be a strong signal that the system is using more compute than it usually would, due to an inefficient query.
The next step is to identify which query might be the problem, this is where Query Insights comes in. The user can get to this tool by clicking on Query Insights in the left navigation of your Spanner Instance. Here, they can drill down into the CPU usage by query and observe that for a specific database, CPU Utilization (attributed to all queries) is spiking for a particular time window. This confirms that the CPU utilization is due to inefficient queries.
Identifying a problematic query
The user now observes the TopN (Top queries by CPU Utilization) query graph to see the TopN queries by CPU Utilization. From the graph, it is very easy to visualize and identify the top queries which could be causing the spike in CPU Utilization.
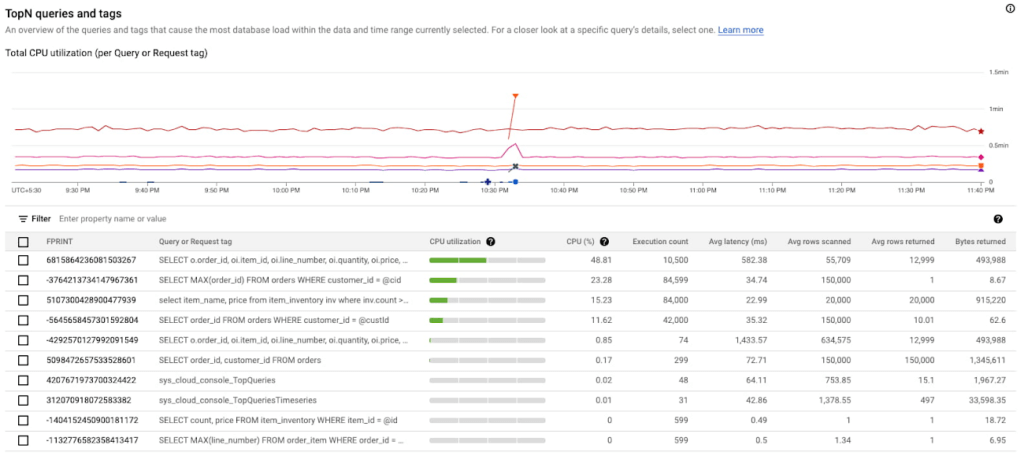
In the above screenshot, we can see that the first query in the table is showing a clear spike at 10:33 PM consuming 48.81% of total CPU. This is a clear indication that this query could be problematic, and the user should investigate further.
Analyzing the query performance
Once they have identified the problematic query, they can now drill down into this query shape to confirm, identify the root cause of the high CPU utilization.
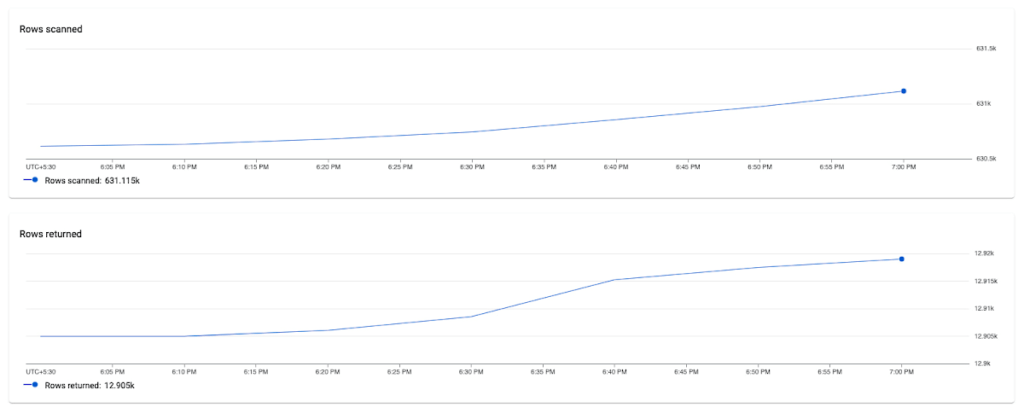
They can do this by clicking on the Fingerprint ID for the specific query from the topN table, and navigating to the Query Details page where they will be able to see a list of metrics (Latency, CPU Utilization, Execution count, Rows Scanned / Rows Returned) over a time series for that specific query.
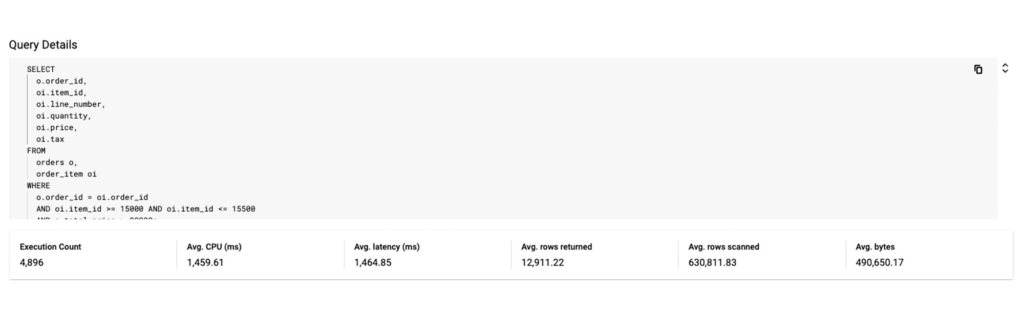
In this example, we notice that the average number of rows scanned for this specific query are very high (~ 600k rows scanned to return ~ 12k rows), which could point to a poor query design, resulting in an inefficient query. We can also observe that latency is high (1.4s) for this query.
Fixing the issue
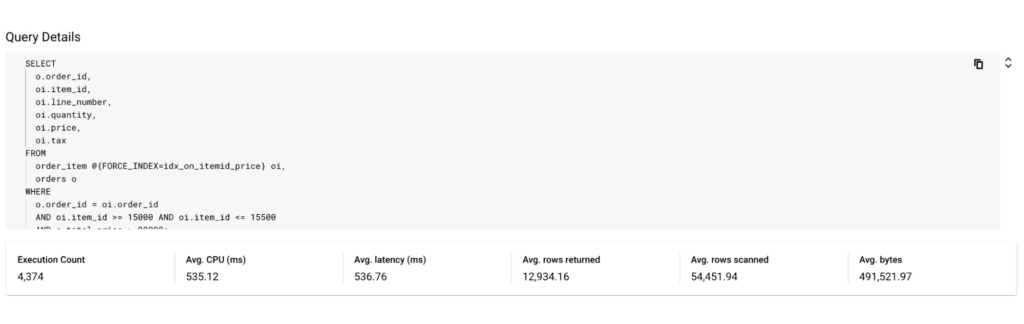
To fix the problem in this scenario, the user could optimize this query by specifying a secondary index in the query using a FORCE_INDEX query hint to provide an index directive. This would provide more consistent performance, make the query more efficient, and lower CPU utilization for this query.
In the screenshot below, you can see that after specifying the index in the query, the query performance dramatically increases in terms of CPU, rows scanned (54K vs 630k) and also in terms of query latency (536 ns vs 1.4 s).
Unoptimized Query:
Optimized Query:
By following this simple visual journey, the user can easily detect, diagnose and debug inefficient queries on Spanner.
Get started with Query Insights today
To learn more about Query Insights, review the documentation here. Query Insights is enabled by default. In the Spanner console, you can click on Query Insights in the left navigation and start visualizing your query performance metrics!
New to Spanner? Get started in minutes with a new database.
Start-up Paves Way for More Inclusive Clinical Research: Honoring Black Founders of Acclinate with Google Cloud

8416
Of your peers have already read this article.
4:00 Minutes
The most insightful time you'll spend today!
Editor’s note: February is Black History Month—a time for us to come together to celebrate the diverse set of experiences, perspectives and identities that make up the Black experience. Over the next few weeks, we will highlight Black-led startups and how they use Google Cloud to grow their businesses. Today’s feature highlights Acclinate and its founders, Del and Tiffany.
As patients, as caregivers, and as parents taking our own children to the doctor, we want recommended medications to be safe and effective. It’s a right everyone deserves.
It’s known that certain medications don’t work in the same way in all populations. For example, Albuterol, a medication often prescribed for asthma, is less effective in 67% of all Puerto Ricans and 47% of Black Americans. These problems—which can have deadly consequences—result from historically limited diversity in pharmaceutical clinical trials.
We founded our startup Acclinate to integrate culture and technology to achieve more inclusive clinical research. Help pharmaceutical companies and healthcare organizations access and engage communities of color so research is more inclusive.
Bridging the health equity gap by building trust
It’s important that health research organizations access and engage communities of color so their efforts reflect all the people they serve. Take a disease like diabetes, which affects a significantly higher proportion of Black Americans. When you look at even recent clinical trials for diabetic drugs, the representation of Black Americans among participants is only in the low single digits, despite comprising 13 percent of the U.S. population and more than 40 percent of diabetes patients in this country. Industry leaders have been aware of the lack of diversity issue, but some have chosen to ignore it or brush it aside. The biggest problem, in our opinion, is that there have been no penalties for not achieving higher diversity figures in clinical trials, and only minor financial repercussions to pharma/biotech companies when their treatments either do not work across all groups once approved, or there is a lack of uptake by all groups due to the lack of testing in those groups. The lack of clinical trial diversity has adversely impacted the reputation of the industry and the ability to recruit diverse populations in the future.
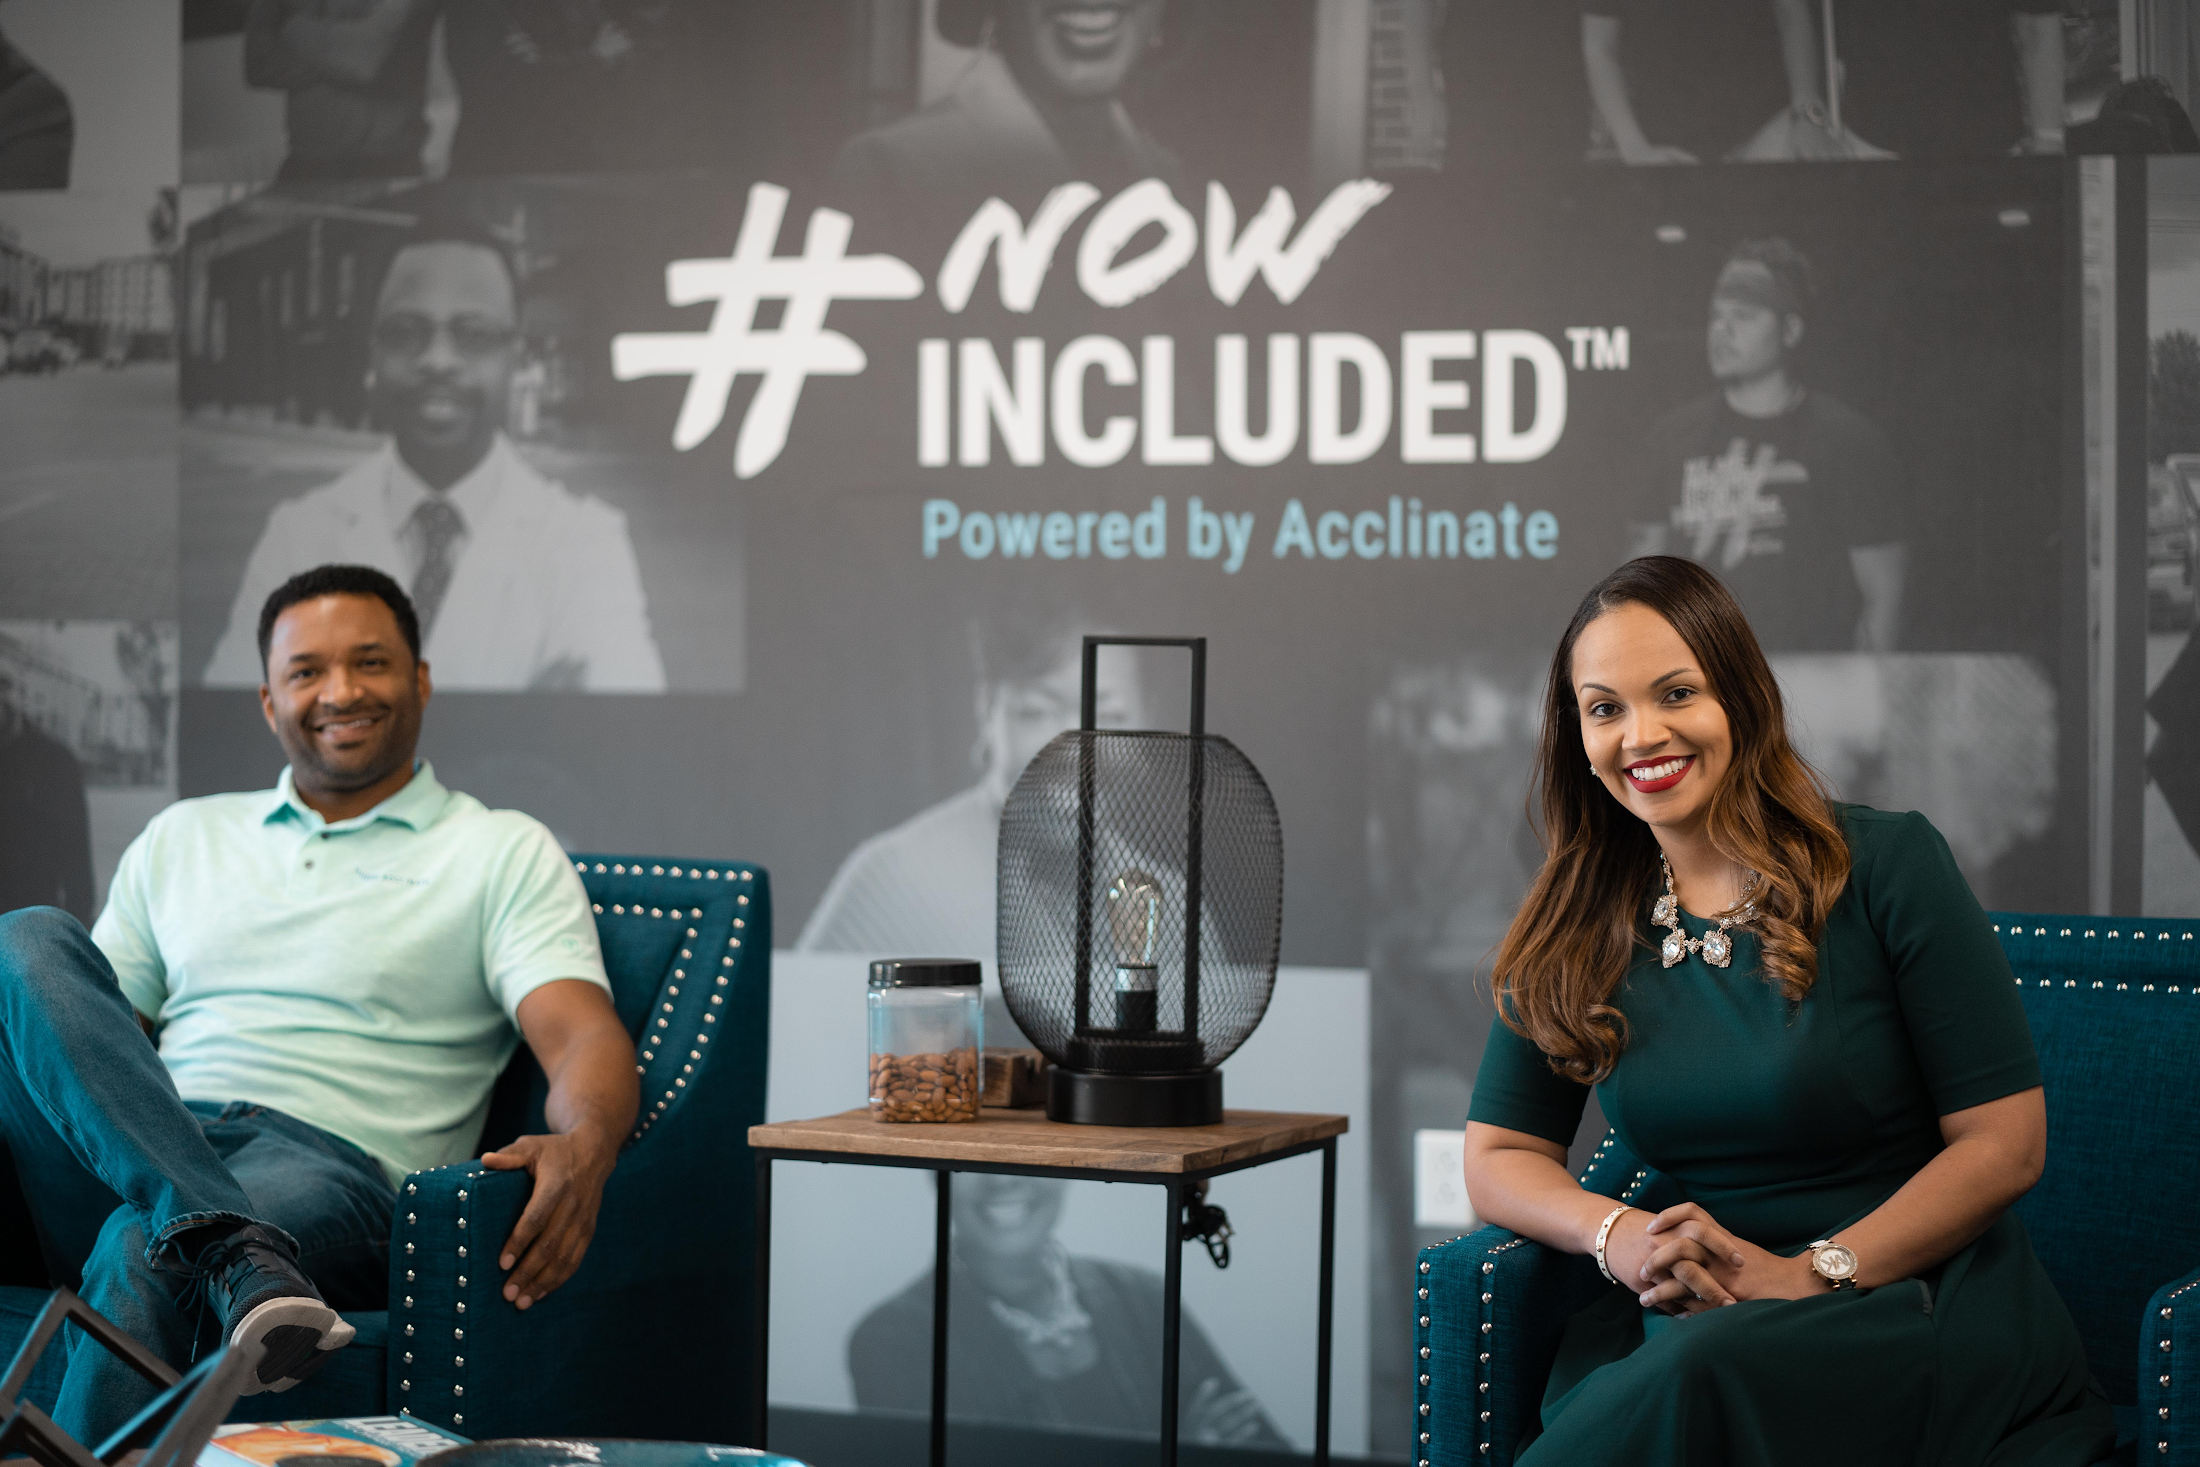
Acclinate integrates culture and technology to promote diverse patient representation in medical research. Our approach is not transactional. We build trust through our #NOWINCLUDED community, which is an ongoing, ever-expanding digital platform that educates and engages with communities of color on health issues.
#NOWINCLUDED includes a website app, and social media presence where members can learn information about diseases, particularly those with greater negative impacts on people of color, such as cancer, diabetes, and cardiovascular diseases. Members can share stories and ask questions. By providing access to trusted resources about these health issues and the latest clinical research, we empower Black people to take control of their health and consider participating in research that is shaping the future of healthcare.
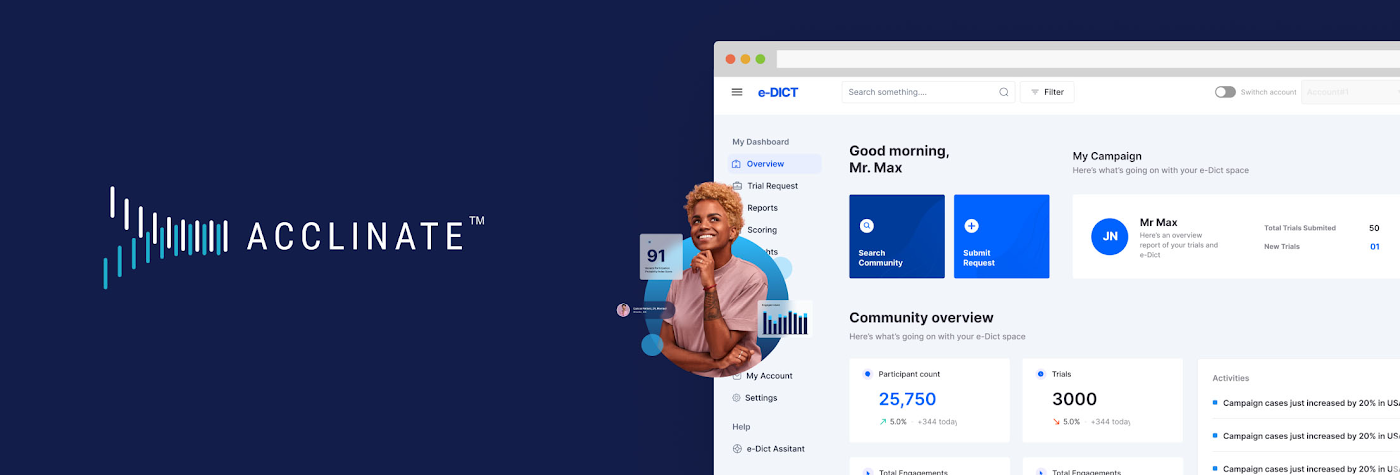
For healthcare-related organizations, we offer the opportunity to better understand the attitudes, aspirations, and unmet needs of underrepresented minority communities. Data from #NOWINCLUDED feeds our HIPAA-compliant SaaS platform, e-DICT™ (Enhanced Diversity in Clinical Trials), which uses predictive analytics and machine learning to identify individuals matching the requirements and most likely to be receptive to participation in a particular clinical trial.
Acclinate scales its platform with Google Cloud
We rely on Google Cloud services, including Vertex AI, to know whom to ask, when to ask, and how to ask for clinical trial participation. With Vertex AI, we enjoy a unified platform for developing our artificial intelligence models, including tools for preparing and storing our datasets. We can easily train and compare models using AutoML, which requires minimal ML expertise or effort with its intuitive graphical interface. This allows us to leverage more than ten ordinal and categorical data points to determine in real time a community member’s likelihood to enroll, which we call our Participation Probability Index (PPI). Our models evolve in an iterative process the more we interact with, and learn about, our community members.
We follow the pay-per-use Google Cloud Platform architecture model using serverless technology, which helps reduce infrastructure management costs and lets us focus on product development and engaging with communities across the U.S.
CloudSQL, a fully managed relational database service, integrates easily with BigQuery so we can glean insights for our clients in real time, all with Google Cloud’s robust security, governance, and reliability controls. Virtual Private Cloud (VPC) gives us scalable and flexible networking for our cloud-based resources and services. We also use Identity and Access Management (IAM) to simplify oversight of Google Cloud resource permissions for different user groups and roles, with appropriate security protections.
API Gateway manages our APIs using Cloud Functions, which both use consumption-based pricing, plus give our developers consistent and highly secure access to our services through a well-defined REST API. We use Memorystore for Redis to reduce platform latency. This is done with a fully managed service powered by the Redis in-memory data store, which builds application caches for fast data access. All of this comes together to provide an outstanding experience for our platform’s users and contributors.
- DSC00049.JPG
- DSC00010 (2).JPG
- pitch del tiff.jpg
Expanding influence with the Google for Startups Accelerator for Black Founders
Three months of one-on-one Google support and mentorship as part of the most recent Google for Startups Accelerator : Black Founders cohort not only helped us build our product, but also helped us earn external credibility. People use Google every day, so whether we’re trying to engage in conversations with industry experts or with somebody in a rural community, it is helpful to have the buy-in of a globally-recognized brand as we take on a historically difficult, systemic issue with challenges around trust. Getting access to the products, best practices, and people we need to build and grow through the Accelerator program has been priceless. For example, working with the Google AdWords team helped us generate important traffic from people interested in learning more about #NOWINCLUDED or sharing their story with us. Jason Scott, who leads the Google for Startups Accelerator: Black Founders program, is still connecting us to people in his network and identifying key opportunities for us months after the program wrapped. He continues to demonstrate that he is invested in seeing us succeed.
Our company has made great progress against our goals, in part thanks to receiving capital from the Google for Startups Black Founders Fund. We received $100K in non-dilutive funding along with Google Cloud credits, Google.org Ads grants, and hands-on support. We used the funds to pay for the transition and development costs associated with moving to Google Cloud. The Google support and accountability has been incredible. After receiving the Google for Startups Black Founders Fund award, we’ve gone on to raise another $1M and moved our cloud from Salesforce to Google Cloud.
We also had the amazing opportunity to be selected as one of six companies to take part in a face-to-face web conference with Sundar Pichai, Google’s CEO. We were thrilled to hear him explain his vision around health equity and the role Google plays. Ultimately, for us, it’s not just about the funding we get, but we are also gratified to receive support from an entity that truly believes in addressing this issue. We know Google is aligned with our mission of health and racial equity.
Championing diversity in clinical trials
Our 2022 looks bright. We expanded our presence to Washington, D.C. as part of the Johnson & Johnson Innovation JLABS ecosystem. We were also selected to take part in the BLUE KNIGHT initiative created between Johnson & Johnson Innovation and the Biomedical Advanced Research and Development Authority (BARDA) under the U.S. Department of Health and Human Services.
Acclinate is also on track to have contracts with five of the top 25 largest biopharmaceutical companies in the U.S this year. They’ve taken note, as has the Food and Drug Administration (FDA), that the lack of diversity in clinical trials represents a significant health concern—to the extent that the FDA has provided strong guidance for pharmaceutical companies to diversify their clinical trials. At the same time, the industry is also responding to pressure from communities of people of color to make equitable representation a priority.
Today, we are in the fortunate but challenging position to have significant inbound opportunities coming our way. In response, we continue to recruit and hire talented people to join our team. On the technology side, we are happy to be aligned with Google Cloud to have powerful cloud infrastructure that will scale with us, as well as high-caliber champions united in partnership. With people’s lives at stake, we are passionate in our commitment to helping ensure medications do what they are supposed to do: heal and improve the quality of life for everyone who takes them.
Hear Acclinate cofounders Del Smith and Tiffany Whitlow chat with Google’s Head of Startup Developer Ecosystem Jason Scott and fellow Black Founders Fund recipient Bobby Bryant about building on Google Cloud in a recent Google for Startups Instagram Live.
If you want to learn more about how Google Cloud can help your startup, visit our page here to get more information about our program, and sign up for our communications to get a look at our community activities, digital events, special offers, and more
Using Google Cloud’s Backup and DR Service with Logging and Monitoring Tools

1102
Of your peers have already read this article.
2:30 Minutes
The most insightful time you'll spend today!
Backup and DR data is a valuable business asset, and ensuring that it’s safe and accessible is essential. In particular, you want to be able to monitor your backups to ensure that the data is indeed protected and that you can quickly recover it in the event of a disaster, user error, or failed upgrade.
Users of Google Cloud’s Backup and DR service often ask:
- What are the best practices for monitoring my backup and recovery jobs?
- How can I proactively identify issues and troubleshoot?
- How can I create alerts and be notified about important events?
The good news is that Google Cloud Backup and DR now integrates with Cloud Logging and Cloud Monitoring tools. Now, you can monitor backup events, jobs, appliance health, resource consumption and user actions in the same way you monitor other Google Cloud workloads and services.
With this integration, you can now:
- Monitor events related to backup and restore – With detailed Google Cloud Backup and DR service event logs in Cloud Logging, you can now use log based alerts to create a customisable notification, in near-real time. This lets you monitor important events such as backup job failures, jobs that did not run, local backup storage saturation, and network failures.
- Configure fine grained alerting – You can write custom event queries on a wide variety of dimensions such as event severity, application type, application name, job type, job name, error message and many more. This gives a lot of flexibility to define alerts for specific events or conditions within a system, thus reducing noise and helping you identify and fix issues easily.
- Get notified on your preferred notification channel – Google Cloud offers seven pre-built notification channels that let you receive customisable notifications directly over email, SMS, Slack or the Google Cloud mobile app. Alternatively, you can integrate with your own monitoring and event management tools using webhooks or Pub/Sub.
- Derive useful insights to troubleshoot issues – With Log Analytics, you can use BigQuery to query your data using SQL queries and generate operational insights, which can help you reduce time spent troubleshooting. For example, you can analyze the key reasons that backup and restore jobs fail for a given application or application type.
The integration also lets you proactively discover deeper issues related to backup and recovery, such as capacity-related issues or certain job failures that happen periodically, by monitoring recurring events in the logs over time. With log-based metrics, you can:
- Create trend charts to track important metrics such as the number of backup or restore jobs that failed during a day/week/month
- Receive a notification when the number of occurrences crosses a threshold, for example receive a notification if a snapshot pool saturates more than five times a week
- Monitor trends in data, such as latency values in logs, and receive a notification if the values change in an unacceptable way.
Getting started
The time to learn that your backup failed should never be when you go to restore. By integrating our Backup and DR service with Cloud Monitoring and Cloud Logging, you can get valuable assurances about the health of your backup and business continuity processes with the same tools that you use to manage other Google Cloud workloads. To get started, check out the Backup and DR event logs page. You can also watch a video that shows you how to set up and use the service and configure some custom alerts.
Fairygoodboss and Google Cloud Tied to Advancing Diversity and Female Leadership at Workplaces

5121
Of your peers have already read this article.
2:00 Minutes
The most insightful time you'll spend today!
May is Asian American Pacific Islander Heritage Month — a time for us to come together to celebrate and remember the important people and history of Asian and Pacific Island heritage. This feature highlights founder Georgene Huang and how her startup Fairygodboss uses easy to use Google Cloud tools to grow and innovate.
Coming from a male-dominated industry like Wall Street, I never thought much about my gender. I was so focused on work that I didn’t feel like I could focus on my identity as a woman of color. That all changed when I found myself thrust into the job market while two months pregnant.
Traditionally, job-seeking sites are built by – and geared towards – men and their professional needs. There was no recruiting site that broke down what candidates who identify as women might expect from a company, let alone women of color like myself. I founded Fairygodboss to create a space where women can crowdsource information about opportunities and employers in order to make informed career decisions.
Fairygodboss
Fair•y•god•boss (noun): A person who elevates women at work.
Fairygodboss is the largest career community for women. In researching potential employers, I had many questions surrounding company culture, maternity leave, and women in leadership positions. While sites like Glassdoor provide high-level details for job seekers, I wanted more concrete examples and data than general salary information and anecdotes about work-life balance.
Fairygodboss began as a job review site geared towards women, but has expanded significantly since our initial launch. In addition to providing free resources like career connections, job listings, virtual recruiting events, community advice, and real research on how companies treat women, we also proactively help companies improve gender diversity. Fairygodboss partners with hundreds of top employers to create a 360-degree recruiting and employer branding program designed to drive female applicants to job postings by showcasing a company’s track record of women in leadership within a company, and their diversity investments.

Google Cloud + Fairygodboss: Data defined
At our core, Fairygodboss is a data-driven company, and we rely on Google Cloud to help us process, store, and analyze user-driven events occurring on the site. As a highly scalable, serverless, and cost-effective data warehousing solution, BigQuery collect millions of events each day, helping us identify where traffic is coming from (and where it goes next), and it produces actionable insights to provide better recommendations, information, and opportunities for women visiting our platform.
After seamlessly connecting our BigQuery data to Data Studio, we have been able to visualize and make sense of all the data we receive on our platform. Unlike some other data visualization tools, Data Studio allows us to analyze data in real time. With tools like BigQuery, we are now able to identify trends and gain a deep understanding for how our users interact with our site.
Google for Startups Accelerator: Women Founders
In order to provide more accurate job recommendations for our users, the Fairygodboss team wanted to build a machine learning prototype to classify our users and jobs into categories to facilitate more effective matching. So we applied for the Google for Startups Accelerator: Women Founders, a three-month digital accelerator program for high-potential Seed to Series A tech startups based in the U.S. and Canada. Along with tailored mentorship and product support from Googlers and industry experts, the Google for Startups Accelerator provided $100K in Google Cloud credits to scale our businesses. The mentorship we received from the Google Cloud technical experts as part of the Accelerator – special shout out to Peter Novig! – empowered us to integrate Cloud AutoML into our systems and ultimately curate more accurate job suggestions for our users.
Not only did the Google for Startups Accelerator program help to achieve our business goals for the year, it was also extremely beneficial to be connected with a cohort of other women founders of color. While we are all building different kinds of businesses across different industries, the guidance around fundraising, scaling teams, and coping with the struggles of being a founder rang true for all of us.
Advancing the community
It can be daunting to launch your own business – and even more so as an AAPI woman. Throughout my career, I am certain I have experienced unconscious bias around my race. Specifically, there have likely been “model minority” stereotypes about my demeanor and math abilities, assumptions that I may be mild-mannered or agreeable. While frustrating, these unfair tropes actually inspired me to see myself beyond others’ perceptions. Why be either analytical or creative, meek or brash, inspiring or agreeable? It’s the ors of life that prevent us from seeing ourselves as truly multi-dimensional individuals. I aspired to be more instead of or, and want my company to be as well.
As an inclusion-focused business, it is extremely important that Fairygodboss mindfully engage with all underrepresented groups. Diversity can be sliced in many different ways, and these intersections lead to great opportunities for change. We have a team of volunteer ‘culture wizards’ at work that provide educational resources and videos for those wanting to learn more about different cultures and identities from members of under-represented groups. We also practice what we preach at Fairygodboss by prioritizing diverse slates and diversity in our own hiring process. We aim for the talent we hire to be representative of the diverse communities we support. It is imperative to take an intentional approach to hiring diverse talent, as it falls on all employers to promote equity and inclusion—there are always ways in which we can all improve. Fairygodboss looks forward to evolving with Google Cloud in 2021 and beyond as we work together to foster inclusive teams around the world.
If you want to learn more about how Google Cloud can help your startup, visit our Startup Program application page here and sign up for our monthly startup newsletter to get a peek at our community activities, digital events, special offers, and more.
Unifying Data and AI: Bringing Unstructured Data Analytics to BigQuery

4177
Of your peers have already read this article.
2:30 Minutes
The most insightful time you'll spend today!
Over one third of organizations believe that data analytics and machine learning have the most potential to significantly alter the way they run business over the next 3 to 5 years. However, only 26% of organizations are data driven. One of the biggest reasons for this gap is that a major portion of the data generated today is unstructured, which includes images, documents, and videos. It is estimated to cover roughly up to 80% of all data, which has so far remained untapped by organizations.
One of the goals of Google’s data cloud is to help customers realize value from data of all types and formats. Earlier this year, we announced BigLake, which unifies data lakes and warehouses under a single management framework, enabling you to analyze, search, secure, govern and share unstructured data using BigQuery.
At Next ‘22, we announced the preview of object tables, a new table type in BigQuery that provides a structured record interface for unstructured data stored in Google Cloud Storage. This enables you to directly run analytics and machine learning on images, audio, documents and other file types using existing frameworks like SQL and remote functions natively in BigQuery itself. Object tables also extend our best practices of securing, sharing and governing structured data to unstructured, without needing to learn or deploy new tools.
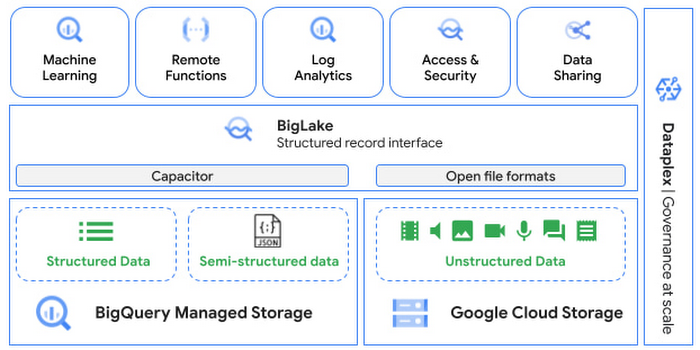
Directly process unstructured data using BigQuery ML
Object tables contain metadata such as URI (Uniform Resource Identifier), content type, and size that can be queried just like other BigQuery tables. You can then derive inferences using machine learning models on unstructured data with BigQuery ML. As part of preview, you can import open source TensorFlow Hub image models, or your own custom models to annotate the images. Very soon, we plan to enable this for audio, video, text and many other formats, and pre-trained models to enable out-of-the box analysis. Check out this video to learn more and watch a demo.
Create an object table
CREATE EXTERNAL TABLE my_dataset.object_table
WITH CONNECTION us.my_connection
OPTIONS(uris=["gs://mybucket/images/*.jpg"],
object_metadata="SIMPLE", metadata_cache_mode="AUTOMATIC");
# Generate inferences with BQML
SELECT * FROM ML.PREDICT(
MODEL my_dataset.vision_model,
(SELECT ML.DECODE_IMAGE(data) AS img FROM my_dataset.object_table)
);By analyzing unstructured data natively in BigQuery, businesses can
- Eliminate manual effort as pre-processing steps such as tuning image sizes to model requirements are automated
- Leverage the simple and familiar SQL interface to quickly gain insights
- Save costs by utilizing existing BigQuery slots without needing to provision new forms of compute
Adswerve is a leading Google Marketing, Analytics and Cloud partner on a mission to humanize data. Twiddy & Co. is Adswerve’s client – a vacation rental company in North Carolina. By combining structured and unstructured data, Twiddy and Adswerve used BigQuery ML to analyze images of rental listings and predict the click-through rate, enabling data-driven photo editorial decisions.
“Twiddy now has the capability to use advanced image analysis to stay competitive in an ever changing landscape of vacation rental providers – and can do this using their in-house SQL skills.” said Pat Grady, Technology Evangelist, Adswerve
Process unstructured data using remote functions
Customers today use remote functions (UDFs) to process structured data for languages and libraries that are not supported in BigQuery. We are extending this capability to process unstructured data using object tables.
Object tables provide signed URLs to allow remote UDFs running on Cloud Functions or Cloud Run to process the object table content. This is particularly useful for running Google’s pre-trained AI models, including Vision AI, Speech-to-Text, Document AI, open source libraries such as Apache Tika, or deploying your own custom models where performance SLAs are important.
Here’s an example of an object table being created over PDF files that are parsed using an open source library running as a remote UDF.
SELECT uri, extract_title(samples.parse_tika(signed_url)) AS title<br>FROM EXTERNAL_OBJECT_TRANSFORM(TABLE pdf_files_object_table,<br>["SIGNED_URL"]);
Extending more BigQuery capabilities to unstructured data
Business intelligence – The results of analyzing unstructured data either directly in BigQuery ML or via UDFs can be combined with your structured data to build unified reports using Looker Studio (at no charge), Looker or any of your preferred BI solutions. This allows you to gain more comprehensive business insights. For example, online retailers can analyze product return rates by correlating them with the images of defective products. Similarly, digital advertisers can correlate ad performance with various attributes of ad creatives to make more informed decisions.
BigQuery search index – Customers are increasingly using the search functionality of BigQuery to power search use cases. These capabilities now extend to unstructured data analytics as well. Whether you use BigQueryML to produce inference on images or use remote UDFs with Doc AI to produce document extraction, the results can now be search indexed and used to support search access patterns.
Here’s an example of search index on data that is parsed from PDF files:
CREATE SEARCH INDEX my_index ON pdf_text_extract(ALL COLUMNS);
SELECT * FROM pdf_text_extract WHERE SEARCH(pdf_text, "Google");Security and governance – We are extending BigQuery’s row-level security capabilities to help you secure objects in Google Cloud Storage. By securing specific rows in an object table, you can restrict the ability of end users to retrieve the signed URLs of corresponding URIs present in the table. This is a shared responsibility security model, for which administrators need to ensure that end users don’t have direct access to Google Cloud Storage, and use signed URLs from object tables as the only access mechanism.
Here’s an example of a policy for PII images that are secured to be first processed through a blur pipeline:
CREATE ROW ACCESS POLICY pii_data ON object_table_images
GRANT TO ("group:admin@example.com")
FILTER USING (ARRAY_LENGTH(metadata)=1 AND
metadata[OFFSET(0)].name="face_detected")
Soon, Dataplex will support object tables, allowing you to automatically create object tables in BigQuery and manage and govern unstructured data at scale.
Data sharing – You can now use Analytics Hub to share unstructured data with partners, customers and suppliers while not compromising on security and governance. Subscribers can consume the rows of object tables that are shared with them, and use signed URLs for unstructured data objects.
Getting Started
Submit this form to try these new capabilities that unlock the power of your unstructured data in BigQuery. Watch this demo to learn more about these new capabilities.
Special thanks to engineering leaders Amir Hormati, Justin Levandoski and Yuri Volobuev for contributing to this post.
More Relevant Stories for Your Company

Bigtable’s High Performance and Low Opex is Great for Building Personalization
Customer expectations have shifted as a result of evolving needs. Across industries, customers expect that you treat them as individuals, and demonstrate how well you understand and serve their unique needs. This concept—personalization—is the idea that you’re delivering a tailored experience to each customer corresponding to their needs and preferences;
WPP Innovates with the Cloud
Unlocking the Power of Data and Creativity withthe Cloud: The WPP Story

Unification of Dataplex and Data Catalog: A Full Spectrum of Data Governance and Data Management at Scale
Today, we are excited to announce that Google Cloud Data Catalog will be unified with Dataplex into a single user interface. With this unification, customers have a unified experience to search and discover their data, enrich it with relevant business information, organize it by logical data domains, and centrally govern

DR for Cloud: Architecting Microsoft SQL Server with Google Cloud
Database disaster recovery (DR) planning is an important component of a bigger DR plan, and for enterprises using Microsoft SQL Server on Compute Engine, it often involves critical data. When you’re architecting a disaster recovery solution with Microsoft SQL Server running on Google Cloud Platform (GCP), you have some decisions to make
