





Migrating From Oracle OLTP System to Cloud Spanner

3973
Of your peers have already read this article.
8:30 Minutes
The most insightful time you'll spend today!
Spanner uses certain concepts differently from other enterprise database management tools, so you might need to adjust your application to take full advantage of its capabilities. You might also need to supplement Spanner with other services from Google Cloud to meet your needs.
Migration constraints
When you migrate your application to Spanner, you must take into account the different features available. You probably need to redesign your application architecture to fit with Spanner’s feature set and to integrate with additional Google Cloud services.
Stored procedures and triggers
Spanner does not support running user code in the database level, so as part of the migration, you must move business logic implemented by database-level stored procedures and triggers into the application.
Sequences
Spanner does not implement a sequence generator, and as explained below, using monotonically increasing numbers as primary keys is an anti-pattern in Spanner. An alternative way to generate a unique primary key is to use a random UUID.
If sequences are required for external reasons, then you must implement them in the application layer.
Access controls
Spanner supports only database-level access controls using IAM access permissions and roles. Predefined roles can give read-write or read-only access to the database.
If you require finer grained permissions, you must implement them at the application layer. In a normal scenario, only the application should be allowed to read and write to the database.
If you need to expose your database to users for reporting, and want to use fine-grained security permissions (such as table- and view-level permissions), you should export your database to BigQuery.
Read the full article for more, including
- Data validation constraints
- Supported data types
- Migration process
- Transferring your data from Oracle to Spanner
- Maintaining consistency between both databases
- Verifying data consistency
- and more.
BigQuery Explainable AI for Demystifying the Inner Workings of ML Models. Now GA!

6550
Of your peers have already read this article.
2:00 Minutes
The most insightful time you'll spend today!
Explainable AI (XAI) helps you understand and interpret how your machine learning models make decisions. We’re excited to announce that BigQuery Explainable AI is now generally available (GA). BigQuery is the data warehouse that supports explainable AI in a most comprehensive way w.r.t both XAI methodology and model types. It does this at BigQuery scale, enabling millions of explanations within seconds with a single SQL query.
Why is Explainable AI so important? To demystify the inner workings of machine learning models, Explainable AI is quickly becoming an essential and growing need for businesses as they continue to invest in AI and ML. With 76% of enterprises now prioritizing artificial intelligence (AI) and machine learning (ML) over other initiatives in 2021 IT budgets, the majority of CEOs (82%) believe that AI-based decisions must be explainable to be trusted according to a PwC survey.
While the focus of this blogpost is on BigQuery Explainable AI, Google Cloud provides a variety of tools and frameworks to help you interpret models outside of BigQuery, such as with Vertex Explainable AI, which includes AutoML Tables, AutoML Vision, and custom-trained models.
So how does Explainable AI in BigQuery work exactly? And how might you use it in practice?
Two types of Explainable AI: global and local explainability
When it comes to Explainable AI, the first thing to note is that there are two main types of explainability as they relate to the features used to train the ML model: global explainability and local explainability.
Imagine that you have a ML model that predicts housing price (as a dollar amount), based on three features: (1) number of bedrooms, (2) distance to the nearest city center, and (3) construction date.
Global explainability (a.k.a. global feature importance) describes the features’ overall influence on the model and helps you understand if a feature had a greater influence than other features over the model’s predictions. For example, global explainability can reveal that the number of bedrooms and distance to city center typically has a much stronger influence than the construction date on predicting housing prices. Global explainability is especially useful if you have hundreds or thousands of features and you want to determine which features are the most important contributors to your model. You may also consider using global explainability as a way to identify and prune less important features to improve the generalizability of their models.
Local explainability (a.k.a. feature attributions) describes the breakdown of how each feature contributes towards a specific prediction. For example, if the model predicts that house ID#1001 has a predicted price of $230,000, local explainability would describe a baseline amount (e.g. $50,000) and how each of the features contributes on top of the baseline towards the predicted price. For example, the model may say that on top of the baseline of $50,000, having 3 bedrooms contributed an additional $50,000, close proximity to the city center added $100,000, and construction date of 2010 added $30,000, for a total predicted price of $230,000. In essence, understanding the exact contribution of each feature used by the model to make each prediction is the main purpose of local explainability.
What ML models does BigQuery Explainable AI apply to?
BigQuery Explainable AI applies to a variety of models, including supervised learning models for IID data and time series models. The documentation for BigQuery Explainable AI provides an overview of the different ways of applying explainability per model. Note that each explainability method has its own way of calculation (e.g. Shapley values), which are covered more in-depth in the documentation.

Examples with BigQuery Explainable AI
In this next section, we will show three examples of how to use BigQuery Explainable AI in different ML applications:
Regression models with BigQuery Explainable AI
Let’s use a boosted tree regression model to predict how much a taxi cab driver will receive in tips for a taxi ride, based on features such as number of passengers, payment type, total payment and trip distance. Then let’s use BigQuery Explainable AI to help us understand how the model made the predictions in terms of global explainability (which features were most important?) and local explainability (how did the model arrive at each prediction?).
The taxi trips dataset comes from the BigQuery public datasets and is publicly available in the table: bigquery-public-data.new_york_taxi_trips.tlc_yellow_trips_2018.
First, you can train a boosted tree regression model.
CREATE OR REPLACE MODEL bqml_tutorial.taxi_tip_regression_modelOPTIONS (model_type='boosted_tree_regressor',input_label_cols=['tip_amount'],max_iterations = 50,tree_method = 'HIST',subsample = 0.85,enable_global_explain = TRUE) ASSELECTvendor_id,passenger_count,trip_distance,rate_code,payment_type,total_amount,tip_amountFROM`bigquery-public-data.new_york_taxi_trips.tlc_yellow_trips_2018`WHERE tip_amount >= 0LIMIT 1000000
Now let’s do a prediction using ML.PREDICT, which is the standard way in BigQuery ML to make predictions without explainability.
SELECT *FROMML.PREDICT(MODEL bqml_tutorial.taxi_tip_regression_model,(SELECT"0" AS vendor_id,1 AS passenger_count,CAST(5.85 AS NUMERIC) AS trip_distance,"0" AS rate_code,"0" AS payment_type,CAST(55.56 AS NUMERIC) AS total_amount))

But you might wonder—how did the model generate this prediction of ~11.077?
BigQuery Explainable AI can help us answer this question. Instead of using ML.PREDICT, you use ML.EXPLAIN_PREDICT with an additional optional parameter top_k_features. ML.EXPLAIN_PREDICT extends the capabilities of ML.PREDICT by outputting several additional columns that explain how each feature contributes to the predicted value. In fact, since ML.EXPLAIN_PREDICT includes all the output from ML.PREDICT anyway, you may want to consider using ML.EXPLAIN_PREDICT every time instead.
SELECT *FROMML.EXPLAIN_PREDICT(MODEL bqml_tutorial.taxi_tip_regression_model,(SELECT"0" AS vendor_id,1 AS passenger_count,CAST(5.85 AS NUMERIC) AS trip_distance,"0" AS rate_code,"0" AS payment_type,CAST(55.56 AS NUMERIC) AS total_amount),STRUCT(6 AS top_k_features))

The way to interpret these columns is:
Σfeature_attributions + baseline_prediction_value = prediction_value
Let’s break this down. The prediction_value is ~11.077, which is simply the predicted_tip_amount. The baseline_prediction_value is ~6.184, which is the tip amount for an average instance. top_feature_attributions indicates how much each of the features contributes towards the prediction value. For example, total_amount contributes ~2.540 to the predicted_tip_amount.
ML.EXPLAIN_PREDICT provides local feature explainability for regression models. For global feature importance, see the documentation for ML.GLOBAL_EXPLAIN.
Classification models with BigQuery Explainable AI
Let’s use a logistic regression model to show you an example of BigQuery Explainable AI with classification models. We can use the same public dataset as before: bigquery-public-data.new_york_taxi_trips.tlc_yellow_trips_2018.
Train a logistic regression model to predict the bracket of the percentage of the tip amount out of the taxi bill.
CREATE OR REPLACE MODEL bqml_tutorial.taxi_tip_classification_modelOPTIONS(model_type='logistic_reg',input_label_cols=['tip_bucket'],enable_global_explain=true) ASSELECTvendor_id,passenger_count,trip_distance,rate_code,payment_type,total_amount,CASEWHEN tip_amount > total_amount*0.20 THEN '20% or more'WHEN tip_amount > total_amount*0.15 THEN '15% to 20%'WHEN tip_amount > total_amount*0.10 THEN '10% to 15%'ELSE '10% or less'END AS tip_bucketFROM`bigquery-public-data.new_york_taxi_trips.tlc_yellow_trips_2018`WHERE tip_amount >= 0LIMIT 1000000
Next, you can run ML.EXPLAIN_PREDICT to get both the classification results and the additional information for local feature explainability. For global explainability, you can use ML.GLOBAL_EXPLAIN. Again, since ML.EXPLAIN_PREDICT includes all the output from ML.PREDICT anyway, you may want to consider using ML.EXPLAIN_PREDICT every time instead.
SELECT *FROMML.EXPLAIN_PREDICT(MODEL bqml_tutorial.taxi_tip_classification_model,(SELECT"0" AS vendor_id,1 AS passenger_count,CAST(5.85 AS NUMERIC) AS trip_distance,"0" AS rate_code,"0" AS payment_type,CAST(55.56 AS NUMERIC) AS total_amount),STRUCT(6 AS top_k_features))

Similar to the regression example earlier, the formula is used to derive the prediction_value:
Σfeature_attributions + baseline_prediction_value = prediction_value
As you can see in the screenshot above, the baseline_prediction_value is ~0.296. total_amount is the most important feature in making this specific prediction, contributing ~0.067 to the prediction_value, though followed by trip_distance. The feature passenger_count contributes negatively to prediction_value by -0.0015. The features vendor_id, rate_code, and payment_type did not seem to contribute much to the prediction_value.
You may wonder why the prediction_value of ~0.389 doesn’t equal the probability value of ~0.359. The reason is that unlike for regression models, for classification models, prediction_value is not a probability score. Instead, prediction_value is the logit value (i.e., log-odds) for the predicted class, which you could separately convert to probabilities by applying the softmax transformation to the logit values. For example, a three-class classification has a log-odds output of [2.446, -2.021, -2.190]. After applying the softmax transformation, the probability of these class predictions is [0.9905, 0.0056, 0.0038].
Time-series forecasting models with BigQuery Explainable AI

Explainable AI for forecasting provides more interpretability into how the forecasting model came to its predictions. Let’s go through an example of forecasting the number of bike trips in NYC using the new_york.citibike_trips public data in BigQuery.
You can train a time-series model ARIMA_PLUS:
CREATE OR REPLACE MODEL bqml_tutorial.nyc_citibike_arima_modelOPTIONS(model_type = 'ARIMA_PLUS',time_series_timestamp_col = 'date',time_series_data_col = 'num_trips',holiday_region = 'US') ASSELECTEXTRACT(DATE from starttime) AS date,COUNT(*) AS num_tripsFROM`bigquery-public-data.new_york.citibike_trips`GROUP BY dateNext, you can first try forecasting without explainability using ML.FORECAST:SELECT*FROMML.FORECAST(MODEL bqml_tutorial.nyc_citibike_arima_model,STRUCT(365 AS horizon, 0.9 AS confidence_level))
This function outputs the forecasted values and the prediction interval. Plotting it in addition to the input time series gives the following figure.

But how does the forecasting model arrive at its predictions? Explainability is especially important if the model ever generates unexpected results.
With ML.EXPLAIN_FORECAST, BigQuery Explainable AI provides extra transparency into the seasonality, trend, holiday effects, level (step) changes, and spikes and dips outlier removal. In fact, since ML.EXPLAIN_FORECAST includes all the output from ML.FORECAST anyway, you may want to consider using ML.EXPLAIN_FORECAST every time instead.
SELECT*FROMML.EXPLAIN_FORECAST(MODEL bqml_tutorial.nyc_citibike_arima_model,STRUCT(365 AS horizon, 0.9 AS confidence_level))

Compared to the previous figure which only shows the forecasting results, this figure shows much richer information to explain how the forecast is made.
First, it shows how the input time series is adjusted by removing the spikes and dips anomalies, and by compensating the level changes. That is:
time_series_adjusted_data = time_series_data - spikes_and_dips - step_changes
Second, it shows how the adjusted input time series is decomposed into different components such as both weekly and yearly seasonal components, holiday effect component and trend component. That is
time_series_adjusted_data = trend + seasonal_period_yearly + seasonal_period_weekly + holiday_effect + residual
Finally, it shows how these components are forecasted separately to compose the final forecasting results. That is:
time_series_data = trend + seasonal_period_yearly + seasonal_period_weekly + holiday_effect
For more information on these time series components, please see the documentation here.
Conclusion
With the GA of BigQuery Explainable AI, we hope you will now be able to interpret your machine learning models with ease.
Thanks to the BigQuery ML team, especially Lisa Yin, Jiashang Liu, Amir Hormati, Mingge Deng, Jerry Ye and Abhinav Khushraj. Also thanks to the Vertex Explainable AI team, especially David Pitman and Besim Avci.
Held Back by Database Scalability, This Financial Services Company Switches to Google Cloud and Cloud Spanner

11561
Of your peers have already read this article.
4:30 Minutes
The most insightful time you'll spend today!
Azimut Group operates an international network of companies handling investment and asset management, mutual funds, hedge funds, and insurance. Founded in Milan, Italy in 1988, Azimut Group today has branches in fifteen countries, including Brazil, China, and the USA.
“We have subsidiaries and manage funds all over the world,” explains Simone Bertolotti, IT Manager at Azimut Holding S.p.a. “That means that any technology that we put in place has to cover needs from many different countries.”
“When complicated analysis has to be executed, we have to increase our table space in a couple of minutes so that the AI can drill down into the data and deliver the information we need.”
—Simone Bertolotti, IT Manager, Azimut Holding S.p.a.
Azimut manages its funds with investment advisors who use information sourced from Bloomberg, Reuters and others. “They use a huge amount of data,” says Simone. “They work with spreadsheets, algorithms, formulae and they analyse data in minutes.” In finance, every second is crucial, which is why Azimut decided to develop a risk management dashboard that can process information even more quickly, then distribute it worldwide.
“When an advisor manages data, that data is used to make immediate decisions on funds, capital movements or whether to sell stock,” says Simone. “They have to be ready to make recommendations for any amount of data that comes to them. For our dashboard, that means that when additional information arrives or complicated analysis has to be executed, we have to increase our table space in a couple of minutes so that the AI can drill down into the data and deliver the information we need.”
Generating insights at speed
Investors and investment managers make decisions based on the most accurate, up-to-date information possible. For Azimut Group, information sourced through financial data vendors such as Bloomberg and Reuters provided only part of the data that the group required.
“We looked to collect information from a range of different providers,” explains Simone, “then analyse it to develop a predictive algorithm that could work faster than an advisor stationed at the terminal. We set ourselves the challenge to try to manipulate that data to add new insights into our matrix, so that every one of our branches across the world can see risk information about the funds in real-time.”
“We compared Google Cloud Platform’s performance with our previous cloud provider, and saw huge benefits of switching to Google. For me, the key performance issue is scaling. With Google Cloud Platform I know that I can increase and decrease my infrastructure quickly, when I need it.
—Simone Bertolotti, IT Manager, Azimut Holding S.p.a.
The first cloud provider Azimut used to build its system struggled to scale quickly to meet different kinds of data challenges. “If we wanted to add more cores, that was fine,” says Simone. “But the previous cloud provider made it complicated to raise the amount of space in a database infrastructure and scale up to demand. Scaling up for more in-depth analysis would take a day, and our need was immediate.”
That’s why Azimut switched one year ago to Google Cloud Platform to run the 150 VMs on its risk analysis platform. “We compared Google Cloud Platform’s performance with our previous cloud provider, and saw huge benefits of switching to Google. For me, the key performance issue is scaling,” says Simone. “With Google Cloud Platform I know that I can increase and decrease my infrastructure quickly, when I need it. Instead of waiting a day to scale up infrastructure, we can request and add space to our database in a couple of minutes.”
The infrastructure of Azimut’s solution handles around 800TB of data per month, and Google’s global network of servers and high-speed connections ensure that it gets to where it’s most needed by the most direct route. Impressed by the speed, security and availability of Google Cloud Platform, Azimut has moved its intranet on to Google Cloud Platform, too, eliminating the need for staff to login with VPNs.
“Instead of waiting a day to scale up infrastructure, we can request and add space to our database in a couple of minutes.”
—Simone Bertolotti, IT Manager, Azimut Holding S.p.a.
Driving ahead with Noovle
For Azimut, migrating the risk management dashboard is the latest of many Google product collaborations with cloud consultancy Noovle. “Everything started five years ago,” says Simone, “when Noovle assisted us in migrating to Gmail from our on-premise email solution. From G Suite to Google Cloud Platform, we’ve had a great relationship. Noovle provides consultancy services, support for mobility, and external advisors who work on our premises, such as when they trained us how to broadcast our meetings on Google Hangouts. As an independent company, we know we can trust them for transparent advice. All they care about is the best way to get a job done and to help us reach our goals.”
New app, new customers
In a business case comparison, Google Cloud Platform cost Azimut 35% less to run than the previous cloud provider. Now the group is building a major new mobile application on Google App Engine to be released in 2018.
“The new mobile application will allow customers to trade directly, without human advisors, by proposing different investment solutions depending on targets the customers set,” says Simone. “So if a customer aims to make money with investments, they enter their relevant personal information and we carry out the necessary regulatory checks and suggest what they could buy. The entire project will be based on Google Cloud Platform, so customers can control their investments through the app while we manage the fund, using Google Cloud Spanner on the backend.”
The Fantastic Story of How BMG Enables a Micropayments Strategy So Music Artists Get Paid

7428
Of your peers have already read this article.
3:30 Minutes
The most insightful time you'll spend today!
The music industry is rapidly changing. Only 20 years ago, the availability of music and the infrastructure that was required to make an album a sales success were incredibly complex and expensive. With the decline of physical sales and a fundamental shift to digital, music streaming now accounts for more than half of all sales globally.
At the same time, technology has democratized music-making; in many ways, it has made the musical landscape more diverse. Artists can upload their music with the click of a button. But while it’s easier for creators to share their songs with audiences, getting paid has become more fragmented.
Although music is booming, people no longer buy it outright. Instead, listeners download music digitally or subscribe to streaming services to have their libraries with them at all times. To monetize digital content effectively, artists need to know when, where, and how often their songs are played on each service. To help them navigate this complicated royalties landscape and maximize their profits, Berlin-based international music company BMG provides customized, transparent, and fair services to songwriters and artists.
With publishing and recording divisions under one roof, the subsidiary of international media giant Bertelsmann works with both emerging artists and established stars, including John Legend, Kylie Minogue, Mick Jagger, and Keith Richards. With the MyBMG web and mobile application, clients can view and analyze their royalty details in real time and collect payment. When a new record is released, BMG uses data to maximize its impact and revenue for its creators.
“We make sure that everyone who uses our clients’ music knows who needs to be paid the associated royalties, then we collect these royalties and share them out quickly and transparently,” explains Sebastian Hentzschel, Chief Information Officer at BMG. “When our artists release new music, we make sure that it’s marketed and promoted effectively around the world.”
“We needed a scalable solution for our royalty workloads that was intuitive for our developers. We also wanted a partner, not a client-vendor relationship. With autoscaling via BigQuery, excellent customer support, and a clean and simple user interface, Google Cloud ticks every box for us.”
—Gaurav Mittal, Vice President Group Technology, BMG
Getting up to speed with a new way of paying artists
In this digital world, artists aren’t just paid every time a fan buys an album—they’re paid a small amount, or royalty, for each song downloaded or streamed by a listener. So, when the industry shifted to digital, the volume of data that BMG needed to handle grew exponentially. “One CD sale is equivalent to about 1,500 streamed songs or plays,” says Gaurav Mittal, Vice President Group Technology at BMG. “That means IT departments have to process 1,500 times the amount of data to calculate payments for artists, and this makes scalable micropayment processing very important.”
Until 2019, BMG’s infrastructure was entirely hosted on-premises. Hardware limitations made it challenging to scale on-demand, making it harder to handle the data peaks that royalty processing can bring. “With our on-premises infrastructure, we were going to hit a ceiling in a few years,” says Gaurav. “We still managed to process royalty payments for our clients, but it was increasingly time consuming and expensive. To keep focusing on our clients, rather than our infrastructure, we decided to migrate to Google Cloud.”
From the outset, Gaurav and his team had a clear vision for the partnership: “Most importantly, we needed a scalable solution for our royalty workloads that was intuitive for our developers. We also wanted a partner, not a client-vendor relationship,” he says. “With autoscaling via BigQuery, excellent customer support, and a clean and simple user interface, Google Cloud ticks every box for us.”
Keeping artists happy with business-as-usual payouts during migration
To move applications to the cloud while keeping payment cycles on track for its artists, BMG teamed up with Google Cloud partner Rackspace Technology. “We selected Rackspace Technology because it combines strong technical muscle and a global footprint, with the customer service of a local boutique firm,“ shares Gaurav.
BMG’s own technology team put together the outline for the Google Cloud architecture, which they passed on to Rackspace Technology for optimizations and the ultimate stamp of approval. Whenever Gaurav and his developers needed support, Rackspace Technology was ready to go. “So far, we’ve migrated 17 applications successfully, and Rackspace Technology has been 100% spot-on with each suggestion,” says Gaurav. “I can’t recall a single flaw in a Rackspace Technology-approved architecture, and that really says something.”
When BMG began its migration in August 2019, the team developed an ambitious two-year plan. Only 14 months later, however, the project is more than 75% complete. Among the solutions that BMG is using today are Cloud Storage to securely store 130 TB of data, and Cloud SQL as its standard database technology. The web applications run on Compute Engine, App Engine, and Google Kubernetes Engine.
“After successfully moving a few applications, it was clear that with the strong teamwork of BMG and Rackspace Technology, together with the ease of use of Google Cloud, we could speed up the project without sacrificing quality,” says Gaurav. “We’re set to complete our migration six months before schedule, helping us to quickly move out of our hybrid environment.”
“Our income-tracking teams are very savvy on the data, and the simplicity of Google Cloud empowers them to self-serve analytics, rather than wait for IT. Our teams are much more productive.”
—Gaurav Mittal, Vice President Group Technology at BMG
Royalty reporting and processing with BigQuery and Dataproc
So far, all of BMG’s critical workloads are up and running on Google Cloud. Royalty calculations, for example, which require incredible processing power and the collection of many micropayments to ensure full and timely payout, run entirely on Dataproc with output stored on BigQuery for downstream integration and reporting.
Enabling more harmonious workflows through self-serve analytics
As the new beating heart of BMG’s royalty reporting, BigQuery changed the rhythm of collaboration company-wide. In the past, income tracking teams had to contact IT departments if they needed deeper data insights for their work. By integrating Data Catalog with BigQuery, BMG has made the data more accessible to all teams. This helps them detect missing income and new revenue streams independently, maximizing profits for artists.
“Our income-tracking teams are very savvy on the data, and the simplicity of Google Cloud empowers them to self-serve analytics, rather than wait for IT,” says Gaurav. “Our teams are much more productive.”
“Google Cloud enables us to be more client focused and deliver better features faster. We believe it’s just the beginning. We offer rights and royalty services for music publishing, recorded music, neighboring rights, and books. Without scalability limitations, it’s absolutely conceivable to offer our platform as a service to other companies or industries, such as gaming. Google Cloud has opened a world of possibilities.”
—Sebastian Hentzschel, Chief Information Officer, BMG
With a leaner IT environment, BMG can focus its effort on the needs of its clients. Beyond improvements in royalty processing, it can concentrate on app development, releasing new features and enhancements more frequently. By hosting applications on Google Kubernetes Engine, App Engine, and Compute Engine, BMG has built a CI/CD pipeline with automated deployments and testing to significantly speed up workflows.
“In our old system, it could take several weeks to set up an environment,” says Gaurav. “With Google Kubernetes Engine, any of our developers can complete the process in a few clicks. Having that autonomy makes our developers more motivated and self-driven.”
“Google Cloud enables us to be more client focused and deliver better features faster,” adds Sebastian. “We believe it’s just the beginning. We offer rights and royalty services for music publishing, recorded music, neighboring rights, and books. Without scalability limitations, it’s absolutely conceivable to offer our platform as a service to other companies or industries, such as gaming. Google Cloud has opened a world of possibilities.”
With the migration almost complete, BMG is looking forward to its next technology project. It plans to leverage AutoML to further scale and automate royalty tracking with machine learning. On the marketing side, advanced analytics will help BMG determine the effectiveness of promotional campaigns around the world, further increasing profits for artists. By connecting Google Data Studio to BigQuery, BMG will increase the quality of its analyses, helping musicians better understand the reach of their music around the world.
In the end, Gaurav shares, helping musicians is what it all comes down to. “We’re a new kind of music company because we build our services around our artist, songwriter, and publisher clients, not the other way around,” he says. “Google Cloud is helping us maintain strong relationships with our clients, and that’s music to our ears.”
Transform Your Customer Experience with Latest Database Innovations

2980
Of your peers have already read this article.
2:30 Minutes
The most insightful time you'll spend today!
We’re all accustomed to Google magic in our daily lives. When we need information like the time a store closes, the best route to a destination, help cooking a favorite recipe — we just ask Google. Google is known for providing useful information everywhere, wherever you are.
But for business, it isn’t so easy to get answers to important questions. In a recent study by HBR, only 30% of respondents report having a well-articulated data strategy and, at most, 24% of respondents said they thought their organization was data-driven. If you asked, most of these executives would probably tell you they’re drowning in data, so how come they’re struggling to be data-driven?
Data’s journey begins in operational databases, where the data is born as users and systems interact with applications. Operational databases are the backbone of applications and are essential ingredients for building innovative customer experiences. At Google Cloud, we have been focused on building a unified and open platform that provides you the easiest and fastest way to innovate with data. Google’s data cloud enables data teams to manage each stage of the data lifecycle from operational transactions in databases to analytical applications across data warehouses, lakes, data marts, and to rich data-driven experiences.
For example, Merpay, a mobile payment service in Japan, wanted to build its experience on a database that delivered on requirements around availability, scalability and performance. By using Cloud Spanner, Merpay was able to reduce overhead costs and ultimately devote engineering resources to developing new tools and solutions for their customers.
If you’re looking to bring the same kinds of transformation to your organization, let’s dive into the latest database announcements and how they can help you do that:
Tap into transformative database capabilities
Google’s data cloud allows organizations to build transformative applications quickly with our one-of-a-kind databases such as Cloud Spanner, Google Cloud’s fully managed relational database with global scale, strong consistency, and industry leading 99.999% availability. Leading businesses across industries such as Sabre, Vimeo, Uber, ShareChat, Niantic, and Macy‘s use Spanner to power their mission-critical applications and delight customers. Recent innovations in Spanner such as granular instance sizing and PostgreSQL interface lower the barrier to entry for Spanner, thus making it accessible for any developer and for any application, big or small.
In that effort, we are excited to announce Spanner free trial instances to give developers an easy way to explore Spanner at no cost. The new free trial for Spanner provides a zero-cost, hands–on experience to try out Spanner and comes with guided tutorials and a sample database. The Spanner free trial provides a Spanner instance with 10GB storage for 90 days. Customers can upgrade to a paid instance anytime during the 90-day period to continue exploring Spanner and unlock the full capabilities of Spanner, such as unlimited scaling and multi-region deployments. To learn more about the new free trial, you can read this blog and watch this short video. Start your free trial today in the Google Cloud console.
We’re also excited to announce the preview of fine-grained access control for Spanner that lets you authorize access to Spanner data at the table and column level. Spanner already provides access control with Identity and Access Management (IAM) which enables a simple and consistent access control interface for all Google Cloud services. With fine-grained access control, it’s now easier than ever to protect your transactional data in Spanner and ensure appropriate security controls are in place when granting access to data. Learn more about fine-grained access control in this blog.
Generate exponential value from data with a unified data cloud
Google’s common infrastructure for data management has many advantages. Thanks to our highly durable distributed file systems, disaggregated compute and storage at every layer, and high-performance Google-owned global networking, we’re able to provide best-in-class, tightly integrated operational and analytical data services with superior availability and scale at the best price- performance and operational efficiency.
In that effort, today we’re excited to announce Datastream for BigQuery, now in preview. Developed in close partnership with the BigQuery team, Datastream for BigQuery delivers a unique, truly seamless and easy-to-use experience that enables real-time insights in BigQuery with just a few steps.
Datastream efficiently replicates updates directly from source systems into BigQuery tables in real-time by using BigQuery’s newly developed Change Data Capture (CDC) and Storage Write API’s UPSERT functionality. You no longer have to waste valuable resources building and managing complex data pipelines, self-managing staging tables, tricky DML merge logic, or manual conversion from database-specific data types into BigQuery data types. Just configure your source database, connection type, and destination in BigQuery and you’re all set.
Klook, a Hong Kong-based travel company, is one industry-leading enterprise using Datastream for BigQuery to help drive better business decisions. “Prior to adopting Datastream, we had a team of data engineers dedicated to the task of ingesting data into BigQuery, and we spent a lot of time and effort making sure that the data was accurate,” said Stacy Zhu, senior manager for data at Klook. “With Datastream, our data analysts can have accurate data readily available to them in BigQuery with a simple click. We enjoy Datastream’s ease of use and its performance helps us achieve large scale ELT data processing.”
Achievers, an award-winning employee engagement software and platform, recently adopted Datastream, as well. “Achievers had been heavily using Google Cloud VMs (GCE), and Google Kubernetes Engine (GKE)” says Daljeet Saini, lead data architect at Achievers. “With the help of Datastream, Achievers will be streaming data into BigQuery and enabling our analysts and data scientists to start using BigQuery for smart analytics, helping us take the data warehouse to the next level.”
To make it easier to stream database changes to BigQuery and other destinations, Datastream is also adding support for PostgreSQL databases as a source, also in preview. Datastream sources now include MySQL, PostgreSQL, AlloyDB for PostgreSQL, and Oracle databases, which can be hosted on premises, on Google Cloud services such as Cloud SQL or Bare Metal Solution for Oracle, or anywhere else on any cloud.
Key use cases for Datastream include real-time analytics, database replication via continuous change data capture, and enablement of event-driven application architectures. In real-world terms, real-time insights can help a call center provide better service by measuring call wait times continuously, rather than retrospectively at the end of the week or month. And retailers or logistics companies that do inventory management based on real-time data can become far less wasteful than if it were based on periodic reports.
Accelerate your modernization journey to the cloud
In recent years, application developers and IT decision makers have increasingly adopted open-source databases to ensure application portability and extensibility and prevent lock-in. They’re no longer willing to tolerate the opaque costs or the overpriced and restrictive licensing of legacy database vendors.
In particular, PostgreSQL has become the emerging standard for cloud-based enterprise applications. Many organizations are choosing to standardize on PostgreSQL to reduce the learning curve for their teams and avoid the lock-in from the previous generation of databases. Google’s data cloud offers several PostgreSQL database options including AlloyDB for PostgreSQL, a PostgreSQL-compatible database that provides a powerful option for migrating, modernizing, or building commercial-grade workloads
To help developers and data engineers modernize and migrate their applications and databases to the cloud, we’re pleased to announce, in preview, that our Database Migration Service (DMS) now supports PostgreSQL migrations to AlloyDB. DMS makes the journey from PostgreSQL to AlloyDB easier and faster, with a serverless migration you can set up in just a few clicks. Together with Oracle to PostgreSQL data and schema migration support, also in preview, DMS gives you a way to modernize legacy databases and adopt a modern, open technology platform. Learn more about PostgreSQL to AlloyDB migration with DMS in this blog.
Among organizations adopting PostgreSQL is SenseData. A platform created to improve the relationship between companies and customers, SenseData is a market leader in Latin America in the field of Customer Success.
“At Sensedata, we’ve built our customer success platform on PostgreSQL, and are looking to increase our platform performance and scale for the next phase of our growth,” said Paulo Souza, co-founder and CTO of SenseData. “We have a mixed database workload, requiring both fast transactional performance and powerful analytical processing capabilities, and our initial testing of AlloyDB for PostgreSQL has given impressive results, with more than a 350% performance improvement in our initial workload, without any application changes. We’re looking forward to using Database Migration Service for an easy migration of multiple terabytes of data to AlloyDB.”
CURA Grupo is one of Brazil’s largest medical diagnostics conglomerates with over 1,600 employees, 500 qualified physicians, and 6 million examinations conducted every year. With more than 30,000 examinations performed every day, storing the database on premises was becoming increasingly unfeasible. CURA Grupo used Database Migration Service to migrate to Google Cloud, along with synchronization between their on-prem server’s database and the cloud. The result was an easy transition with just around 20 minutes of downtime.
To learn more about these exciting innovations and more, join us at Next 22 happening on October 11-13. You will also hear from customers such as PLAID, Major League Baseball, DaVita, CERC, Credit Karma, Box, and Forbes who are all innovating faster with Google Cloud databases.
10506
Of your peers have already watched this video.
2:15 Minutes
The most insightful time you'll spend today!
The True Story of How HotStar Broke a World-Record–Thanks to Firebase and Google BigQuery
Hotstar, India’s largest video streaming platform with 150 million monthly active users around the world, provides live-streaming of TV shows, movies, sports, and news on the go.
By using a combination of Firebase products together, Hotstar safely rolled out new features to its watch screen during a major live-streaming event without disrupting users, sacrificing stability, or releasing a new build. They also used Firebase with BigQuery to analyze their event data and reduce app startup time.
“We have an ambitious mission, but our engineering team is only a fraction of the size of most of our competitors. But we are still keeping up, and we are doing it with the help of Firebase,” says Ayushi Gupta, Android Engineer, Hotstar.
More Relevant Stories for Your Company



Behind the Scenes: How eBay Provides its Customers New Shopping Experiences
“If it exists in the world, you are likely to find it on eBay.” So they say. With 180 million buyers and a global presence in over 190 markets, it’s probably true. A company that emerged out of the ashes of the dot-com bubble, eBay today is one of the
What’s Google Cloud Firestore Database and What are it’s Benefits for Business and Developers?
Cloud Firestore is a NoSQL document database that simplifies storing, syncing, and querying data for your mobile and web apps at global scale. Cloud Firestore is a fast, fully managed, serverless, cloud-native NoSQL document database that simplifies storing, syncing, and querying data for your mobile, web, and IoT apps at

BigQuery Omni: A Game-Changer for Cross-Cloud Data Analysis
Research shows that over 90% of large organizations already deploy multicloud architectures, and their data is distributed across several public cloud providers. Additionally, data is also increasingly split across various storage systems such as warehouses, operational and relational databases, object stores, etc. With the proliferation of new applications, data is
What is Google Cloud SQL?
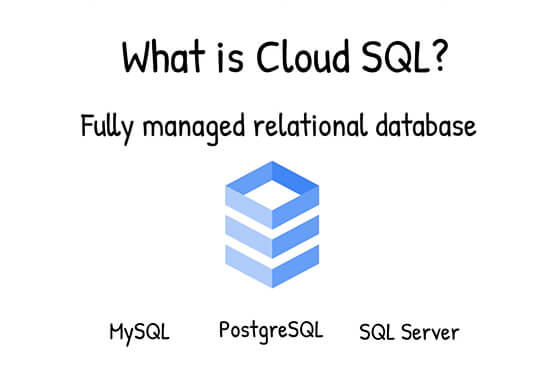
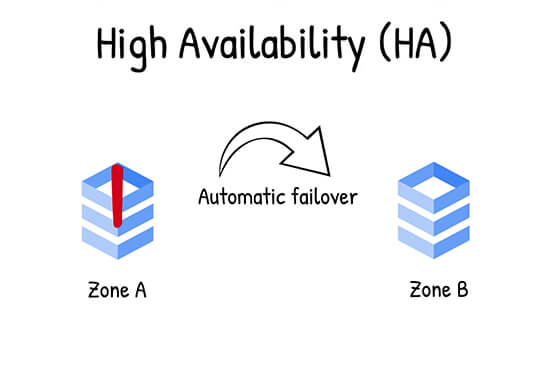
Cloud SQL is a fully managed relational database for MySQL, PostgreSQL, and SQL Server. It reduces maintenance cost and automates database provisioning, storage capacity management, replication, and backups. It offers quick setup, with standard connection drivers and built-in migration tools. How Do You Set It Up? Cloud SQL is easy
