





Building API-enabled Partnerships Fosters Growth and Innovation
4419
Of your peers have already read this article.
5:00 Minutes
The most insightful time you'll spend today!
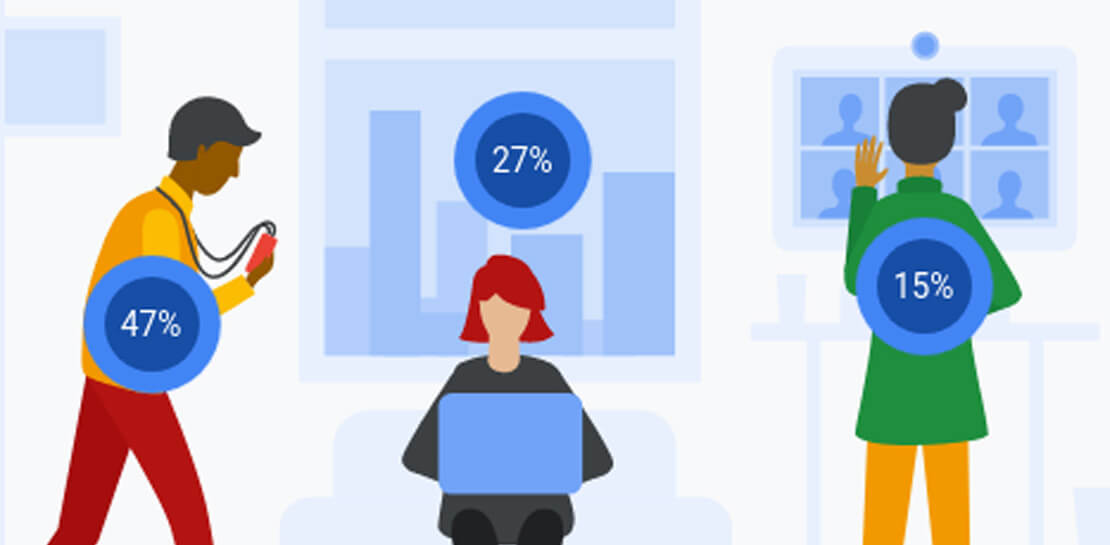
Oxford Economics and Google Cloud surveyed 1,000 CIOs across seven industries around the world to understand their approaches to developing strong business partnerships that support innovation and drive business results—and to find out what the most successful companies are doing differently. Download to read more.

How to Use Data to Tell Compelling Stories and Win New Deals

4497
Of your peers have already read this article.
2:30 Minutes
The most insightful time you'll spend today!
A picture is worth a thousand words–especially at work. The data we present every day is what helps us drive decision-making in the workplace. But understanding how to visualize a story can be difficult if you’re left staring at numbers sitting stagnant in rows or columns within a spreadsheet.
This is where visualization with charts and reports becomes critical. Let’s say your team needs to understand global sales trends. If you have a waterfall chart that shows regional contribution to total revenue or a scatter plot that shows individual salesperson performance, it’s much easier to spot patterns, draw insights, and make informed recommendations. The same goes for analyzing travel expenses.
In Google Sheets, we have several built-in tools that make it easy to create and share useful charts and reports so that you can quickly visualize data (without having to leave the spreadsheet). Follow these tips to showcase your data in Sheets and influence decisions.
1. Pick the most compelling way to visualize your data.
Perhaps just as important as the data you reference is the way in which you present it. Charts are the basic building blocks for data visualization and can take many forms–from bar charts to line graphs to scatter plots. There are more than 30 chart types to choose from in Sheets, and we’re constantly adding more ways to express your data. Here are a few we recommend:
- To draw attention to a key metric or KPI, try the brand new scorecard chart. For example, you can show the total sales number for your organization’s top-selling product, and even call out percentage increase or decrease over time.
- To illustrate how values add to or subtract from a starting value, try a waterfall chart. For example, show how your product sales and restocking efforts led to a net decrease in inventory from last quarter to this quarter.
- To represent different data series using lines and bars, try a combo chart. For example, you can show revenue in bars and profit margins in a line across the same chart, giving you a more complete picture of your organization’s financial health.
If you’re unsure how to best present your data, Google’s built-in machine learning can help you choose the right visualization—Sheets intelligently suggests charts for you. Simply highlight data you would like to visualize, click the chart button, and then select one of the suggested charts. According to our internal data, more than 1.5 million charts are inserted into Sheets each week based on intelligent recommendations.
Note: Once you have a chart inserted into Sheets, you may want to control the look and feel. We recently made it possible to click directly on data labels, chart titles, or legends and drag to reposition them. You can also easily delete these elements using the delete or backspace keys, if you want to make other data points stand out. We’re exploring even more ways to customize charts—stay tuned.
2. Be sure to tell a complete story.
Data really comes to life when you put several charts and tables together into a report or dashboard. Going back to our sales data example, an individual line graph showing revenue over time gives you quick insight into the general sales trend for your organization (hopefully, up and to the right!). But when you surround that line graph with other charts and tables–like a pie chart showing total revenue breakdown by-product, or a stacked bar chart comparing revenue driven by each sales team–you can tell a more complete story.
If you do build reports featuring multiple charts, there are ways that Sheets can help you organize and format them more quickly. Earlier this year, we made it easier to align, size, and position objects within your spreadsheets so you can quickly put several charts together. We also recently added themes, which let you alter the look and feel of an entire spreadsheet—including charts, pivot tables, and cells—to ensure a consistent look and feel across the elements in your report. To apply a preset theme, select Format > Theme and choose the right option. Faster formatting can mean faster reporting.
Report on API-led Digital Transformations in 2020 and the Future
6796
Of your peers have already read this article.
1:30 Minutes
The most insightful time you'll spend today!
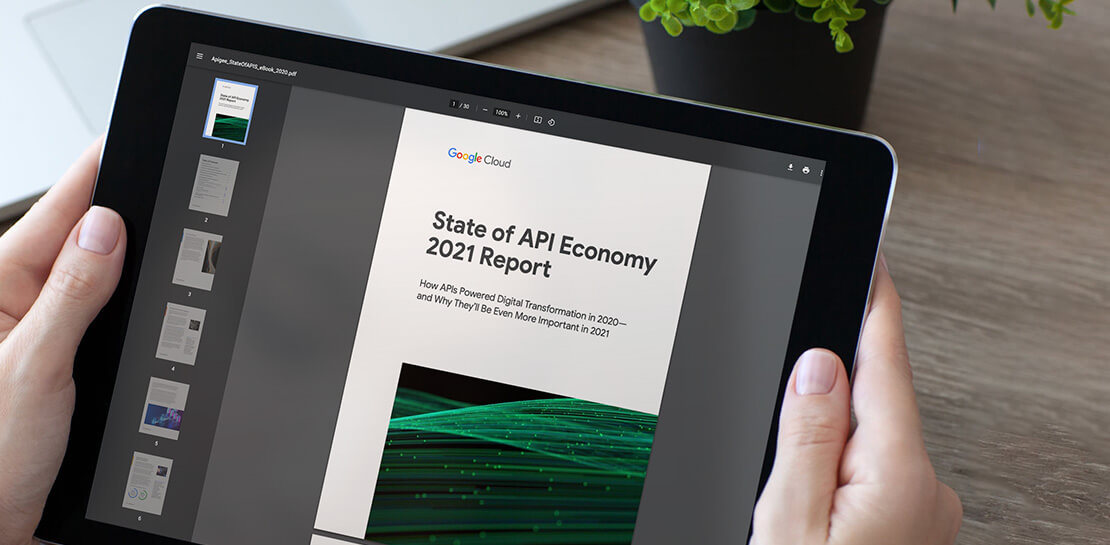
In 2020, many businesses across industries turned their focus and investments towards digital strategies. APIs being an integral part of every organization’s digital disruption, will grow in relevance throughout 2021. Read the report to gain more insights on driving API-led digital transformations and in-depth analysis of Google Cloud’s Apigee API Management Platform usage data, case studies and third-party surveys conducted with tech leaders.
How Arvind Fashions Ltd leads the fashion industry with powerful data analytics on BigQuery

4113
Of your peers have already read this article.
3:30 Minutes
The most insightful time you'll spend today!
Arvind Ltd has been in the apparel industry for more than 90 years, with its retail powerhouse Arvind Fashions Ltd being the backbone of well-known names in the retail fashion industry in India.
Arvind Fashions Ltd (Arvind) has seen significant growth in its portfolio with new franchises being added every year. The six high conviction brands include Tommy Hilfiger, Calvin Klein, Sephora, Arrow, U.S. Polo Assn. & Flying Machine.
To secure a foundation for future growth, the company has embarked on a digital transformation (DX) journey, focusing on profitability and improving the customer experience. The key objectives for Arvind’s DX is to unlock the value of existing applications, gain new insights, and build a solid workflow with resilient systems.
Getting Google Cloud to address the challenges around insights & analytics was a natural step forward, since Arvind had already formed a relationship with Google Cloud, starting with its productivity and collaboration tools during the pandemic.
Key Challenges
Arvind’s enterprise applications estate is a mix of SAP, Oracle POS, logistics management systems and other applications. Having so many different applications made it a challenge for the company to bring all of this data together to drive retail insights and at the same time maintain the freshness of its products.
As a case in point, the existing sales reporting and inventory reconciliation process had been enabled by a mix of automated and semi-automated desktop applications. There were challenges to scale the infrastructure in order to process large amounts of data at a low latency.
The synchronization of master data across functions was critical to build the data platform that provides consistent insights to multiple stakeholders across the organization.
Solution Approach – Modern Data Platform
There are several ways to solve the challenges above and do more by building a modern data analytics platform. For example, using a data lake based approach that builds use case by use case, hybrid data estates and so on. Regardless of the approach, it is important to define the solution based on certain principles.
In Arvind’s scenario, the key business principles considered are that data platforms should support Variety, Variability, Velocity and Volume. Each of these 4 V’s are critical business pivots to successful fashion retailing. Variety in SKU’s to deal with myriad fashion trends every season, Variability in shopping footfalls due to different festivities, weekends and special occasions, Velocity to be agile and responsive to customer needs, and Volumes of data that bring richer insights.
This is where Google BigQuery enabled data platform comes in, as it is able to meet the needs above.
Solution Architecture – Current Capabilities & Future Vision
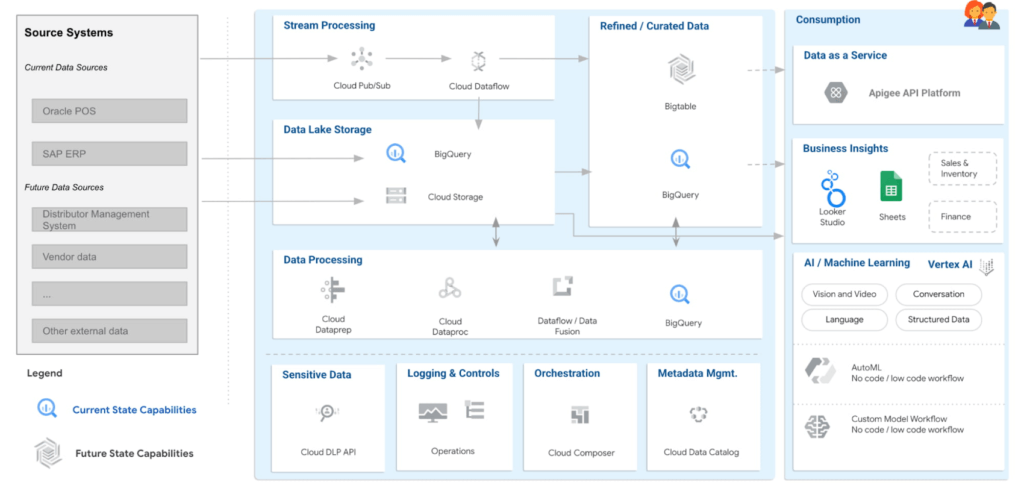
BigQuery is the mothership of the data and analytics platform on Google Cloud. Its serverless construct ensures that data engineering teams focus only on insights & analytics. Storage and compute is decoupled and can be independently scaled. BigQuery has been leveraged to service both the raw as well as the curated data zones.
With BigQuery procedures, it is possible to process the data natively within the data warehouse itself. Procedures have been leveraged to process the data in a low latency manner with the familiar SQL.
But then what happens to advanced analytics and insights? With simplicity being our key guiding principle, BigQuery machine learning ensures that data analysts can create, train and deploy analytics models even with complex requirements. It can also consume data from Looker Studio, which is seamlessly integrated with BigQuery.
Here are the key principles and highlights of the data platform that have been achieved:
- Simple, yet exhaustive – We needed a solution with vast technical capabilities such as data lake & data warehouse, data processing, data consumption, analytics amongst others. And at the same time it needed to be simple to implement and run ongoing operations.
- Agility – High quality analytics use cases typically require a significant amount of time, effort and skill set. While building a simple solution we ensured that the selection of technology services ensured agility in the long term.
- Security – An organization can be truly successful if the insights and analytics operations are democratized. But while data is made available to a wider community, we need to ensure data governance and security.
- Ease of operations – Data engineering teams spend a lot of time doing infrastructure setting and management operations. With BigQuery, teams can put in more effort on building the data pipelines and models to feed into analytics instead of worrying about the infrastructure operations.
- Costs – Decoupling storage and compute allows for flexible pricing. A pay-as-you-go model is the ideal solution to managing costs.
Business Impact
The ingestion frequency of the store level inventory (~800 stores) has now been changed to daily. With the additional data volumes and processing the scaling on BigQuery has been seamless. There are new processes and dashboards to address the reconciliation and root cause analysis. Operational efficiencies have improved leading to better productivity and turn around time of critical processes.
The discrepancies in various reconciliation activities have drastically reduced by an order of magnitude of 300X due to the capabilities offered by the data platform. Not only is it possible to identify discrepancies but the data platform has also enabled in identifying the root causes for the same as well.
Arvind Fashions Ltd have also been able to enhance some of the existing business processes and systems with insight from the data platform.
It’s going to be an exciting journey for Arvind Fashions Ltd and Google Cloud. There are several initiatives ready for kick off such as getting more apps on the edge devices, warehouse analytics, advanced customer data platforms, predicting the lifecycle of designs, style codes and other exciting initiatives.
Rethinking time management: Helping employees manage their time efficiently

3585
Of your peers have already read this article.
3:30 Minutes
The most insightful time you'll spend today!
As business leaders evaluate their hybrid work models, employee productivity is top of mind. They’re trying to understand how to balance organizational needs for productivity with employee needs for autonomy, flexibility, and work/life balance. In my role as Google’s Productivity Advisor, I help organizations and employees realize that being productive means working smartly and efficiently — not overworking. And one key to productivity is developing strong time management skills.
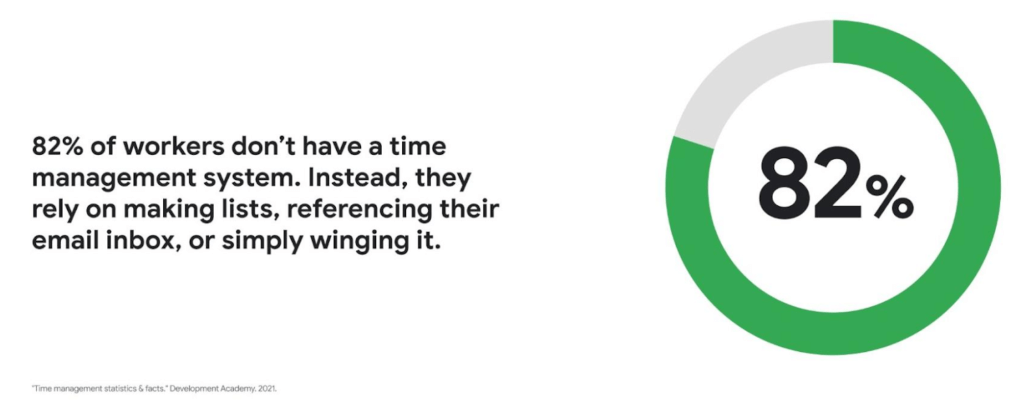
Recent research found that 82% of workers don’t have a proper time management system, however. Instead, they rely on making lists, referencing their inbox, or simply winging it. And the result is telling: 21% of people say “their work is never under control or only under control one day per week.”
Everyone works differently, and one of the best things about hybrid work is that it empowers people to work in their own way, at their own pace. However, if your employees are managing their time inefficiently over the long term, their risk of burnout increases — which can be bad news for employee wellbeing, morale and productivity.
In order for any hybrid work plan to be effective and your teams to be healthy, your employees need to build their time management muscle. You can help them do so with a three-step process:
- Understand how your employees are currently managing their time
- Encourage your employees to identify time management strengths and areas for improvement
- Empower your employees to maximize their time management practices
Step 1: Understanding your employees’ work habits
Before you can help your employees manage their time more effectively, you first need to understand how they spend it. To start, identify habits that might be preventing your employees from establishing productive workflows. For example, some employees might be working too much outside of business hours or spending the majority of their working hours in meetings.
While observation may help you glean some of this information, it’s best to go straight to the source. To find out if your employees feel they’re managing their time efficiently, simply ask them! You can distribute an anonymous questionnaire using a survey tool, like Google Forms, with questions like:
- Are you having trouble getting all your work done?
- Do you feel like you have enough independent working time?
- Do alerts and notifications interrupt or enhance your workflow?
- Which productivity and collaboration tools do you find the most and the least useful?
- How do you communicate best with your coworkers when working on- and off-site?
One major hurdle to effective time management can be too many meetings. To learn if meeting fatigue is plaguing your teams, include a survey question asking employees if they feel like they devote too much time to meetings. Help them get specific by encouraging them to use a tool like Time Insights. With this feature, employees can see exactly how much time they spend in meetings and how much focus time they schedule each week to accurately answer your survey.
Fielding an anonymous questionnaire is a great way to start your time management audit. The learnings that emerge can help you identify patterns in your workplace and among your teams — but they won’t reveal how individual employees work. For that, you’ll need to reach out to them directly.
Step 2: Identifying individual strengths to harness and areas for improvement
Once you have a general idea of how your team works, you can dig deeper into your individual employees’ time management methods and working styles. With this information, you can then help them identify the practices that work — and don’t work — for them.
Suggest to your employees that they spend a week observing their productivity patterns and time management methods. You might encourage people to look at:
- Their level of energy at different times during the day and/or on different days of the week
- The different types of work, such as strategic or administrative, they like doing and when
- How much time they spend doing work versus communicating about work
- How they feel during and after group meetings
- The amount of time they spend in deep-focus versus time spent switching among different tasks
If your organization uses digital timesheets, your employees can consult built-in, automatic time-tracking insights to see where they’re spending their time. Otherwise, you can easily create a custom time-tracking app using a no-code solution like AppSheet to help your employees measure the time they devote to their various responsibilities.
Once everyone has completed their weeklong study, set up dedicated meetings to review your employees’ observations with them individually. Armed with this new understanding, you and your employees can clarify when and how each person does their best work, identify areas for improvement, and start adjusting accordingly.
Step 3: Empowering your employees to flex their time management muscle
Now that you have clarity on how your employees spend their time, you can work with them to develop personal time management practices. To set them up for success, look for opportunities that take advantage of their strengths and offset their challenges — no matter how they like to work.
It’s important to remember there’s no one-size-fits-all solution to using time productively. Some workers love to tackle the most difficult tasks first thing in the morning; others feel more energized at the end of their day. Some people think best in conversation while others prefer to be alone with their thoughts. To help your employees develop time management practices that fit their working style, they need to feel empowered to decide how they can use their time and tools productively.
When it comes to time management, calendars are your best friend, so encourage your employees to take advantage of simple features. Google Calendar lets everyone see availability; by glancing at a shared calendar, coworkers will know when to reach out to someone (and when not to). You can also prompt your employees to block off quiet time during windows when they feel most productive, and use tools like Focus time to protect the time they need for heads-down work.
Email and chat are important, but they can also become a distraction if not used intentionally. Most people open email first thing in the morning, leave it open all day, and check it often. Instead, when you and your employees need to focus, try closing the email tab or using Gmail features to snooze and star emails to stay on task. The same approach applies to chat: check it strategically and turn off notifications when you need deep focus.
Finally, be intentional about building and maintaining trust with your teams as they develop new time management skills. If you decide to use Google Meet for regular check-ins, partner with your employees to develop meeting agendas directly inside Calendar invites to ensure your shared time will be used efficiently.
Valuing impact over output
Hybrid work offers an opportunity for business leaders to rethink their perspective on employee time management and what it means to be productive. Remember, the goal of building effective time management skills isn’t always to become more efficient so one can take on additional work. Often times, taking a step back helps us simplify how we work in order to deepen our impact. When you empower your employees to create a personal time management system, I think you’ll find they will be happier and healthier, with more to contribute to your organization.
Reference Guide to Get You Started with Development on GKE
5558
Of your peers have already read this article.
1:30 Minutes
The most insightful time you'll spend today!
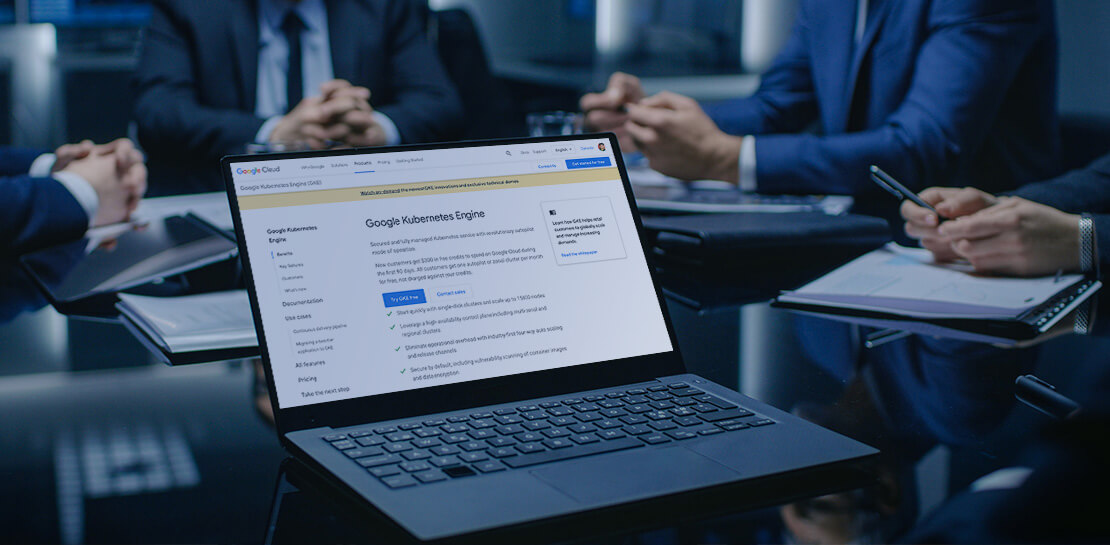
Getting started with Kubernetes is often harder than it needs to be. While working with a cluster “from scratch” can be a great learning exercise or a good solution for some highly specialized workloads, often the details of cluster management can be made easier by utilizing a managed service offering. Google Kubernetes Engine (GKE) allows for an easier end-to-end developer experience with convenient tooling and built-in integrations along with the convenience of offering Kubernetes clusters as a managed service.
GKE is the most mature container orchestration service available today, delivering a fully-managed service and hands-off experience with the GKE Autopilot mode of operation. GKE provides industry-first capabilities such as release channels, multi-cluster support, unique four-way auto scaling, node auto repair, and can support up to 15K nodes in a single cluster.
Our modern, end-to-end platform is built on cloud-native principles you are already familiar with and prioritizes speed, security, and flexibility, in ways that are highly differentiated from other cloud platforms.
We have put together a new reference guide for you as you begin your journey developing on GKE. It covers every step of your journey from writing, running, operating, to managing code. Even if it isn’t your first time using GKE, this e-book will be a valuable resource highlighting important considerations and best practices. By implementing the technical recommendations, following the steps, and utilizing the tools described, you can reach the following goals:
- Write, deploy, and debug code faster with Cloud Code and Cloud Shell
- Continuously integrate and deliver updates with Cloud Build
- Run easily, securly, cost effectively at scale with GKE
- Monitor and troubleshoot with Google Cloud’s operations suite
Kick-start your journey by downloading the e-book and join us live June 22 at 9am PDT for our half-day Cloud OnBoard event: Getting Started with Google Kubernetes Engine.
More Relevant Stories for Your Company

Enhancing SAP Build Process Automation with Google Document AI and Google Workspace
SAP Build Process Automation is designed to optimize business processes and boost efficiency. The platform helps both business users and developers alike digitize core workflows and incorporate artificial intelligence (AI) into time consuming and error-prone manual tasks. All digital paths can benefit from automation. The pandemic, supply chain shortages, and

There are 2 Key Traits You Need to Battle the Slowdown. FM Logistic Know How to Enable Them
FM Logistic provides its international customers with complete logistics solutions that cover everything from warehousing and handling, to transport and distribution, co-packing and co-manufacturing, and supply chain optimization. Operating in 14 countries including France, Russia, Poland, India, Vietnam, Brazil, and China, FM Logistic supports its clients by offering specialized services across

Business Messages drives 85% CSAT scores for Levi Strauss
Founded in 1853, clothing company Levi Strauss & Co. gained fame for their Levi’s® denim jeans. Over 150 years later, Levi’s is a globally-recognized brand that sells jeans and other apparel in more than 3,100 retail stores across 110 countries. The summary During the COVID-19 pandemic, Levi’s saw that their

TELUS and Google Cloud Partner to Move Towards a More Sustainable Future
Environmental sustainability is a key priority for TELUS, a world-leading communications technology company. It continues to rank in the top 100 most sustainably managed companies in the world, and seeks to make a healthier planet for all by leveraging its global-leading technology, compassion to drive social change and reduce our
