





Apigee and Vision API: ICICI Prudential Life Insurance’s Journey of Speeding Document Processing

5530
Of your peers have already read this article.
2:00 Minutes
The most insightful time you'll spend today!
Google Cloud results
- Helps enable instant document approval with optical character recognition by Vision API
- Processes 100,000 documents in 20 minutes with automated document processing product Recognic, powered by Vision API and Apigee
- Helps increase the number of applications processed by 30% within the same timeframe
The insurance landscape in India has seen significant changes in recent years with the adoption of new technology. As one of the major insurance providers in the country, ICICI Prudential Life Insurance has aimed to lead in this transformation journey. “There has been a data explosion across India over the past few years, together with a high mobile penetration rate. Today, about 60% of our customers approach us via mobile, for example, which was certainly not the case before,” says Alpesh Karnik, SVP, IT, at ICICI Life Insurance.
Consumer expectations have also evolved, with easier access to information and online services. “Consumers today are more informed on the importance of investing in insurance products, so there’s much more of a pull factor when it comes to sales, but they also want to be able to get these products quickly and easily,” adds Alpesh. To meet the demands of these consumers, ICICI Prudential Life Insurance realized it needed to make its processes even faster and more efficient. Looking to upgrade its infrastructure, the company turned to Google Cloud.
“The biggest benefit of using Recognic and Vision API is that it eliminates the initial waiting time, which can result in drop-offs. Now customers can know immediately whether their documents are sufficient, or if they need to revise or submit any others.”—Alpesh Karnik, SVP, IT, ICICI Prudential Life Insurance
Serving customers better by speeding up processes with Google Cloud
ICICI Prudential Life Insurance’s distributors were already using tablets to input customer data faster and more efficiently, but many of the company’s solutions still required a team at the back end to manually sift through documents for approval. This meant that customers needed to wait five or six hours, or sometimes until the next working day, to know if their documents were approved or needed revision.
That all changed after partnering with Google Cloud Premier Partner Searce to take advantage of its AI/ML powered automated document processing product Recognic, which is built on Google Cloud. Developed using the optical character recognition (OCR) capabilities of Cloud Vision, Recognic reads, understands, and validates documents at scale, enabling organizations that handle massive amounts of paperwork to digitize these documents and then accurately store and index them.
“Google Cloud has cut down the middle- and back-office work, leading to a 30% increase in the number of applications we can process in the same time span without the need for additional resources.”—Alpesh Karnik, SVP, IT, ICICI Prudential Life Insurance
“In the case of ICICI Prudential, the biggest benefit of using Recognic and Vision API is that it eliminates the initial waiting time, which can result in drop-offs. Now customers can know immediately whether their documents are sufficient, or if they need to revise or submit any others,” Alpesh adds.
Alpesh explains that if the details on the application form match the documents provided, the case doesn’t need to go to the underwriter for further checks and can go directly to policy issuance. “Google Cloud has cut down the middle- and back-office work, leading to a 30% increase in the number of applications we can process in the same time span without the need for additional resources.”
ICICI Prudential Life Insurance is also working with Searce to build deep learning models into Recognic so that it can overcome template barriers and input data from a variety of forms. This is particularly helpful for financial and medical documents underwriting because unlike a passport or driving license, financial documents have a higher structural complexity.
As customer data becomes more important in the work of ICICI Prudential Life Insurance, so does protecting it, and the company is taking every measure to safeguard the security and privacy of its customers’ information. “Details of customers’ contactability are automatically removed by Google Cloud after processing is complete. This step in the workflow gives us the confidence that data is not stored at any level of the optical character recognition process,” says Alpesh.
Partnering with the right teams for dedicated support
In achieving the best solution for its business goals, ICICI Prudential Life Insurance recognizes the importance of its decision to work with partners that truly understand the insurance business. “There are many intricacies involved in this business, and it’s clear that both Google Cloud and Searce really took the time to understand our underwriting processes before coming up with a solution,” says Alpesh. He adds that during the implementation process, all findings were well documented and queries were responded to quickly.
“We didn’t want to take any shortcuts deploying Recognic, but at the same time, we didn’t want to draw out the implementation process. The excellent support from both Google Cloud and Searce throughout the journey was reassuring for us as they were always thinking ahead.”
Future-proofing the organization through machine learning and AI
In the coming years, Alpesh foresees the insurance industry to be even more agile than it is today. “I doubt elaborate processes such as underwriting or operations checks will need to be done manually in the future. Everything will be done through machine learning and AI.” In light of this, ICICI Prudential Life Insurance is doing everything it can to prepare, as customers’ expectations are set to keep evolving. “We have to be prepared for the future, and I believe that with Google Cloud, we can do it.”

About ICICI Prudential Life Insurance
ICICI Prudential Life Insurance aims to lead the Indian insurance field through quality products and a hassle-free claim settlement experience. A customer-centric company, it offers long-term savings and protection plans to meet customers’ needs at every stage of life.Industries: Financial Services & InsuranceLocation: India

About Searce
Searce is a niche cloud consulting business with futuristic tech in its DNA, focused on “realizing the Next in the Now” for its clients. Specializing in cloud data engineering, AI/ML, and ad
Guide to Create and Manage Datasets with Vertex AI

3052
Of your peers have already read this article.
2:00 Minutes
The most insightful time you'll spend today!
At Google I/O this year, we introduced Vertex AI to bring together all our ML offerings into a single environment that lets you build and manage the lifecycle of ML projects. In a previous post, we gave you an overview of Vertex AI, sharing how it supports your entire ML workflow—from data management all the way to predictions. Today, we’ll talk a little about how to manage ML datasets with Vertex AI.
Many enterprises want to use data to make meaningful predictions that can bolster their business or help them venture into new markets. This often requires using custom machine learning models—something not every business knows how to create or use. This is where Vertex AI can help. Vertex AI provides tools for every step of the machine learning workflow—from managing data sets to different ways of training the model, evaluating, deploying, and making predictions. It also supports varying levels of ML expertise, so you don’t need to be an ML expert to use Vertex AI.https://www.youtube.com/embed/CN2X6oIlnmI?enablejsapi=1&
Types of data you can use in Vertex AI
Datasets are the first step of the machine learning lifecycle—to get started you need data, and lots of it. Vertex AI currently supports managed datasets for four data types—image, tabular, text, and videos.
Image
Image datasets let you do:
- Image classification—Identifying items within an image.
- Object detection—Identifying the location of an item in an image
- Image segmentation—Assigning labels to pixel level regions in an image.
To ensure your model performs well in production, use training images similar to what your users will send. For example, if users are likely to send low quality images, be sure to have blurry and low resolution images in your data set. Don’t forget to include different angles, backgrounds, and resolutions. We recommend you include at least 1,000 images per label (item you want to identify), but you can always get started with 10 per label. The more examples you provide, the better your model will be.
Tabular
Tabular datasets enable you to do:
- Regression—Predicting a numerical value.
- Classification—Predicting a category associated with a particular example.
- Forecasting—Predicting the likelihood of sudden events or demands.
Tabular data sets support hundreds of columns and millions of rows.
Text
With text datasets, you can do:
- Classification—Assigning one or more labels to an entire document.
- Entity extraction—Identifying custom text entities within a document, like “too expensive” or “great value”.
- Sentiment analysis—Identifying the overall sentiment expressed in a block of text, for example, if a customer was happy or upset or frustrated.
Video
Video datasets enable:
- Classification—Labeling entire videos, shots, or frames.
- Action recognition—Identifying clips video clips where specific actions occur.
- Object tracking—Tracking specific objects in a video.
Creating and managing datasets in Vertex AI
Now that we’ve covered the different types of data you can use, let’s shift to creating and managing those datasets. In the Cloud Console, go to Vertex AI dashboard page and click Datasets, then click Create Project.
Say you want to classify items within a set of photos. Create an image dataset and select image classification. You can import files directly from your computer, which will be stored in Cloud Storage. Then, you’ll need to add the corresponding labels (items you want to identify) for your images. If you already have labels, you can use the Import File option to import a CSV with your image URLs and their labels. If your data is not labeled and you would like human help to label it, you can use the Vertex AI data labeling service. Once the files are uploaded, you can create labels and assign them to the images. You can also analyze the images in the data set, the number of images per label, and a few other properties.
Depending on the type of data you use, your options might vary slightly. For example, if you want to use tabular data, you could upload a CSV file from your computer, use one from Cloud Storage, or select a table from BigQuery directly. Once you select the table, the data is available for analysis.
More to come
This concludes our overview of creating and managing datasets in Vertex AI. In a future installment, we’ll go over the next phase of the machine learning workflow: building and training ML models.
If you enjoyed this post, keep an eye out for more AI Simplified episodes on YouTube. In the meantime, here’s where you can learn more about Vertex AI.
3242
Of your peers have already watched this video.
38:09 Minutes
The most insightful time you'll spend today!
TensorFlow: The Show-and-Tell Data Scientists Have Been Asking For
TensorFlow is among the most popular, if not, the most popular deep learning libraries today. According to one ranking, “TensorFlow is at least two standard deviations above the mean on all calculated metrics.”
Watch as Lak Lakshmanan, Technical Lead, Machine Learning and Big Data, Google Cloud, walks through a development workflow that will make operationalization easier to execute, including the process of building a complete machine learning pipeline covering ingest, exploration, training, evaluation, deployment, and prediction.
He also talks about the need for distributed training. But what’s the benefit of distributed TensorFlow? Many machine learning frameworks can only handle “toy problems”, or problems that can be solved by input data that fits into memory. These are small data sets.
But to build effective machine learning you need big data, feature engineering, and model architectures. With large amounts of data batching and distribution are very important. That’s where distributed training comes in.
How Data Efficiency with Google Cloud Empower Governments to Make Data-first Decisions

5061
Of your peers have already read this article.
1:30 Minutes
The most insightful time you'll spend today!
Presently, every government agency has to take a hard look at their data capabilities and decide whether their current infrastructure supports their workflow. For many, it doesn’t. Most data systems are developed with a strict set of parameters in mind before implementation, which can limit flexibility and long-term use. Particularly during a crisis, flexible “living systems” offer tremendous advantages as they’re able to change capacity rapidly. Building living data systems with the cloud in mind allows organizations to respond to a changing world with confidence.
Last summer, the Government Business Council conducted a survey of government employees to understand the impacts of data efficiency on government operations. The report Built to Last: A Survey on Organizational Data Efficiency in Times of Crisis offers key insights into organizational efficacy and whether organizations can adapt to a crisis at speed. It also highlights differences between traditional data systems and living data systems.
Data needs to be readily available
When the pandemic first hit, many agencies needed to create or transition their systems to allow employees to work remotely. This change tested the limits of existing data systems. Even after finding a cloud service provider, agencies encountered the challenges of migrating their data to the cloud.
Government organizations had decades of data stored in paper records. Most have been working to transfer these records to a digital format, but the process has been slow. They are also faced with collecting sizable amounts of data in real time from their ongoing services, which involves interfacing with the public, external vendors, or third-party institutions.
Building the cloud into a flexible data system can solve both issues. Old records can be digitized and given an easy-to-access home for those who need them. Incoming data, both internal and external, can be made accessible as well. Migrating data to the cloud also doubles as a way to create backups of raw data, adding an extra layer of security. Most importantly, building in the cloud unlocked the capacity to scale when demand rises.
Data should be updated in real-time
One of the key takeaways from the Government Business Council report is the fact that agencies are better able to adapt at speed when data efficiencies are higher. 74% of organizations with pandemic related functions reported a moderate to severe impact to their jobs at the onset of the pandemic. Of those organizations, the ones reporting their data efficiency as “very good” have largely already recovered. That adaptability directly affects an agency’s ability to make informed decisions during a time of a crisis.
Having a real-time data solution in place lets agencies make near real-time decisions. A great example of this from early in the pandemic is vaccine distribution. Google Cloud supported multiple states, such as the State of Wyoming, in distributing vaccines efficiently while handling challenges such as reaching rural populations. Data systems that gathered real-time patient data made a difference in the number of vaccines distributed. Knowing population data and patient risk factors enabled quick and effective decision-making.
A global pandemic is far from the only crisis that needs effective data analytics. Natural disasters, food deserts, public health issues, and more can all be handled more efficiently by having real-time data at hand. Effective data analytics systems are the digital equal of “having your ear to the ground” in each community. They provide valuable insights into what people need.
Data needs to be accessible and easy to use
Making data easy to work with and understand sets phenomenal data systems apart from functional ones. Having data in the cloud is a great first step, but agencies need to be able to easily access and quickly use the data to accomplish their goals. This is where traditional data systems fail most often. Traditional IT systems and data strategies are designed for a specific purpose, usually identified before development and implementation begin. That means that when the data living in those systems needs to be used differently, adapting to new requirements can be difficult.
Data can often feel “locked” in traditional systems; the data is there, but there’s no way to get to it or work with it in a way that meets the needs of a crisis. Flexible data systems address this by allowing for greater accessibility. Google Cloud, for example, has customizable tools, such as Contact Center AI and Document AI, which let agencies work with data in ever-changing ways. This also produces greater data transparency since data sets can be worked with and accessed more easily.
Governments need to respond to the changing needs of their constituents in emergencies. While traditional data systems can handle slowly shifting demands on the system, they do not serve agencies well in a crisis. When urgency, accuracy, and accessibility all matter, flexible systems rise to the challenge. The pandemic has pushed agencies to adapt in real time, and many have realized they need a system that adapts with them.
Google Cloud has a suite of tools to create integrated data ecosystems. These ecosystems can scale with increasing demand, meet dynamic development needs, and adapt to a changing landscape. Data-first decision-making is a core tenet of “living data systems.” Google Cloud data systems have handled everything from administering vaccines to detecting fraud. In each of these applications, a core tenet of data-first decision making was implemented at scale.
For more insights on how flexible data systems help the public sector, download the full report “Built to Last: A Survey on Organizational Data Efficiency in Times of Crisis.”
Apigee and Vision API: ICICI Prudential Life Insurance’s Journey of Speeding Document Processing
5531
Of your peers have already read this article.
2:00 Minutes
The most insightful time you'll spend today!
Google Cloud results
- Helps enable instant document approval with optical character recognition by Vision API
- Processes 100,000 documents in 20 minutes with automated document processing product Recognic, powered by Vision API and Apigee
- Helps increase the number of applications processed by 30% within the same timeframe
The insurance landscape in India has seen significant changes in recent years with the adoption of new technology. As one of the major insurance providers in the country, ICICI Prudential Life Insurance has aimed to lead in this transformation journey. “There has been a data explosion across India over the past few years, together with a high mobile penetration rate. Today, about 60% of our customers approach us via mobile, for example, which was certainly not the case before,” says Alpesh Karnik, SVP, IT, at ICICI Life Insurance.
Consumer expectations have also evolved, with easier access to information and online services. “Consumers today are more informed on the importance of investing in insurance products, so there’s much more of a pull factor when it comes to sales, but they also want to be able to get these products quickly and easily,” adds Alpesh. To meet the demands of these consumers, ICICI Prudential Life Insurance realized it needed to make its processes even faster and more efficient. Looking to upgrade its infrastructure, the company turned to Google Cloud.
“The biggest benefit of using Recognic and Vision API is that it eliminates the initial waiting time, which can result in drop-offs. Now customers can know immediately whether their documents are sufficient, or if they need to revise or submit any others.”—Alpesh Karnik, SVP, IT, ICICI Prudential Life Insurance
Serving customers better by speeding up processes with Google Cloud
ICICI Prudential Life Insurance’s distributors were already using tablets to input customer data faster and more efficiently, but many of the company’s solutions still required a team at the back end to manually sift through documents for approval. This meant that customers needed to wait five or six hours, or sometimes until the next working day, to know if their documents were approved or needed revision.
That all changed after partnering with Google Cloud Premier Partner Searce to take advantage of its AI/ML powered automated document processing product Recognic, which is built on Google Cloud. Developed using the optical character recognition (OCR) capabilities of Cloud Vision, Recognic reads, understands, and validates documents at scale, enabling organizations that handle massive amounts of paperwork to digitize these documents and then accurately store and index them.
“Google Cloud has cut down the middle- and back-office work, leading to a 30% increase in the number of applications we can process in the same time span without the need for additional resources.”—Alpesh Karnik, SVP, IT, ICICI Prudential Life Insurance
“In the case of ICICI Prudential, the biggest benefit of using Recognic and Vision API is that it eliminates the initial waiting time, which can result in drop-offs. Now customers can know immediately whether their documents are sufficient, or if they need to revise or submit any others,” Alpesh adds.
Alpesh explains that if the details on the application form match the documents provided, the case doesn’t need to go to the underwriter for further checks and can go directly to policy issuance. “Google Cloud has cut down the middle- and back-office work, leading to a 30% increase in the number of applications we can process in the same time span without the need for additional resources.”
ICICI Prudential Life Insurance is also working with Searce to build deep learning models into Recognic so that it can overcome template barriers and input data from a variety of forms. This is particularly helpful for financial and medical documents underwriting because unlike a passport or driving license, financial documents have a higher structural complexity.
As customer data becomes more important in the work of ICICI Prudential Life Insurance, so does protecting it, and the company is taking every measure to safeguard the security and privacy of its customers’ information. “Details of customers’ contactability are automatically removed by Google Cloud after processing is complete. This step in the workflow gives us the confidence that data is not stored at any level of the optical character recognition process,” says Alpesh.
Partnering with the right teams for dedicated support
In achieving the best solution for its business goals, ICICI Prudential Life Insurance recognizes the importance of its decision to work with partners that truly understand the insurance business. “There are many intricacies involved in this business, and it’s clear that both Google Cloud and Searce really took the time to understand our underwriting processes before coming up with a solution,” says Alpesh. He adds that during the implementation process, all findings were well documented and queries were responded to quickly.
“We didn’t want to take any shortcuts deploying Recognic, but at the same time, we didn’t want to draw out the implementation process. The excellent support from both Google Cloud and Searce throughout the journey was reassuring for us as they were always thinking ahead.”
Future-proofing the organization through machine learning and AI
In the coming years, Alpesh foresees the insurance industry to be even more agile than it is today. “I doubt elaborate processes such as underwriting or operations checks will need to be done manually in the future. Everything will be done through machine learning and AI.” In light of this, ICICI Prudential Life Insurance is doing everything it can to prepare, as customers’ expectations are set to keep evolving. “We have to be prepared for the future, and I believe that with Google Cloud, we can do it.”
About ICICI Prudential Life Insurance
ICICI Prudential Life Insurance aims to lead the Indian insurance field through quality products and a hassle-free claim settlement experience. A customer-centric company, it offers long-term savings and protection plans to meet customers’ needs at every stage of life.Industries: Financial Services & InsuranceLocation: India
About Searce
Searce is a niche cloud consulting business with futuristic tech in its DNA, focused on “realizing the Next in the Now” for its clients. Specializing in cloud data engineering, AI/ML, and ad
10161
Of your peers have already watched this video.
1:00 Minutes
The most insightful time you'll spend today!
Predict User Churn on Gaming Apps with Google Analytics Data using BigQuery ML
User retention can be a major challenge for mobile game developers. According to the Mobile Gaming Industry Analysis in 2019, most mobile games only see a 25% retention rate for users after the first day. To retain a larger percentage of users after their first use of an app, developers can take steps to motivate and incentivize certain users to return. But to do so, developers need to identify the propensity of any specific user returning after the first 24 hours.
In this blog post, we will discuss how you can use BigQuery ML to run propensity models on Google Analytics 4 data from your gaming app to determine the likelihood of specific users returning to your app.
You can also use the same end-to-end solution approach in other types of apps using Google Analytics for Firebase as well as apps and websites using Google Analytics 4. To try out the steps in this blogpost or to implement the solution for your own data, you can use this Jupyter Notebook.
Using this blog post and the accompanying Jupyter Notebook, you’ll learn how to:
- Explore the BigQuery export dataset for Google Analytics 4
- Prepare the training data using demographic and behavioural attributes
- Train propensity models using BigQuery ML
- Evaluate BigQuery ML models
- Make predictions using the BigQuery ML models
- Implement model insights in practical implementations
Google Analytics 4 (GA4) properties unify app and website measurement on a single platform and are now default in Google Analytics. Any business that wants to measure their website, app, or both, can use GA4 for a more complete view of how customers engage with their business. With the launch of Google Analytics 4, BigQuery export of Google Analytics data is now available to all users. If you are already using a Google Analytics 4 property, you can follow this guide to set up exporting your GA data to BigQuery.
Once you have set up the BigQuery export, you can explore the data in BigQuery. Google Analytics 4 uses an event-based measurement model. Each row in the data is an event with additional parameters and properties. The Schema for BigQuery Export can help you to understand the structure of the data.
In this blogpost, we use the public sample export data from an actual mobile game app called “Flood It!” (Android, iOS) to build a churn prediction model. But you can use data from your own app or website.
Here’s what the data looks like. Each row in the dataset is a unique event, which can contain nested fields for event parameters.
SELECT *FROM `firebase-public-project.analytics_153293282.events_*`TABLESAMPLE SYSTEM (1 PERCENT)

This dataset contains 5.7M events from over 15k users.
SELECTCOUNT(DISTINCT user_pseudo_id) as count_distinct_users,COUNT(event_timestamp) as count_eventsFROM`firebase-public-project.analytics_153293282.events_*

Our goal is to use BigQuery ML on the sample app dataset to predict propensity to user churn or not churn based on users’ demographics and activities within the first 24 hours of app installation.

In the following sections, we’ll cover how to:
- Pre-process the raw event data from GA4
- Identify users & the label feature
- Process demographic features
- Process behavioral features
- Train classification model using BigQuery ML
- Evaluate the model using BigQueryML
- Make predictions using BigQuery ML
- Utilize predictions for activation
Pre-process the raw event data
You cannot simply use raw event data to train a machine learning model as it would not be in the right shape and format to use as training data. So in this section, we’ll go through how to pre-process the raw data into an appropriate format to use as training data for classification models.
This is what the training data should look like for our use case at the end of this section:

Notice that in this training data, each row represents a unique user with a distinct user ID (user_pseudo_id).
Identify users & the label feature
We first filtered the dataset to remove users who were unlikely to return the app anyway. We defined these ‘bounced’ users as ones who spent less than 10 mins with the app. Then we labeled all remaining users:
- churned: No event data for the user after 24 hours of first engaging with the app.
- returned: The user has at least one event record after 24 hours of first engaging with the app.
For your use case, you can have a different definition of bounce and churning. Also you can even try to predict something else other than churning, e.g.:
- whether a user is likely to spend money on in-game currency
- likelihood of completing n-number of game levels
- likelihood of spending n amount of time in-game etc.
In such cases, label each record accordingly so that whatever you are trying to predict can be identified from the label column.
From our dataset, we found that ~41% users (5,557) bounced. However, from the remaining users (8,031), ~23% (1,883) churned after 24 hours:
SELECTbounced,churned,COUNT(churned) as count_usersFROMbqmlga4.returningusersGROUP BY 1,2ORDER BY bounced

To create these bounced and churned columns, we used the following snippet of SQL code.
...#churned = 1 if last_touch within 24 hr of app installation, else 0IF (user_last_engagement < TIMESTAMP_ADD(user_first_engagement,INTERVAL 24 HOUR),1,0 ) AS churned,#bounced = 1 if last_touch within 10 min, else 0IF (user_last_engagement <= TIMESTAMP_ADD(user_first_engagement,INTERVAL 10 MINUTE),1,0 ) AS bounced,...
You can view the Jupyter Notebook for the full query used for materializing the bounced and churned labels.
Process demographic features
Next, we added features both for demographic data and for behavioral data spanning across multiple columns. Having a combination of both demographic data and behavioral data helps to create a more predictive model.
We used the following fields for each user as demographic features:
geo.countrydevice.operating_systemdevice.language
A user might have multiple unique values in these fields — for example if a user uses the app from two different devices. To simplify, we used the values from the very first user engagement event.
CREATE OR REPLACE VIEW bqmlga4.user_demographics AS (WITH first_values AS (SELECTuser_pseudo_id,geo.country as country,device.operating_system as operating_system,device.language as language,ROW_NUMBER() OVER (PARTITION BY user_pseudo_id ORDER BY event_timestamp DESC) AS row_numFROM `firebase-public-project.analytics_153293282.events_*`WHERE event_name="user_engagement")SELECT * EXCEPT (row_num)FROM first_valuesWHERE row_num = 1 #first engagement);
Process behavioral features
There is additional demographic information present in the GA4 export dataset, e.g. app_info, device, event_params, geo etc. You may also send demographic information to Google Analytics through each hit via user_properties. Furthermore, if you have first-party data on your own system, you can join that with the GA4 export data based on user_ids.
To extract user behavior from the data, we looked into the user’s activities within the first 24 hours of first user engagement. In addition to the events automatically collected by Google Analytics, there are also the recommended events for games that can be explored to analyze user behavior. For our use case, to predict user churn, we counted the number of times the follow events were collected for a user within 24 hours of first user engagement:
user_engagementlevel_start_quickplaylevel_end_quickplaylevel_complete_quickplaylevel_reset_quickplaypost_scorespend_virtual_currencyad_rewardchallenge_a_friendcompleted_5_levelsuse_extra_steps
The following query shows how these features were calculated:
WITHevents_first24hr AS (SELECTe.*FROM`firebase-public-project.analytics_153293282.events_*` eJOINbqmlga4.returningusers rONe.user_pseudo_id = r.user_pseudo_idWHERETIMESTAMP_MICROS(e.event_timestamp) <= r.ts_24hr_after_first_engagement)SELECTuser_pseudo_id,SUM(IF(event_name = 'user_engagement', 1, 0)) AS cnt_user_engagement,# ... repeated for all behavior data ...SUM(IF(event_name = 'use_extra_steps', 1, 0)) AS cnt_use_extra_steps,FROMevents_first24hrGROUP BY1
View the notebook for the query used to aggregate and extract the behavioral data. You can use different sets of events for your use case. To view the complete list of events, use the following query:
SELECTevent_name,COUNT(event_name) as event_countFROM`firebase-public-project.analytics_153293282.events_*`GROUP BY 1ORDER BYevent_count DESC
After this we combined the features to ensure our training dataset reflects the intended structure. We had the following columns in our table:
- User ID:
user_pseudo_id
- Label:
churned
- Demographic features
countrydevice_osdevice_language
- Behavioral features
cnt_user_engagementcnt_level_start_quickplaycnt_level_end_quickplaycnt_level_complete_quickplaycnt_level_reset_quickplaycnt_post_scorecnt_spend_virtual_currencycnt_ad_rewardcnt_challenge_a_friendcnt_completed_5_levelscnt_use_extra_stepsuser_first_engagement
At this point, the dataset was ready to train the classification machine learning model in BigQuery ML. Once trained, the model will output a propensity score between churn (churned=1) or return (churned=0) indicating the probability of a user churning based on the training data.
Train classification model
When using the CREATE MODEL statement, BigQuery ML automatically splits the data between training and test. Thus the model can be evaluated immediately after training (see the documentation for more information).
For the ML model, we can choose among the following classification algorithms where each type has its own pros and cons:

Often logistic regression is used as a starting point because it is the fastest to train. The query below shows how we trained the logistic regression classification models in BigQuery ML.
CREATE OR REPLACE MODEL bqmlga4.churn_logregTRANSFORM(EXTRACT(MONTH from user_first_engagement) as month,EXTRACT(DAYOFYEAR from user_first_engagement) as julianday,EXTRACT(DAYOFWEEK from user_first_engagement) as dayofweek,EXTRACT(HOUR from user_first_engagement) as hour,* EXCEPT(user_first_engagement, user_pseudo_id))OPTIONS(MODEL_TYPE="LOGISTIC_REG",INPUT_LABEL_COLS=["churned"]) ASSELECT*FROMbqmlga4.train
We extracted month, julianday, and dayofweek from datetimes/timestamps as one simple example of additional feature preprocessing before training. Using TRANSFORM() in your CREATE MODEL query allows the model to remember the extracted values. Thus, when making predictions using the model later on, these values won’t have to be extracted again. View the notebook for the example queries to train other types of models (XGBoost, deep neural network, AutoML Tables).
Evaluate model
Once the model finished training, we ran ML.EVALUATE to generate precision, recall, accuracy and f1_score for the model:
SELECT*FROMML.EVALUATE(MODEL bqmlga4.churn_logreg)

The optional THRESHOLD parameter can be used to modify the default classification threshold of 0.5. For more information on these metrics, you can read through the definitions on precision and recall, accuracy, f1-score, log_loss and roc_auc. Comparing the resulting evaluation metrics can help to decide among multiple models.Furthermore, we used a confusion matrix to inspect how well the model predicted the labels, compared to the actual labels. The confusion matrix is created using the default threshold of 0.5, which you may want to adjust to optimize for recall, precision, or a balance (more information here).
SELECTexpected_label,_0 AS predicted_0,_1 AS predicted_1FROMML.CONFUSION_MATRIX(MODEL bqmlga4.churn_logreg)

This table can be interpreted in the following way:

Make predictions using BigQuery ML
Once the ideal model was available, we ran ML.PREDICT to make predictions. For propensity modeling, the most important output is the probability of a behavior occurring. The following query returns the probability that the user will return after 24 hrs. The higher the probability and closer it is to 1, the more likely the user is predicted to return, and the closer it is to 0, the more likely the user is predicted to churn.
SELECTuser_pseudo_id,returned,predicted_returned,predicted_returned_probs[OFFSET(0)].prob as probability_returnedFROMML.PREDICT(MODEL bqmlga4.churn_logreg,(SELECT * FROM bqmlga4.train)) #can be replaced with a proper test dataset
Utilize predictions for activation
Once the model predictions are available for your users, you can activate this insight in different ways. In our analysis, we used user_pseudo_id as the user identifier. However, ideally, your app should send back the user_id from your app to Google Analytics. In addition to using first-party data for model predictions, this will also let you join back the predictions from the model into your own data.
- You can import the model predictions back into Google Analytics as a user attribute. This can be done using the Data Import feature for Google Analytics 4. Based on the prediction values you can Create and edit audiences and also do Audience targeting. For example, an audience can be users with prediction probability between 0.4 and 0.7, to represent users who are predicted to be “on the fence” between churning and returning.
- For Firebase Apps, you can use the Import segments feature. You can tailor user experience by targeting your identified users through Firebase services such as Remote Config, Cloud Messaging, and In-App Messaging. This will involve importing the segment data from BigQuery into Firebase. After that you can send notifications to the users, configure the app for them, or follow the user journeys across devices.
- Run targeted marketing campaigns via CRMs like Salesforce, e.g. send out reminder emails.
You can find all of the code used in this blogpost in the Github repository:
What’s next?
Continuous model evaluation and re-training
As you collect more data from your users, you may want to regularly evaluate your model on fresh data and re-train the model if you notice that the model quality is decaying.
Continuous evaluation—the process of ensuring a production machine learning model is still performing well on new data—is an essential part in any ML workflow. Performing continuous evaluation can help you catch model drift, a phenomenon that occurs when the data used to train your model no longer reflects the current environment.
To learn more about how to do continuous model evaluation and re-train models, you can read the blogpost: Continuous model evaluation with BigQuery ML, Stored Procedures, and Cloud Scheduler
More resources
If you’d like to learn more about any of the topics covered in this post, check out these resources:
- BigQuery export of Google Analytics data
- BigQuery ML quickstart
- Events automatically collected by Google Analytics 4
- Qwiklabs: Create ML models with BigQuery ML
Or learn more about how you can use BigQuery ML to easily build other machine learning solutions:
- How to build demand forecasting models with BigQuery ML
- How to build a recommendation system on e-commerce data using BigQuery ML
Let us know what you thought of this post, and if you have topics you’d like to see covered in the future! You can find us on Twitter at @polonglin and @_mkazi_.Thanks to reviewers: Abhishek Kashyap, Breen Baker, David Sabater Dinter.
More Relevant Stories for Your Company

How 20th Century Fox Uses Machine Learning to Gauge the Financial Performance of a Movie
Success in the movie industry relies on a studio’s ability to attract moviegoers—but that’s sometimes easier said than done. Moviegoers are a diverse group, with a wide variety of interests and preferences. Historically, movie studios have relied heavily on experience when deciding to invest in a particular script—but this can


How Google’s Customer Data Platform Helps Retail Brands Offer Data-driven , Personalized CX
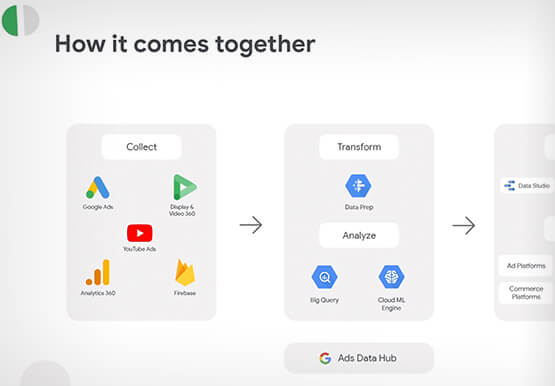
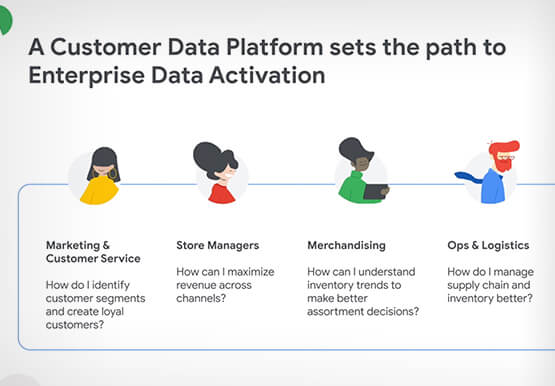
Retail companies need customer insights to deliver personalized experiences that impact revenue generation and cost savings. Watch how Google Cloud's customer data platform helps brands integrate and build holistic view of data in silos to drive marketing and customer service success.


An Indian Example of How to Really Up Your Customer Experience Game and Increase Conversion Rates With AI
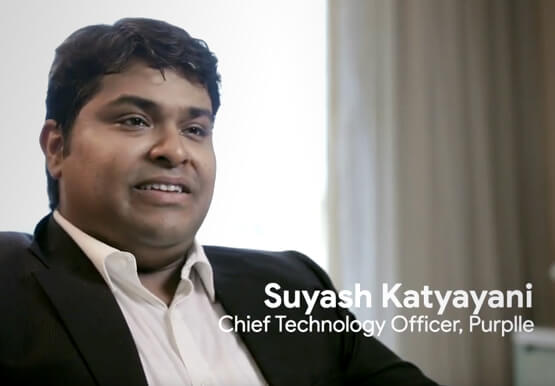
How about selfie analysis of users to recommend them the right lipstick color? That’s just one of the many ideas folks at Purplle.com came up with to improve the buying experience of Indian consumers. And without the power of Google Cloud, it would probably have remained just that…an idea. But

Telegraph Media Group Creates More Marketing Opportunities With Google Cloud Platform
London-based Telegraph Media Group is a multimedia news publisher with titles including The Daily Telegraph, The Sunday Telegraph, The Telegraph website and The Telegraph digital edition. The Daily Telegraph is the UK’s best-selling quality daily newspaper with a long-established history of over 160 years and is unique in having maintained
