





redBus: Mastering Big Data with Google BigQuery

5383
Of your peers have already read this article.
2:30 Minutes
The most insightful time you'll spend today!
In 2006, online travel agency redBus introduced internet bus ticketing in India, unifying tens of thousands of bus schedules into a single booking operation. (Think of it as Expedia for bus booking.) Using BigQuery, redBus crunches terabytes of booking and inventory data in mere seconds and at a fraction of the cost of other big data services. BigQuery also helps engineers fix glitches quickly, minimize lost sales, and improve customer service.
Challenge
Executives at the Bangalore-based redBus needed a powerful tool to analyze booking and inventory data across their system of hundreds of bus operators serving more than 10,000 routes. They considered using clusters of Hadoop servers to process the data but decided the system would take too much time to set up and would require a specialized staff to maintain it. It also would not provide the lightning-fast analysis they needed.
“It would have taken at least a couple of hours to analyze anything,” says Pradeep Kumar, a technical architect at redBus. “Crunching very large data sets would have been a day’s job. We needed something more powerful to get the real-time analysis we were looking for.”
Solution
Kumar and his colleagues learned about BigQuery and realized it was the right match for their data processing needs. The web-based service, which enables companies to analyze massive datasets using Google’s data processing infrastructure, is easy to set up and manage since its simple, SQL-like query language doesn’t require complex technology or specialized personnel. It also has low overhead costs.
The redBus team uses BigQuery as part of an intricate data collection and analysis process. Applications hosted on a range of servers continually pump information related to customer searches, seat inventory, and bookings into a centralized data collection system. Engineers upload the data to BigQuery, which provides answers to complex queries within seconds. For example, BigQuery helps redBus staff:
- Learn how many times customers searched for seats and found none or very few available, indicating more seats should be added to a route
- Investigate decreases in bookings and notify engineers if a technical problem is the cause
- Identify server problems by quickly analyzing data related to server activity
Results
BigQuery provides near real-time data analysis capabilities at 20% of the cost of maintaining a complex Hadoop infrastructure. Queries that would have required a day to analyze on a Hadoop framework take less than 30 seconds using Google’s web-based service.
“We explored several data analytics solutions. Nothing comes remotely close to the sheer power of Google BigQuery,” Kumar says. “It made large-scale data collection and crunching possible with little effort, which has translated to a significant business advantage.”
Google Cloud Platform results
- Analyzes data sets as large as 2 terabytes in less than 30 seconds using a simple, SQL-like language
- Saves time analyzing technical problems and customer booking trends
- Spends 80% less than they would have on a Hadoop infrastructure and avoids setting up and maintaining a complex infrastructure in-house
- Strengthens the company by improving customer service and engineering quality
The fast insights gained through BigQuery are also making redBus a stronger company. By minimizing the time it takes staff members to solve technical problems, BigQuery has helped improve customer service and reduce lost sales.
“Getting to the root of problems used to be really time-consuming,” Kumar says. “By the time we figured it out, customers might have given up. Now if there are booking problems, BigQuery helps us understand the reason right away. Choosing Google BigQuery was the right decision for our company.”
Geospatial Data for Business Apps Drive Sustainable and Accurate Decision-making

4351
Of your peers have already read this article.
1:30 Minutes
The most insightful time you'll spend today!
Organizations that collect geospatial data can use that information to understand their operations, help make better business decisions, and power innovation. Traditionally, organizations have required deep GIS expertise and tooling in order to deliver geospatial insights. In this post, we outline some ways that geospatial data can be used in various business applications.
Assessing environmental risk
Governments and businesses involved in insurance underwriting, property management, agriculture technology, and related areas are increasingly concerned with risks posed by environmental conditions. Historical models that predict natural disasters like pollution, flooding, and wildfires are becoming less accurate as real-world conditions change. Therefore, organizations are incorporating real-time and historical data into a geospatial analytics platform and using predictive modeling to more effectively plan for risk and to forecast weather.
Selecting sites and planning expansion
Businesses that have storefronts, such as retailers and restaurants, can find the best locations for their stores by using geospatial data like population density to simulate new locations and to predict financial outcomes. Telecom providers can use geospatial data in a similar way to determine the optimal locations for cell towers. A site selection solution can combine proprietary site metrics with publicly-available data like traffic patterns and geographic mobility to help organizations make better decisions about site selection, site rationalization, and expansion strategy.
Planning logistics and transport
For freight companies, courier services, ride-hailing services, and other companies that manage fleets, it’s critical to incorporate geospatial context into business decision-making. Fleet management operations include optimizing last-mile logistics, analyzing telematics data from vehicles for self-driving cars, managing precision railroading, and improving mobility planning. Managing all of these operations relies extensively on geospatial context. Organizations can create a digital twin of their supply chain that includes geospatial data to mitigate supply chain risk, design for sustainability, and minimize their carbon footprint.
Understanding and improving soil health and yield
AgTech companies and other organizations that practice precision agriculture can use a scalable analytics platform to analyze millions of acres of land. These insights help organizations understand soil characteristics and help them analyze the interactions among variables that affect crop production. Companies can load topography data, climate data, soil biomass data, and other contextual data from public data sources. They can then combine this information with data about local conditions to make better planting and land-management decisions. Mapping this information using geospatial analytics not only lets organizations actively monitor crop health and manage crops, but it can help farmers determine the most suitable land for a given crop and to assess risk from weather conditions.
Managing sustainable development
Geospatial data can help organizations map economic, environmental, and social conditions to better understand the geographies in which they conduct business. By taking into account environmental and socio-economic phenomena like poverty, pollution, and vulnerable populations, organizations can determine focus areas for protecting and preserving the environment, such as reducing deforestation and soil erosion. Similarly, geospatial data can help organizations design data-driven health and safety interventions. Geospatial analytics can also help an organization meet its commitments to sustainability standards through sustainable and ethical sourcing. Using geospatial analytics, organizations can track, monitor, and optimize the end-to-end supply chain from the source of raw materials to the destination of the final product.
What’s next
Google Cloud provides a full suite of geospatial analytics and machine learning capabilities that can help you make more accurate and sustainable business decisions without the complexity and expense of managing traditional GIS infrastructure. Get started today by learning how you can use Google Cloud features to get insights from your geospatial data, see Geospatial analytics architecture.
Acknowledgements: We’d like to thank Chad Jennings, Lak Lakshmanan, Kannappan Sirchabesan, Mike Pope, and Michael Hao for their contributions to this blog post and the Geospatial Analytics architecture.
Google Cloud Celebrates Journey of 3 Inspiring Founders for the Asian Pacific American Heritage Month

8134
Of your peers have already read this article.
1:30 Minutes
The most insightful time you'll spend today!
May is Asian Pacific American Heritage Month —a time for us to come together to celebrate and remember the important people and history of Asian and Pacific Island heritage. This feature highlights three AAPI founders from the Google For Startups community.
Read on to learn how these three founders built their businesses, leverage Google tech, and suggestion they have for aspiring entrepreneurs.

CultivatePeople
Founder: Lola Han
Description: CultivatePeople’s compensation software, Kamsa, provides global market pay rate data and helps companies make data-driven salary decisions so they can attract and retain their most valuable asset: employees.
Why GCP: “CultivatePeople began using GCP when integrating SSO/SAML authentication after our SaaS product became a high priority. We were able to exceed our clients’ expectations and increase their level of trust in our platform’s capabilities. We’re currently investigating additional machine learning products, such as Cloud AutoML, that will allow us to quickly deliver exciting features.”
Note from the Founder: “I grew up with immigrant parents who value stability and are risk-averse. My parents discouraged me from starting my own company because they didn’t want to see me struggle financially or see my health suffer (due to stress). I felt strongly about what CultivatePeople could do, so I started the company as a sole founder in 2017 and watched it double in size year over year since. While the ones I love most may not have cheered me on initially, it was important for me to hang on to the encouraging words of former bosses, executives, and founders to keep me focused on my mission.
My advice for other AAPI founders is to be a “silent assassin” and believe in the mission and values of your organization. Always remember to stop along the way and:
1) Enjoy the journey by celebrating wins and giving yourself credit;
2) Follow your intuition—it’s (almost) always right;
3) Recognize and invest in your people regularly (ie. give increases more than once a year, if warranted);
4) Give regular words of affirmation to employees on even small achievements.”

Swit
Founder: Josh Lee and Max Lim
Description: Swit is a team collaboration platform that seamlessly combines team chat with task management by allowing teams to turn their conversations into trackable tasks and share tasks to chat with simple drag-and-drop functionality, ensuring everyone is on the same page and projects get done faster.
Why GCP: “Swit is a cross-category hybrid work tool for chat and tasks. This functionality requires more complicated and heavier architecture for performance. So, configuring and managing virtual machines was really challenging to scale up our systems, while handling occasional unexpected traffic surges and frequent updates. Eventually we divided our monolithic architecture into 35 microservices when we launched our official product. The migration to GKE took around one month, and it turned out to be well worth the effort—our systems became able to offer high scalability and enough resilience to keep its uptime no matter what happened. Now we’re operating 84 workloads and 252 microservices with high stability with remarkably low downtime – less than 0.00001%/year.”
Note from the Founder: “As an AAPI founder based in Silicon Valley, I feel proud of the work ethics and diligence fellow Korean American entrepreneurs and professionals have long demonstrated here. Especially with K-pop breaking into the mainstream, I feel even more proud of our culture that strives toward an absolute perfection molded through years of training and dedication. The mission-driven culture of Silicon Valley coupled with Google’s edging technology and creativity really helped us build a product that not only encompasses verticals but also transcends cultures. Swit is growing at an unprecedented rate, and we hope to join the long list of successful AAPI entrepreneurs here. Swit’s close network with the AAPI community wouldn’t have been possible without Google support. We are grateful for this collaborative environment, and we hope to become the next-generation ambassador for collaboration after Google.”
Check out more from Swit in their founder story.

WISY
Founder: Min Chen
Description: Wisy develops technology to bring digital efficiency into the physical world, supporting consumer products businesses and making them thrive in the new economy. All of us have a bad experience when we can’t find the product we want to buy. That is a $1.9T problem in the consumer-packaged goods industry that Wisy is solving with AI and analytics to help manufacturers and retailers sell more by reducing out-of-stocks and waste at a global scale.
Why GCP: “GCP has an intuitive, easy to use interface, was lower cost, and offered preemptible instances with flexible compute options. Some of the reasons why Wisy decided to use GCP include instance and payment configurability, privacy and traffic security, cost-efficiency, and Machine Learning.
Wisy has been able to advance quickly with product development, as well as collaborate better and iterate faster in the creation of our AI models, while reducing costs by 40%. At Wisy, we are solving a problem that affects everyone who shops at a store.“
Note from the Founder: “Two years ago, I moved to San Francisco to expand my second startup, Wisy. This is when I learned that my name ‘Min’ stands for ‘minority.’ I was born in China, raised in a Black community in Panama, received scholarships to attend both Carnegie Mellon and UC Berkeley. I worked for 20 years in several countries, but I have never felt so discriminated against due to my race, ethnicity, gender and age than during my time in Silicon Valley. However, this is also the place I learned that my diverse life experience is my competitive advantage. My background enables me to recruit and relate to people in different countries, create scalable and flexible products for multinational customers, and run global operations efficiently.
My recommendation to AAPI founders is to find strength in their multicultural background. Don’t hide what makes you unique, do not limit yourselves, and do not let others limit you. You will lose your edge when trading authenticity for validation. Be proud and own your story.”
If you want to learn more about how Google Cloud can help your startup, visit our Startup Program application page here and sign up for our monthly startup newsletter to get a peek at our community activities, digital events, special offers, and more.To learn more about how you can help #StopAsianHate during Asian Pacific American Heritage Month and beyond, visit their website here.
3746
Of your peers have already watched this video.
5:00 Minutes
The most insightful time you'll spend today!
What’s BigQuery and Why Should IT Managers Care?
Today it’s impossible for anyone working in IT teams to have a day go by without a discussion about data, analytics, and big data.
Often these conversations veer towards BigQuery. Many IT managers are unsure what BigQuery is and what it does. If you are one of them, you aren’t alone.
Google BigQuery is a fast, highly-scalable, cost-effective, and fully managed cloud data warehouse for analytics, with built-in machine learning.
To better understand what the benefits of BigQuery are, it’s important to grasp some of the challenges that
These are some of the challenges that Google BigQuery fixes. To get a quick snapshot of what Google BigQuery does, watch this short video.

ESG Report: Economic Advantages of Google BigQuery OnDemand Serverless Analytics
DOWNLOAD WHITEPAPER5896
Of your peers have already downloaded this article
10:30 Minutes
The most insightful time you'll spend today!
Traditional big data solutions require a significant upfront investment, ongoing maintenance of hardware and software, and manual provisioning to match compute and storage resources with demand. Google’s serverless analytics warehouse does away with all that extra work, helping businesses focus on what matters most: getting value from their data.
Enterprise Strategy Group (ESG), which examined the economic value propositions of Google BigQuery and alternative big data solutions, reports that BigQuery enables organizations to:
- Save up to 88 percent on data warehousing over a three-year period
- Achieve a faster time to value by getting up and running quickly
- Empower more employees to become citizen data scientists
Eliminate maintenance tasks so teams can spend more time gaining insights
Download the complete report to learn more.
BigQuery Explainable AI for Demystifying the Inner Workings of ML Models. Now GA!

6553
Of your peers have already read this article.
2:00 Minutes
The most insightful time you'll spend today!
Explainable AI (XAI) helps you understand and interpret how your machine learning models make decisions. We’re excited to announce that BigQuery Explainable AI is now generally available (GA). BigQuery is the data warehouse that supports explainable AI in a most comprehensive way w.r.t both XAI methodology and model types. It does this at BigQuery scale, enabling millions of explanations within seconds with a single SQL query.
Why is Explainable AI so important? To demystify the inner workings of machine learning models, Explainable AI is quickly becoming an essential and growing need for businesses as they continue to invest in AI and ML. With 76% of enterprises now prioritizing artificial intelligence (AI) and machine learning (ML) over other initiatives in 2021 IT budgets, the majority of CEOs (82%) believe that AI-based decisions must be explainable to be trusted according to a PwC survey.
While the focus of this blogpost is on BigQuery Explainable AI, Google Cloud provides a variety of tools and frameworks to help you interpret models outside of BigQuery, such as with Vertex Explainable AI, which includes AutoML Tables, AutoML Vision, and custom-trained models.
So how does Explainable AI in BigQuery work exactly? And how might you use it in practice?
Two types of Explainable AI: global and local explainability
When it comes to Explainable AI, the first thing to note is that there are two main types of explainability as they relate to the features used to train the ML model: global explainability and local explainability.
Imagine that you have a ML model that predicts housing price (as a dollar amount), based on three features: (1) number of bedrooms, (2) distance to the nearest city center, and (3) construction date.
Global explainability (a.k.a. global feature importance) describes the features’ overall influence on the model and helps you understand if a feature had a greater influence than other features over the model’s predictions. For example, global explainability can reveal that the number of bedrooms and distance to city center typically has a much stronger influence than the construction date on predicting housing prices. Global explainability is especially useful if you have hundreds or thousands of features and you want to determine which features are the most important contributors to your model. You may also consider using global explainability as a way to identify and prune less important features to improve the generalizability of their models.
Local explainability (a.k.a. feature attributions) describes the breakdown of how each feature contributes towards a specific prediction. For example, if the model predicts that house ID#1001 has a predicted price of $230,000, local explainability would describe a baseline amount (e.g. $50,000) and how each of the features contributes on top of the baseline towards the predicted price. For example, the model may say that on top of the baseline of $50,000, having 3 bedrooms contributed an additional $50,000, close proximity to the city center added $100,000, and construction date of 2010 added $30,000, for a total predicted price of $230,000. In essence, understanding the exact contribution of each feature used by the model to make each prediction is the main purpose of local explainability.
What ML models does BigQuery Explainable AI apply to?
BigQuery Explainable AI applies to a variety of models, including supervised learning models for IID data and time series models. The documentation for BigQuery Explainable AI provides an overview of the different ways of applying explainability per model. Note that each explainability method has its own way of calculation (e.g. Shapley values), which are covered more in-depth in the documentation.

Examples with BigQuery Explainable AI
In this next section, we will show three examples of how to use BigQuery Explainable AI in different ML applications:
Regression models with BigQuery Explainable AI
Let’s use a boosted tree regression model to predict how much a taxi cab driver will receive in tips for a taxi ride, based on features such as number of passengers, payment type, total payment and trip distance. Then let’s use BigQuery Explainable AI to help us understand how the model made the predictions in terms of global explainability (which features were most important?) and local explainability (how did the model arrive at each prediction?).
The taxi trips dataset comes from the BigQuery public datasets and is publicly available in the table: bigquery-public-data.new_york_taxi_trips.tlc_yellow_trips_2018.
First, you can train a boosted tree regression model.
CREATE OR REPLACE MODEL bqml_tutorial.taxi_tip_regression_modelOPTIONS (model_type='boosted_tree_regressor',input_label_cols=['tip_amount'],max_iterations = 50,tree_method = 'HIST',subsample = 0.85,enable_global_explain = TRUE) ASSELECTvendor_id,passenger_count,trip_distance,rate_code,payment_type,total_amount,tip_amountFROM`bigquery-public-data.new_york_taxi_trips.tlc_yellow_trips_2018`WHERE tip_amount >= 0LIMIT 1000000
Now let’s do a prediction using ML.PREDICT, which is the standard way in BigQuery ML to make predictions without explainability.
SELECT *FROMML.PREDICT(MODEL bqml_tutorial.taxi_tip_regression_model,(SELECT"0" AS vendor_id,1 AS passenger_count,CAST(5.85 AS NUMERIC) AS trip_distance,"0" AS rate_code,"0" AS payment_type,CAST(55.56 AS NUMERIC) AS total_amount))

But you might wonder—how did the model generate this prediction of ~11.077?
BigQuery Explainable AI can help us answer this question. Instead of using ML.PREDICT, you use ML.EXPLAIN_PREDICT with an additional optional parameter top_k_features. ML.EXPLAIN_PREDICT extends the capabilities of ML.PREDICT by outputting several additional columns that explain how each feature contributes to the predicted value. In fact, since ML.EXPLAIN_PREDICT includes all the output from ML.PREDICT anyway, you may want to consider using ML.EXPLAIN_PREDICT every time instead.
SELECT *FROMML.EXPLAIN_PREDICT(MODEL bqml_tutorial.taxi_tip_regression_model,(SELECT"0" AS vendor_id,1 AS passenger_count,CAST(5.85 AS NUMERIC) AS trip_distance,"0" AS rate_code,"0" AS payment_type,CAST(55.56 AS NUMERIC) AS total_amount),STRUCT(6 AS top_k_features))

The way to interpret these columns is:
Σfeature_attributions + baseline_prediction_value = prediction_value
Let’s break this down. The prediction_value is ~11.077, which is simply the predicted_tip_amount. The baseline_prediction_value is ~6.184, which is the tip amount for an average instance. top_feature_attributions indicates how much each of the features contributes towards the prediction value. For example, total_amount contributes ~2.540 to the predicted_tip_amount.
ML.EXPLAIN_PREDICT provides local feature explainability for regression models. For global feature importance, see the documentation for ML.GLOBAL_EXPLAIN.
Classification models with BigQuery Explainable AI
Let’s use a logistic regression model to show you an example of BigQuery Explainable AI with classification models. We can use the same public dataset as before: bigquery-public-data.new_york_taxi_trips.tlc_yellow_trips_2018.
Train a logistic regression model to predict the bracket of the percentage of the tip amount out of the taxi bill.
CREATE OR REPLACE MODEL bqml_tutorial.taxi_tip_classification_modelOPTIONS(model_type='logistic_reg',input_label_cols=['tip_bucket'],enable_global_explain=true) ASSELECTvendor_id,passenger_count,trip_distance,rate_code,payment_type,total_amount,CASEWHEN tip_amount > total_amount*0.20 THEN '20% or more'WHEN tip_amount > total_amount*0.15 THEN '15% to 20%'WHEN tip_amount > total_amount*0.10 THEN '10% to 15%'ELSE '10% or less'END AS tip_bucketFROM`bigquery-public-data.new_york_taxi_trips.tlc_yellow_trips_2018`WHERE tip_amount >= 0LIMIT 1000000
Next, you can run ML.EXPLAIN_PREDICT to get both the classification results and the additional information for local feature explainability. For global explainability, you can use ML.GLOBAL_EXPLAIN. Again, since ML.EXPLAIN_PREDICT includes all the output from ML.PREDICT anyway, you may want to consider using ML.EXPLAIN_PREDICT every time instead.
SELECT *FROMML.EXPLAIN_PREDICT(MODEL bqml_tutorial.taxi_tip_classification_model,(SELECT"0" AS vendor_id,1 AS passenger_count,CAST(5.85 AS NUMERIC) AS trip_distance,"0" AS rate_code,"0" AS payment_type,CAST(55.56 AS NUMERIC) AS total_amount),STRUCT(6 AS top_k_features))

Similar to the regression example earlier, the formula is used to derive the prediction_value:
Σfeature_attributions + baseline_prediction_value = prediction_value
As you can see in the screenshot above, the baseline_prediction_value is ~0.296. total_amount is the most important feature in making this specific prediction, contributing ~0.067 to the prediction_value, though followed by trip_distance. The feature passenger_count contributes negatively to prediction_value by -0.0015. The features vendor_id, rate_code, and payment_type did not seem to contribute much to the prediction_value.
You may wonder why the prediction_value of ~0.389 doesn’t equal the probability value of ~0.359. The reason is that unlike for regression models, for classification models, prediction_value is not a probability score. Instead, prediction_value is the logit value (i.e., log-odds) for the predicted class, which you could separately convert to probabilities by applying the softmax transformation to the logit values. For example, a three-class classification has a log-odds output of [2.446, -2.021, -2.190]. After applying the softmax transformation, the probability of these class predictions is [0.9905, 0.0056, 0.0038].
Time-series forecasting models with BigQuery Explainable AI

Explainable AI for forecasting provides more interpretability into how the forecasting model came to its predictions. Let’s go through an example of forecasting the number of bike trips in NYC using the new_york.citibike_trips public data in BigQuery.
You can train a time-series model ARIMA_PLUS:
CREATE OR REPLACE MODEL bqml_tutorial.nyc_citibike_arima_modelOPTIONS(model_type = 'ARIMA_PLUS',time_series_timestamp_col = 'date',time_series_data_col = 'num_trips',holiday_region = 'US') ASSELECTEXTRACT(DATE from starttime) AS date,COUNT(*) AS num_tripsFROM`bigquery-public-data.new_york.citibike_trips`GROUP BY dateNext, you can first try forecasting without explainability using ML.FORECAST:SELECT*FROMML.FORECAST(MODEL bqml_tutorial.nyc_citibike_arima_model,STRUCT(365 AS horizon, 0.9 AS confidence_level))
This function outputs the forecasted values and the prediction interval. Plotting it in addition to the input time series gives the following figure.

But how does the forecasting model arrive at its predictions? Explainability is especially important if the model ever generates unexpected results.
With ML.EXPLAIN_FORECAST, BigQuery Explainable AI provides extra transparency into the seasonality, trend, holiday effects, level (step) changes, and spikes and dips outlier removal. In fact, since ML.EXPLAIN_FORECAST includes all the output from ML.FORECAST anyway, you may want to consider using ML.EXPLAIN_FORECAST every time instead.
SELECT*FROMML.EXPLAIN_FORECAST(MODEL bqml_tutorial.nyc_citibike_arima_model,STRUCT(365 AS horizon, 0.9 AS confidence_level))

Compared to the previous figure which only shows the forecasting results, this figure shows much richer information to explain how the forecast is made.
First, it shows how the input time series is adjusted by removing the spikes and dips anomalies, and by compensating the level changes. That is:
time_series_adjusted_data = time_series_data - spikes_and_dips - step_changes
Second, it shows how the adjusted input time series is decomposed into different components such as both weekly and yearly seasonal components, holiday effect component and trend component. That is
time_series_adjusted_data = trend + seasonal_period_yearly + seasonal_period_weekly + holiday_effect + residual
Finally, it shows how these components are forecasted separately to compose the final forecasting results. That is:
time_series_data = trend + seasonal_period_yearly + seasonal_period_weekly + holiday_effect
For more information on these time series components, please see the documentation here.
Conclusion
With the GA of BigQuery Explainable AI, we hope you will now be able to interpret your machine learning models with ease.
Thanks to the BigQuery ML team, especially Lisa Yin, Jiashang Liu, Amir Hormati, Mingge Deng, Jerry Ye and Abhinav Khushraj. Also thanks to the Vertex Explainable AI team, especially David Pitman and Besim Avci.
More Relevant Stories for Your Company
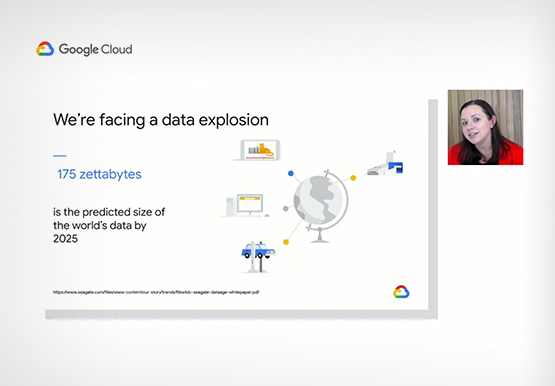
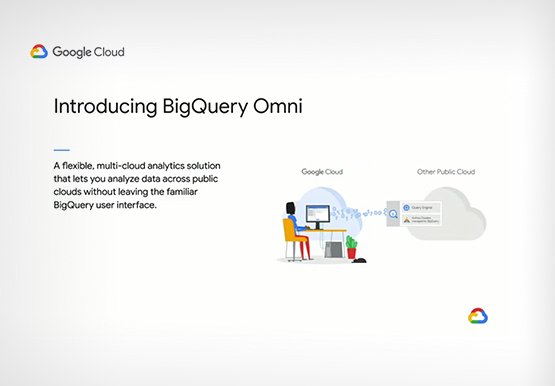
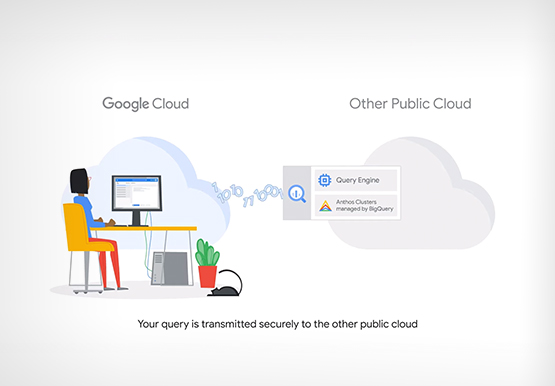

Analytics in a Multi-Cloud World with BigQuery Omni
Enterprises have more data at hand than they have ever had in the past. But are unable to leverage it fully. “We have all of this data at our fingertips. But we just can't quite get to it because we're living in this world of data silos,” says Emily Rapp,

Rubin Observatory Leverages Google Cloud to Power Astronomical Research
This week, the Vera C. Rubin Observatory is launching the first preview of its new Rubin Science Platform (RSP) for an initial cohort of astronomers. The observatory, which is located in Chile but managed by the U.S. National Science Foundation’s NOIRLab in Tucson, AZ and SLAC in California, is jointly funded by the NSF and the U.S. Department

Key Highlights on Data Analytics to Smooth Your Organization’s Data Journey
As the Olympics kicked off in Tokyo at the end of July, we found ourselves reflecting on the beauty of diverse countries and cultures coming together to celebrate greatness and sportsmanship. For this month’s blog, we’d like to highlight some key data and analytics performances that should help inspire you

Making Streaming Analytics Simpler and More Cost-Effective With Cloud Dataflow
Streaming analytics helps businesses to understand their customers in real time and adjust their offerings and actions to better serve customer needs. It’s an important part of modern data analytics, and can open up possibilities for faster decisions. For streaming analytics projects to be successful, the tools have to be
