





Ahead of the Curve: 5 Data and AI Trends Set to Shape 2023

2240
Of your peers have already read this article.
4:00 Minutes
The most insightful time you'll spend today!
How will your organization manage this year’s data growth and business requirements? Your actions and strategies involving data and AI will improve or undermine your organization’s competitiveness in the months and years to come. Our teams at Google Cloud have an eye on the future as we evolve our strategies to protect technology choice, simplify data integration, increase AI adoption, deliver needed information on demand, and meet security requirements.
Google Cloud worked with* IDC on multiple studies involving global organizations across industries in order to explore how data leaders are successfully addressing key data and AI challenges. We compiled the results in our 2023 Data and AI Trends report. In it, you’ll find the metrics-rich research behind the top five data and AI trends, along with tips and customer examples for incorporating them into your plans.

1: Show data silos the door
Given the increasing volumes of data we’re all managing, it’s no surprise that siloed transactional databases and warehousing strategies can’t meet modern demands. Organizations want to improve how they store, manage, analyze, and govern all their data, while reducing costs. They also want to eliminate conflicting insights from replicated data and empower everyone with fresh data.
A unified data cloud enables the integration of data and insights into transformative digital experiences and better decision making.
Andi Gutmans, GM and VP of Engineering for Databases, Google Cloud
In the report, you can learn how to adopt a unified data cloud that supports every stage of the data lifecycle so that you can improve data usage, accessibility, and governance. Inform your strategy by drawing on organizations’ examples such as a data fabric that improves customer experiences by connecting more than 80 data silos, as well as other unified data clouds that save money and simplify growth.

2: Usher in the age of the open data ecosystem
Data is the key to unlocking AI, speeding up development cycles, and increasing ROI. To protect against data and technology lock-in, more organizations are adopting open source software and open APIs.
Tweet this quote
Understand how you can simplify data integration, facilitate multicloud analytics, and use the technologies you want with an open data ecosystem, as described in the report. Learn from metrics about global open source adoption and public dataset usage. And explore how global companies adopted open data ecosystems to improve patient outcomes, increase website traffic by 25%, and cut operating costs by 90%.
3: Embrace the AI tipping point
Pulling useful information out of data is easier with AI and ML. Not only can you identify patterns and answer questions faster but the technologies also make it easier to solve problems at scale.
We’ve reached the AI tipping point. Whether people realize it or not, we’re already using applications powered by AI—every day. Social media platforms, voice assistants, and driving services are easy examples.
June Yang, VP, Cloud AI and Industry Solutions, Google Cloud
Organizations share how they’re reaching their goals using AI and ML by empowering “citizen data scientists” and having them focus on small wins first. Gain tips from Yang and other experts for developing your AI strategy. And read how organizations achieve outcomes such as a reduction of 7,400 tons per year in carbon emissions and a more than 200% increase in ROI from ad spend by using pattern recognition and other AI capabilities.

4: Infuse insights everywhere
Yesterday’s BI solutions have led to outdated insights and user fatigue with the status quo, based on generic metrics and old information. Research shows that as new tools come online, expectations for BI are changing, with companies revising their strategies to improve decision making, speed up the development of new revenue streams, and increase customer acquisition and retention by providing individuals with needed information on demand.
Organizations are equipping business decision-makers with the tools they need to incorporate required insights into their everyday workflows.
Kate Wright, Senior Director, Product Management, Google Cloud
In the report, you’ll discover why and how data leaders are rethinking their BI analytics strategies and applications to improve users’ trust and use of data in automated workflows, customizable dashboards, and on-demand reports. Global companies also share how they improve decision making with self-service BI, customer experiences with IoT analysis, and threat mitigation with embedded analytics.

5: Get to know your unknown data
Increasing data volumes can make it harder to know where and what data they store, which may create risk. Case in point: If a customer unexpectedly shares personally identifiable information during a recorded customer support call or chat session, that data might require specialized governance, which the standardized storage process may not provide.
If you don’t know what data you have, you cannot know that it’s accurately secured. You also don’t know what security risks you are incurring, or what security measures you need to take.
Anton Chuvakin, Senior Staff Security Consultant, Google Cloud
Check out the report to learn about data security risks that are often overlooked and how to develop proactive governance strategies for your sensitive data. You can also read how global organizations have increased customer trust and productivity by improving how they discover, classify, and manage their structured and unstructured data.
Be ready for what’s next
What’s exciting about these trends is that they’re enabling organizations across industries to realize very different goals using their choice of technologies. And although all the trends depend on each other, research shows you can realize measurable benefits whether you adopt one or all five.
Review the report yourself and learn how you can refine your organization’s data and AI strategies by drawing on the collective insights, experiences, and successes of more than 800 global organizations.
Transforming Software Development Education with CourseMatix

1471
Of your peers have already read this article.
3:00 Minutes
The most insightful time you'll spend today!
As the world increasingly relies on software, businesses have struggled to find enough developer talent to build and maintain their applications. IDC estimates the global shortage of software developers reached 1.4 million in 2021 and expects that number to balloon to 4 million by 2025.
Higher education is a great starting point to solve the software development skills shortage. One institution — Spokane Community College — has made strides in enhancing student learning and serving more students with the right mix of software development and IT education while saving educators time.
Building a modern IT education platform
As a first step to improve computer science education and scale the number of students it could teach, Spokane Community College needed a platform that could help instructors more efficiently manage the teaching process. That’s where CourseMatix came in.
CourseMatix is an education platform that delivers the required tools, platforms, and frameworks such as automated grading, assignment tracking, and testing to save teachers time and enhance students’ learning.
CourseMatix is entirely made up of microservices, with significant compute demands because it creates and runs a unique dedicated environment for each student. The platform is complex by nature as it supports a range of technologies that computer science professors need to teach varying coursework. This led to issues with scalability, reliability, and uptime when running on legacy infrastructure.
“We really wanted to no longer manage our infrastructure, leaving us to focus entirely on our platform,” says Aleks Korn, chief executive officer of CourseMatix. “We engaged Google Cloud partner CDW to see how we could simplify and improve our IT environment. The decision was quickly made to migrate to Google Kubernetes Engine (GKE).”
GKE provides CourseMatix with automatic horizontal and vertical scaling to minimize costs and downtime, while removing management and maintenance requirements. This enables CourseMatix to expand the reach of its platform at the lowest possible price and maintain a lean team. CDW helped CourseMatix make this decision to migrate to GKE, managed the migration, and provided guidance on a storage solution.
Because CourseMatix has high data storage volume requirements (given the size of software development assignments) and needs to be fully reliable to ensure work is not lost, it also chose to work with NetApp. NetApp Cloud Volumes Service for Google Cloud perfectly complements GKE in its highly expandable, reliable, and user-friendly capabilities. The platform was now ready for its U.S. launch at Spokane Community College.
Transforming software development education
Spokane Community College needed a solution to address the challenges facing its professors, particularly with respect to time management.
“Each software development assignment can take an hour to grade,” says Bret Dickey, professor of software development at Spokane Community College. “When you have 100 students, you’re talking weeks of turnaround time to grade those projects. CourseMatix provides immediate feedback, which is a game changer for us as professors and our students.”
Students now complete and submit their assignments with real-world tools, using source control, creating branches to complete their work, and merging those branches to push up to the server where pipelines run the applications.
“It’s making our teaching better overall, including using real-world concepts to enhance teaching and outcomes,” says Dickey.
CourseMatix also provides the tooling to upskill on various programming languages and software packages required for coursework, helping Spokane Community College manage server-side frameworks and client-side languages that each have their own tools.
“Students can access their cloud-based coding environment and all the tools they may need for an assignment are ready to go,” says Karmen Blake, another software development professor at Spokane Community College. “Having a central system for tooling within CourseMatix has been a huge time saver, meaning more time for learning and practice that prepares students for careers as professional software developers.”
Karmen and Dickey have seen marked improvements in their ability to teach and in student learning by using CourseMatix. For example, the platform provides automated hints and varying error messages based on the number of attempts a student has made to solve a problem to help each student along without making the assignment too easy or too difficult.
As a cloud-based platform, CourseMatix also empowers students from a wide range of socioeconomic backgrounds to learn computer science.
“As long as students can access the internet on their laptops, they have everything to complete their assignments,” says Karmen. “The cloud-based CourseMatix offering improves efficiency and equity across all students in our computer science programs.”
With a more fluid experience for students and immense amounts of time saved on grading, Spokane Community College is in a better position to increase enrollment in software development classes.
“Now that we have automated our grading and optimized our assignment processes, I am beginning to take on more students and teach more classes,” says Dickey. “I could not have imagined this outcome only a couple of years ago, and it’s all possible thanks to CourseMatix.”
To learn more about how partners help organizations make the most of Google Cloud, you can visit our partner page.
Predictive Model Built on Google Cloud Helps You Get a 7-day Mosquito Forecast Report!
4760
Of your peers have already read this article.
3:00 Minutes
The most insightful time you'll spend today!
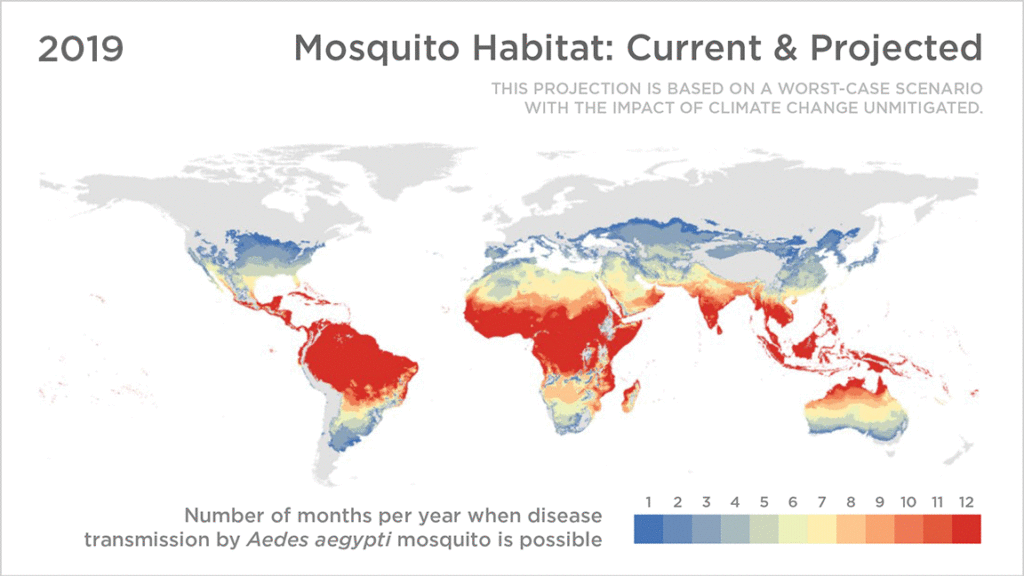
Mosquitoes aren’t just the peskiest creatures on Earth; they infect more than 700 million people a year with dangerous diseases like Zika, Malaria, Dengue Fever, and Yellow Fever. Prevention is the best protection, and stopping mosquito bites before they happen is a critical step.
SC Johnson—a leading developer and manufacturer of pest control products, consumer packaged goods, and other professional products—has an outsized impact in reducing the transmission of mosquito-borne diseases. That’s why Google Cloud was honored to team up with one of the company’s leading pest control brands, OFF!®, to develop a new publicly available, predictive model of when and where mosquito populations are emerging nationwide.
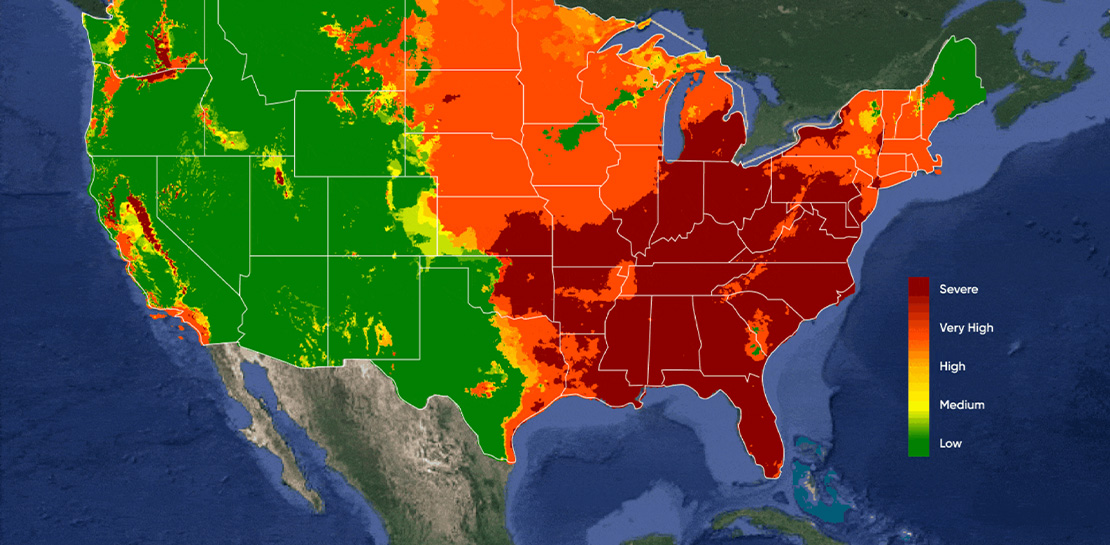
As the planet warms and weather changes, OFF! noticed month-to-month and year-to-year fluctuations in consumer habits at a regional level, due to changes in mosquito populations. Because of these rapid changes, it’s difficult for people to know when to protect themselves. The OFF!Cast Mosquito Forecast™, built on Google Cloud and available today, will predict mosquito outbreaks across the United States, helping communities protect themselves from both the nuisance of mosquitoes and the dangers of mosquito-borne diseases—with the goal of expanding to other markets, like Brazil and Mexico, in the near future.
With the OFF!Cast Mosquito Forecast™, anyone can get their local mosquito prediction as easily as a daily weather update. Powered by Google Cloud’s geospatial and data analytics technologies, OFF!Cast Mosquito Forecast is the world’s first public technology platform that predicts and shares mosquito abundance information. By applying data that is informed by the science of mosquito biology, OFF!Cast accurately predicts mosquito behavior and mosquito populations in specific geographical locations.
Starting today, anyone can easily explore OFF!Cast on a desktop or mobile device and get their local seven-day mosquito forecast for any zip code in the continental United States. People can also sign up to receive a weekly forecast. To make this forecasting tool as helpful as possible, OFF! modeled its user interface after popular weather apps, a familiar frame of reference for consumers.

The technology behind the OFF!Cast Mosquito Forecast
To create this first-of-its-kind forecast, OFF! stood up a secure and production-scale Google Cloud Platform environment and tapped into Google Earth Engine, our cloud-based geospatial analysis platform that combines satellite imagery and geospatial data with powerful computing to help people and organizations understand how the planet is changing.
The OFF!Cast Mosquito Forecast is the result of multiple data sources coming together to provide consumers with an accurate view of mosquito activity. First, Google Earth Engine extracts billions of individual weather data points. Then, a scientific algorithm co-developed by the SC Johnson Center for Insect Science and Family Health and Climate Engine experts translates that weather data into relevant mosquito information. Finally, the collected information is put into the model and distilled into a color-coded, seven-day forecast of mosquito populations. The model is applied to the lifecycle of a mosquito, starting from when it lays eggs to when it could bite a human.
The SC Johnson Center for Insect Science and Family Health is one the world’s leading entomology research centers, studying advanced science of insect biology, insect-borne disease prevention and effective product solutions for consumer use. The science behind brands like OFF! is grounded in knowledge from world-class entomologists who have devoted their careers to SC Johnson’s mission of eradicating diseases like Malaria and Zika.
“We are putting the power in consumers’ hands in providing them with a tool to help predict their exposure and prevent mosquito bites,” said Maude Meier, SC Johnson entomologist. “It’s an exciting time to be working in the field of insect science as we find new opportunities to combine science and technology, like Google Earth Engine, to be a force for good in our mission to prevent the spread of insect-borne diseases.”
It takes an ecosystem to battle mosquitos
Over the past decade, academics, scientists and NGOs have used Google Earth Engine and its earth observation data to make meaningful progress on climate research, natural resource protection, carbon emissions reduction and other sustainability goals. It has made it possible for organizations to monitor global forest loss in near real-time and has helped more than 160 countries map and protect freshwater ecosystems. Google Earth Engine is now available in preview with Google Cloud for commercial use.
Our partner, Climate Engine, was a key player in helping make the OFF!Cast Mosquito Forecast a reality. Climate Engine is a scientist-led company that works with Google Cloud and our customers to accelerate and scale the use of Google Earth Engine, in addition to those of Google Cloud Storage and BigQuery, among other tools. With Climate Engine, OFF! integrated insect data from VectorBase, an organization that collects and counts mosquitoes and is funded by the U.S. National Institute of Allergy and Infectious Diseases.
The model powering the OFF!Cast Mosquito Forecast combines three inputs—knowledge of a mosquito’s lifecycle, detailed climate data inputs, and mosquito population counts from more than 5,000 locations provided by VectorBase. The model’s accuracy was validated against precise mosquito population data collected over six years from more than 33 million mosquitoes across 141 different species at more than 5,000 unique trapping locations.
A better understanding of entomology, especially things like degree days and how they affect mosquito populations, and helping communities take action is critically important to improving public health. Learn more about OFF!Cast Mosquito Forecast and see here to learn more about Google Earth Engine on Google Cloud.
Recommendations for Modelling SAP Data inside BigQuery

8396
Of your peers have already read this article.
4:00 Minutes
The most insightful time you'll spend today!
Over the past few years, many organizations have experienced the benefits of migrating their SAP solutions to Google Cloud. But this migration can do more than reduce IT maintenance costs and make data more secure. By leveraging BigQuery, SAP customers can complement their SAP investments and gain fresh insights by consolidating enterprise data and easily extending it with powerful datasets and machine learning from Google.
BigQuery is a leading cloud data warehouse, fully managed and serverless, and allows for massive scale, supporting petabyte-scale queries at super-fast speeds. It can easily combine SAP data with additional data sources, such as Google Analytics or Salesforce, and its built-in machine learning lets users operationalize machine learning models using standard SQL — all at a comparatively low cost.
If your SAP-powered organization is looking to supercharge its analytics with the strength of BigQuery, read on for considerations and recommendations for modeling with SAP data. These guidelines are based on our real-world implementation experience with customers and can serve as a roadmap to the analytics capabilities your business needs.
Considerations for data replication
Like most technology journeys, this one should start with a business objective. Keeping your intended business value and goals in mind is critical to making the right decisions in the early steps of the design process.
When it comes to replicating the data from an SAP system into BigQuery, there are multiple ways to do it successfully. Decide which method will work best for your organization by answering these questions:
- Does your business need real-time data? Will you need to time travel into past data?
- Which external datasets will you need to join with the replicated data?
- Are the source structures or business logic likely to change? Will you be migrating the SAP source systems any time soon? For instance, will you be moving from SAP ECC to SAP S/4HANA?
You’ll also need to determine whether replication should be done on a table-by-table basis or whether your team can source from pre-built logic. This decision, along with other considerations such as licensing, will influence which replication tool you should use.
Replicating on a table-by-table basis
Replicating tables, especially standard tables in their raw form, allows sources to be reused and ensures more stability of the source structure and functional output. For example, the SAP table for sales order headers (VBAK) is very unlikely to change its structure across different versions of SAP, and the logic that writes to it is also unlikely to change in a way that affects a replicated table.
Something else to consider: Reconciliation between the source system and the landing table in BigQuery is linear when comparing raw tables, which helps avoid issues in consolidation exercises during critical business processes, such as period-end closing. Since replicated tables aren’t aggregated or subject to process-specific data transformation, the same replicated columns can be reused in different BigQuery views. You can, for instance, replicate the MARA table (the material master) once and use it in as many models as needed.
Replicating pre-built logic
If you replicate pre-built models, such as those from SAP extractors or CDS views, you don’t need to build the logic in BigQuery, since you’re using existing logic. Some of these extraction objects have embedded delta mechanisms, which may complement a replication tool that can’t handle deltas. This will save initial development time, but it can also lead to challenges if you create new columns, or if customizations or upgrades change the logic behind the extraction.
It’s also important to note that different extraction processes may transform and load the same source columns multiple times, which creates redundancy in BigQuery and can lead to higher maintenance needs and costs. However, replicating pre-built models may still be a good choice, since doing so can be especially useful for logic that tends to be immutable, such as flattening a hierarchy, or logic that is highly complex.
How you approach replication will also depend on your long-term plans and other key factors — for example, the availability (and curiosity) of your developers, and the time or effort they can put into applying their SQL knowledge to a new data warehouse.
With either replication approach, bear in mind when designing your replication process that BigQuery is meant to be an append-always database — so post-processing of data and changes will be required in both cases.
Processing data changes
The replication tool you choose will also determine how data changes are captured (known as CDC – change data capture). If the replication tool allows for it (for example as SAP SLT does) the same patterns described in the CDC with BigQuery documentation also apply to SAP data.
Because some data, like transactions, are known to be less static than others (e.g., master data), you need to decide what should be scanned in real time, what will require immediate consistency, and what can be processed in batches to manage costs. This decision will be based on the reporting needs from the business.
Consider the SAP table BUT000, containing our example master data for business partners, where we have replicated changes from an SAP ERP system:
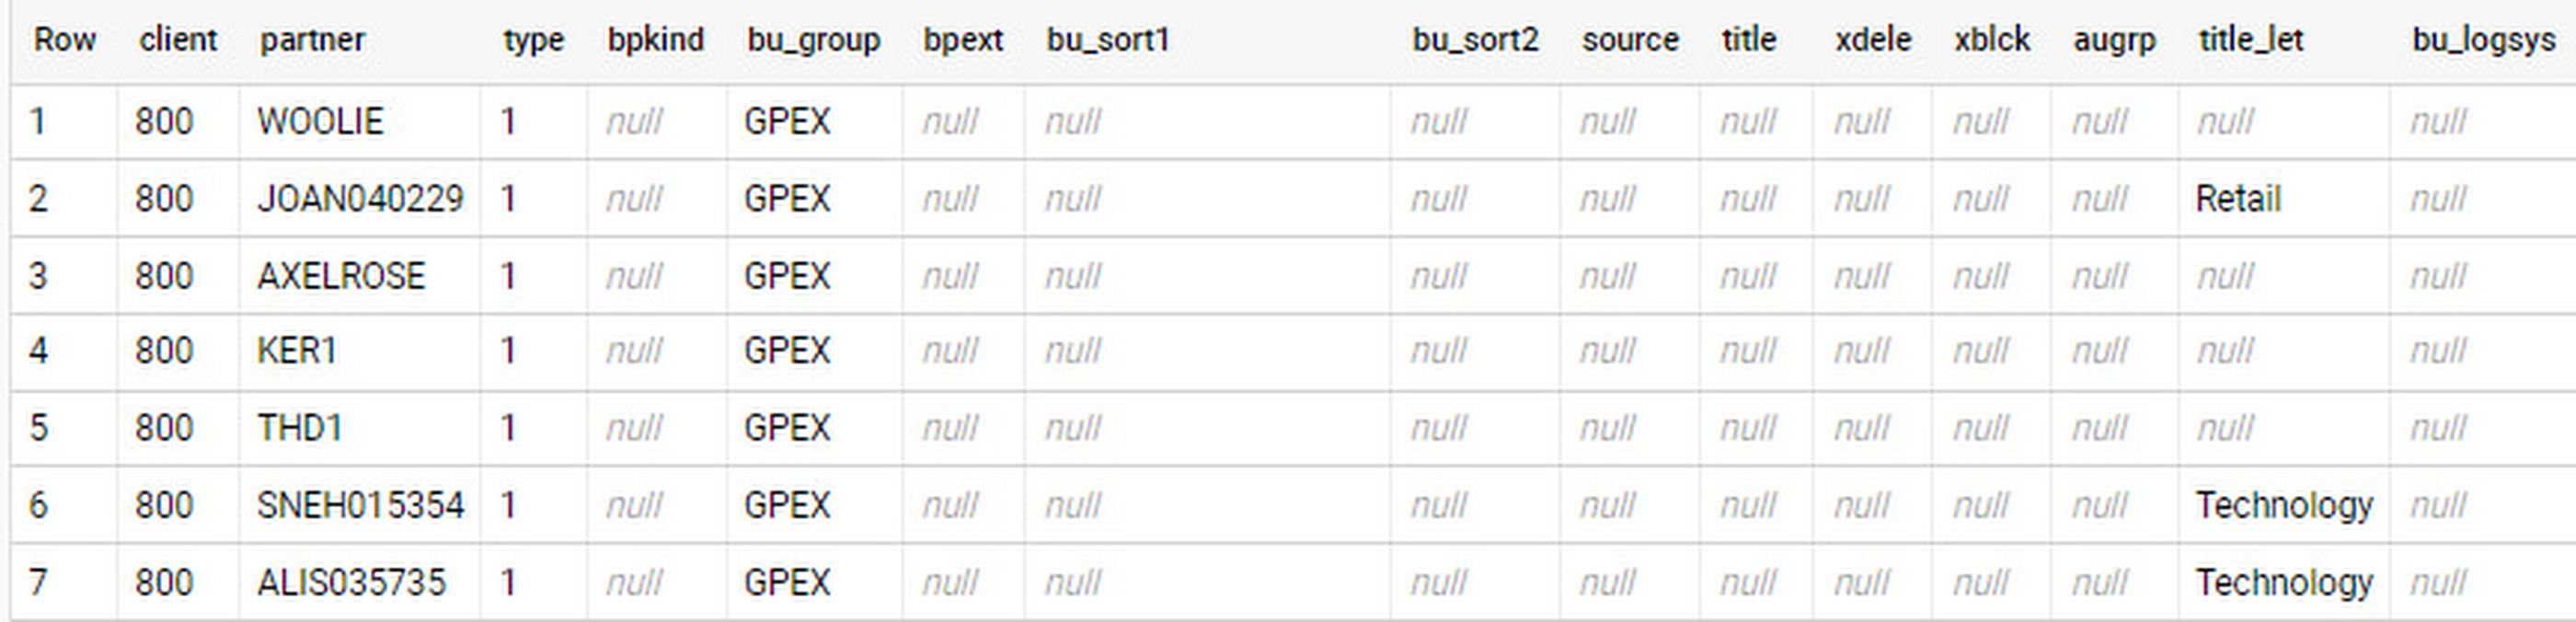
In an append-always replication in BigQuery, all updates are received as new records. For example, deleting a record in the source will be represented as a new record in BigQuery with a deletion flag. This applies to whether the records are coming from raw tables like BUT000 itself or pre-aggregated data, as from a BW extractor or a CDS view.
Let’s take a closer look at data coming particularly from the partners “LUCIA” and “RIZ”. The operation flag tells us whether the new record in BigQuery is an insert (I), update (U) or deletion (D), while the timestamps help us identify the latest version of our business partner.
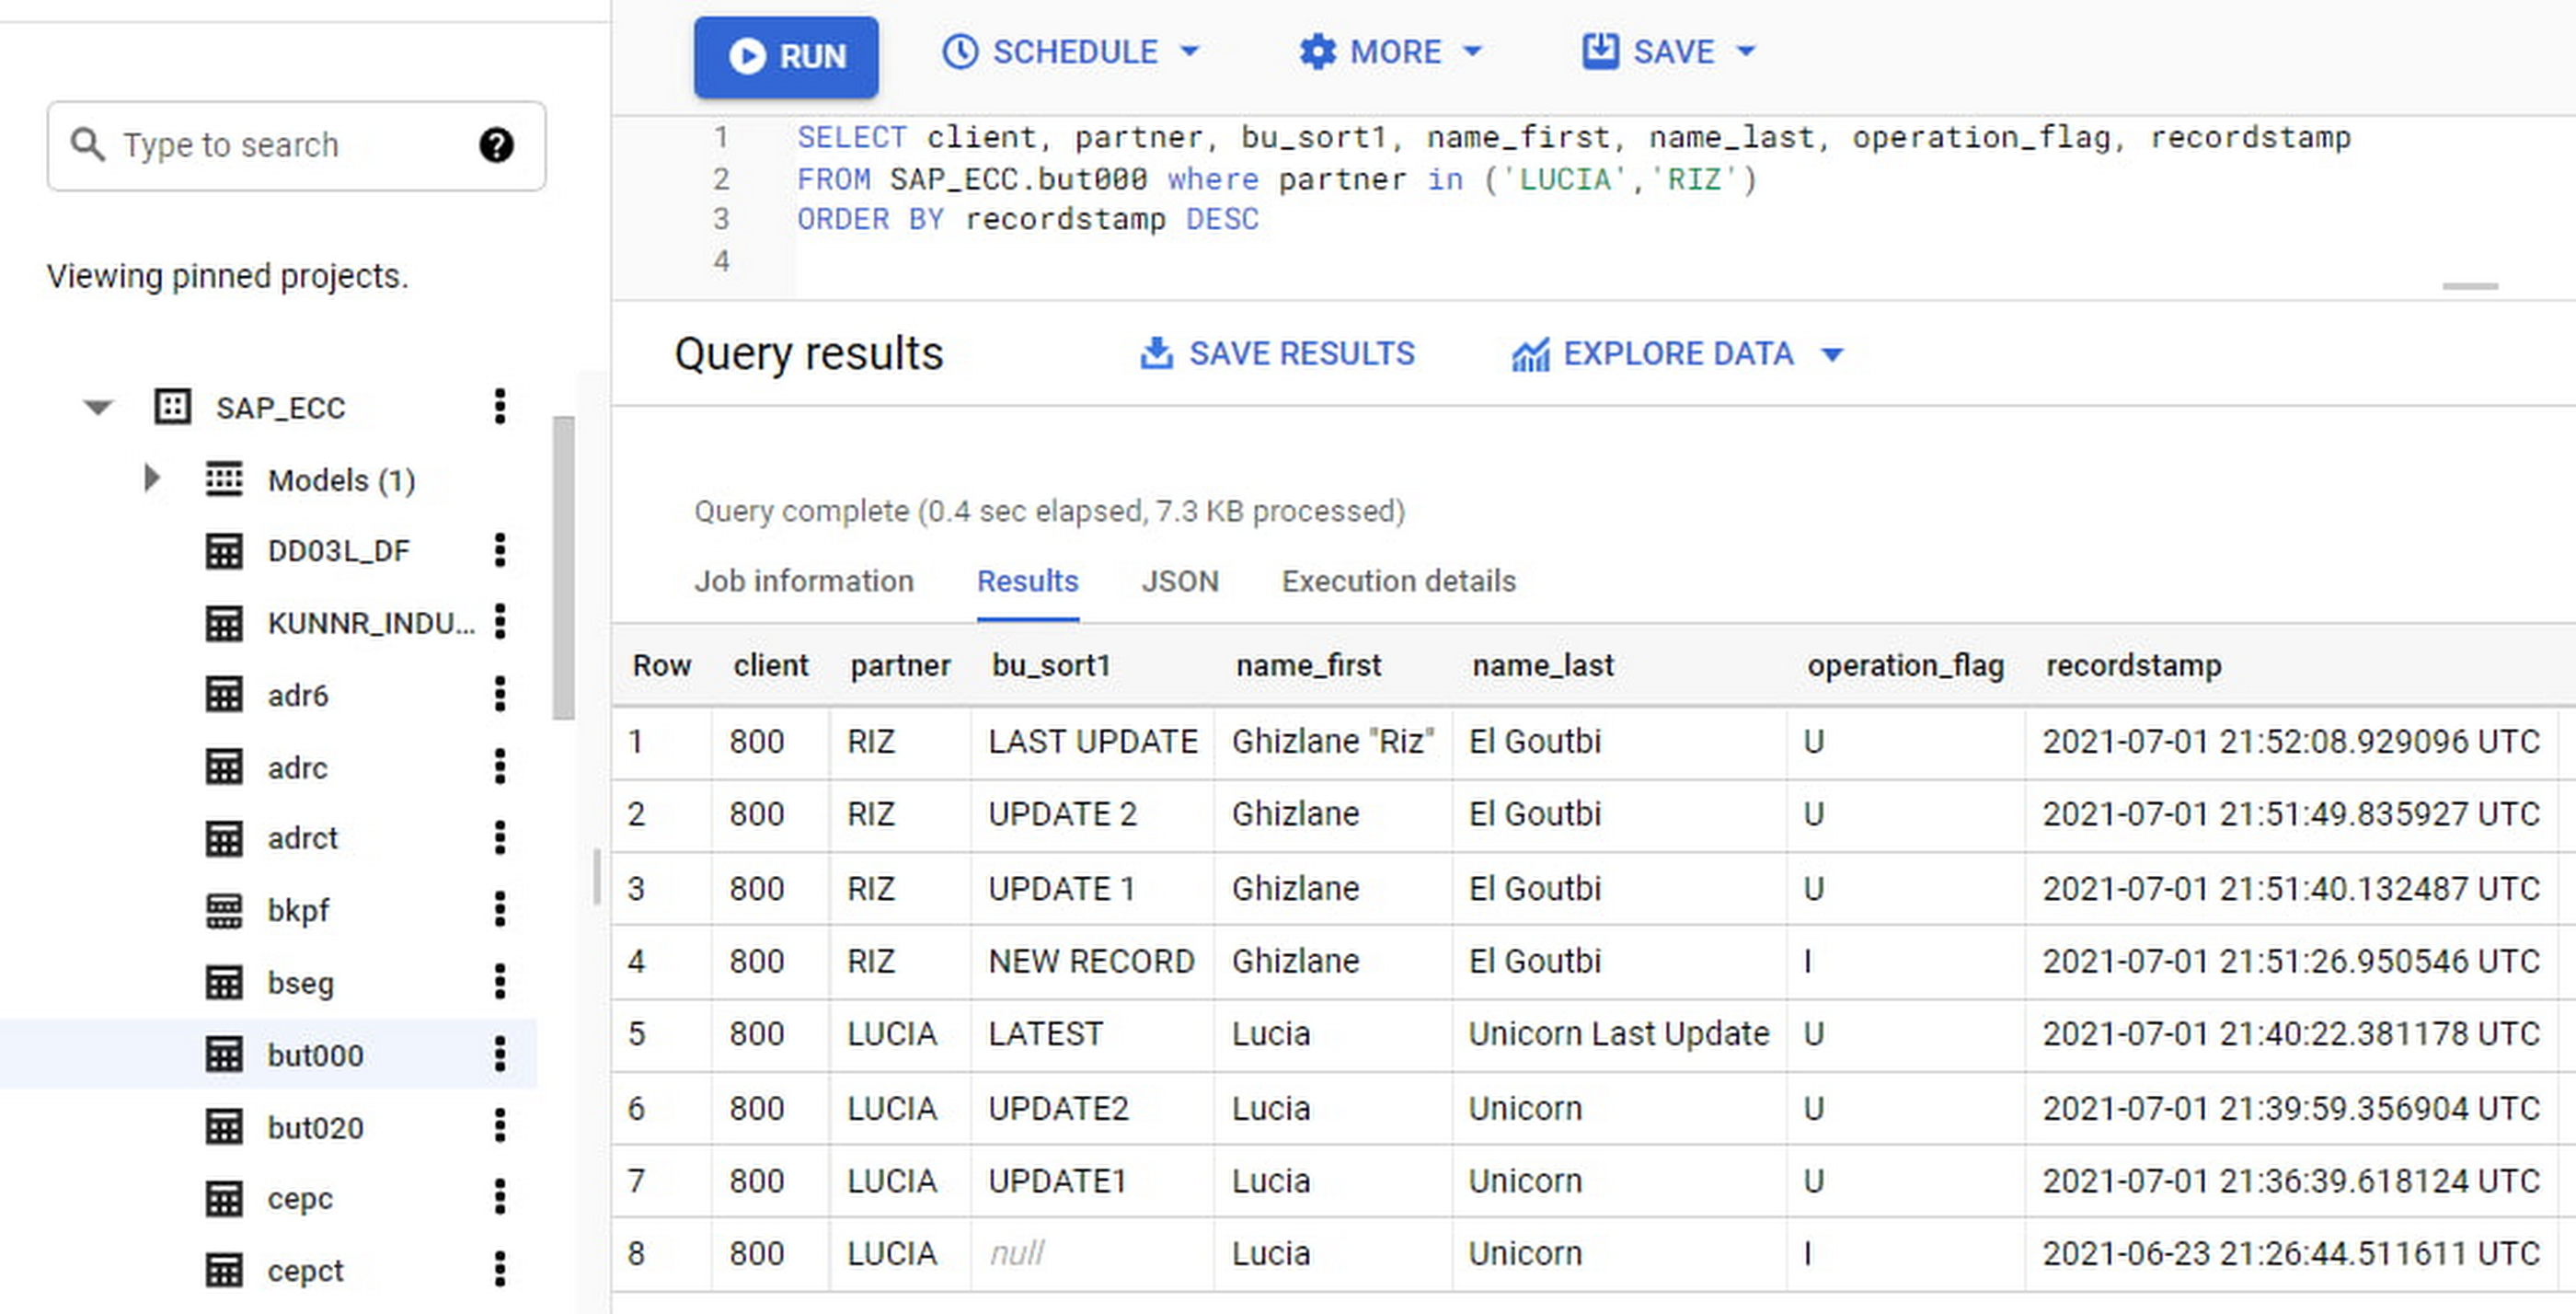
If we want to find the latest updated record for the partners LUCIA and RIZ, this is what the query would look like:
SELECT partner,ARRAY_AGG(i1 ORDER BY i1.recordstamp DESC LIMIT 1) AS rowFROM SAP_ECC.but000 i1WHERE partner in ('LUCIA','RIZ')GROUP BY partner
With the following result:
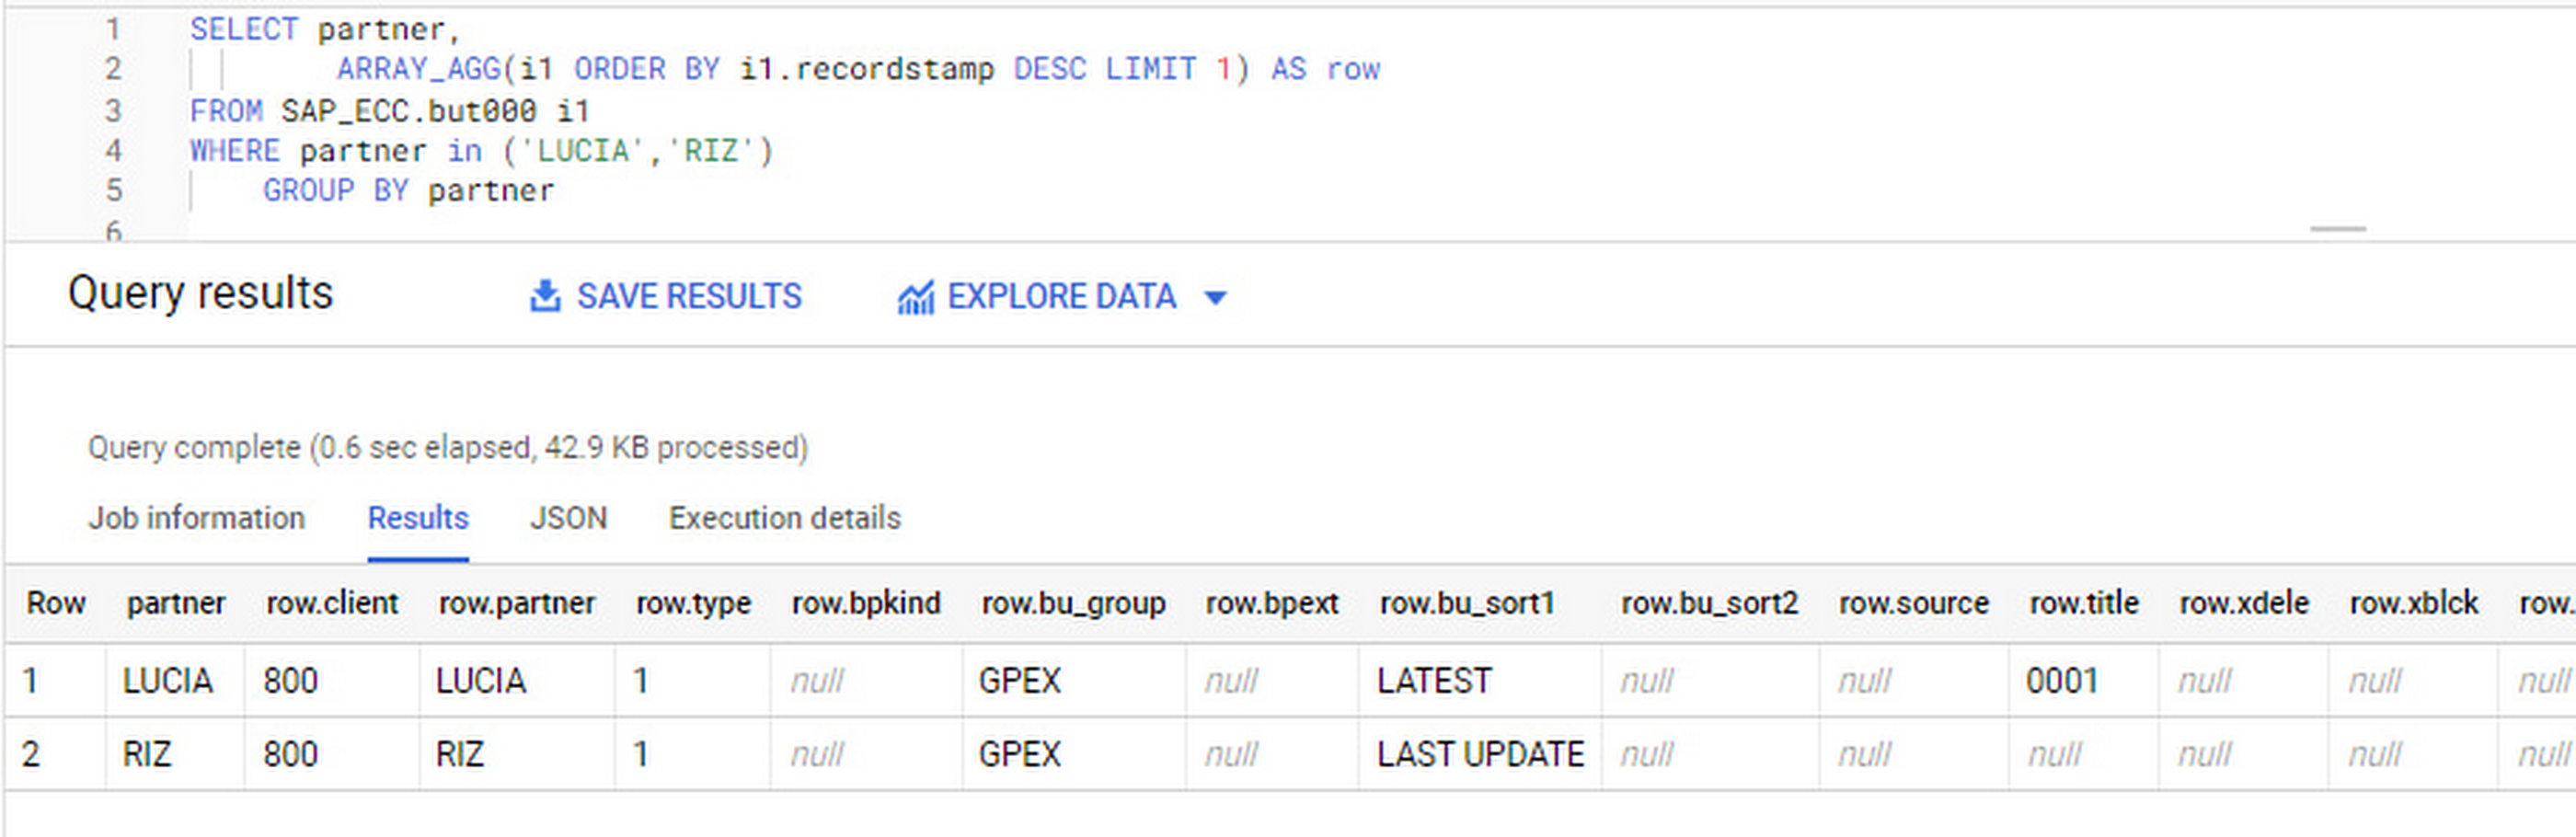
After identifying stale records for “LUCIA” and “RIZ” business partners, we can proceed to deleting all stale records for “LUCIA” if we do not want to retain the history. In this example, we are using a different table to which the same replication has been done, for the purpose of comparison and to check that all stale records have been deleted for the selection made and that we only kept last updated records. For example:
DELETE SAP_HANA.but000 i1WHEREi1.recordstamp < TIMESTAMP_SUB(CURRENT_TIMESTAMP(), INTERVAL 3 HOUR) ANDi1.recordstamp < (SELECT MAX(recordstamp) FROM SAP_HANA.but000 i2WHEREi1.partner = i2.partnerand partner="LUCIA")
You can also use the following query to retrieve stale records for “LUCIA” partner before moving forward with deletion
SELECT partner, operation_flag, recordstamp FROM SAP_HANA.but000 i1WHEREi1.recordstamp < TIMESTAMP_SUB(CURRENT_TIMESTAMP(), INTERVAL 3 HOUR)ANDi1.recordstamp < (SELECT MAX(recordstamp) FROM SAP_HANA.but000 i2WHEREi1.partner = i2.partnerand partner="LUCIA")
Which produces all of the records, except the latest update:

Partitioning and clustering
To limit the number of records scanned in a query, save on cost and achieve the best performance possible, you’ll need to take two important steps: determine partitions and create clusters.
Partitioning
A partitioned table is one that’s divided into segments, called partitions, which make it easier to manage and query your data. Dividing a large table into smaller partitions improves query performance and controls costs because it reduces the number of bytes read by a query.
You can partition BigQuery tables by:
- Time-unit column: Tables are partitioned based on a “timestamp,” “date,” or “datetime” column in the table.
- Ingestion time: Tables are partitioned based on the timestamp recorded when BigQuery ingested the data.
- Integer range: Tables are partitioned based on an integer column.
Partitions are enabled when the table is created, as in the example below. A great tip is to always include the partition filter as shown on the left-hand side of the query.

Clustering
Clustering can be created on top of partitioned tables by applying the fields that are likely to be used for filtering. When you create a clustered table in BigQuery, the table data is automatically organized based on the contents of one or more of the columns in the table’s schema. The columns you specify are then used to colocate related data.
Clustering can improve the performance of certain query types — for example, queries that use filter clauses or that aggregate data. It makes a lot of sense to use them for large tables such as ACDOCA, the table for accounting documents in SAP S/4HANA. In this case, the timestamp could be used for partitioning, and common filtering fields such as the ledger, company code, and fiscal year could be used to define the clusters.
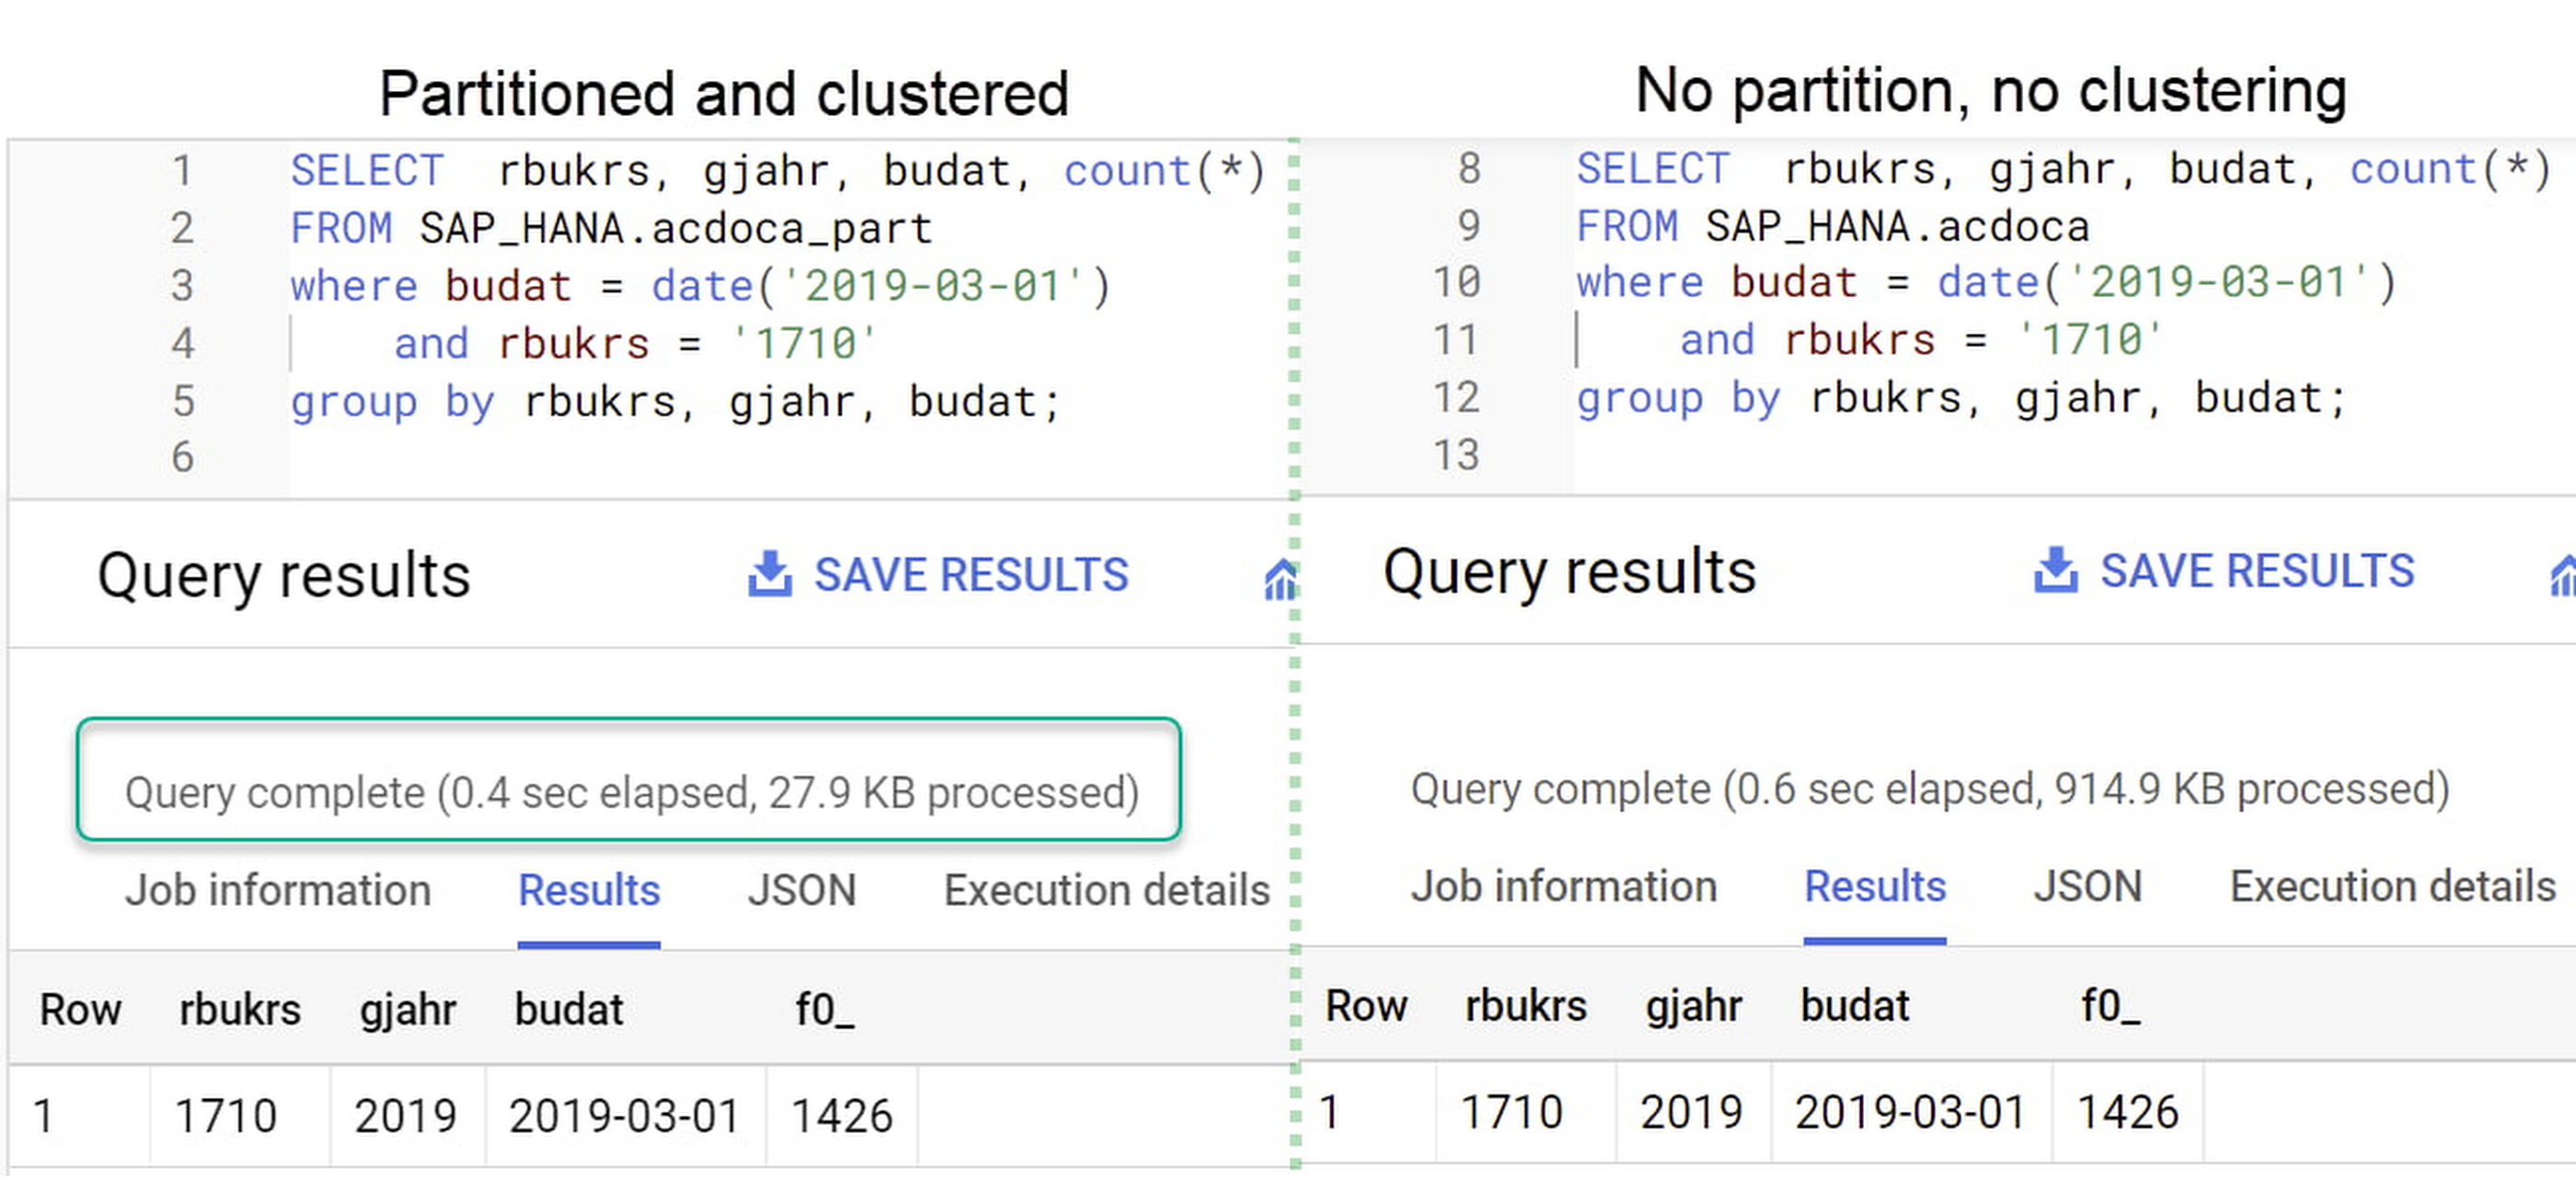
A great feature is that BigQuery will also periodically recluster the data automatically.
Materialized views
In BigQuery, materialized views are precomputed views that periodically cache the results of a query for better performance and efficiency. BigQuery uses precomputed results from materialized views and, whenever possible, reads only the delta changes from the base table to compute up-to-date results quickly. Materialized views can be queried directly or can be used by the BigQuery optimizer to process queries to the base table.
Queries that use materialized views are generally completed faster and consume fewer resources than queries that retrieve the same data only from the base table. If workload performance is an issue, materialized views can significantly improve the performance of workloads that have common and repeated queries. While materialized views currently only support single tables, they are very useful common and frequent aggregations like stock levels or order fulfillment.
Further tips on performance optimization while creating select statements can be found in the documentation for optimizing query computation.
Deployment pipeline and security
For most of the work you’ll do in BigQuery, you’ll normally have at least two delivery pipelines running — one for the actual objects in BigQuery and the other to keep the data staging, transforming, and updated as intended within the change-data-capture flows. Note that you can use most existing tools for your Continuous Integration / Continuous Deployment (CI/CD) pipeline — one of the benefits of using an open system like BigQuery. But, if your organization is new to CI/CD pipelines, this is a great opportunity to gradually gain experience. A good place to start is to read our guide for setting up a CI/CD pipeline for your data-processing workflow.
When it comes to access and security, most end-users will only have access to the final version of the BigQuery views. While row and column-level security can be applied, as in the SAP source system, separation of concerns can be taken to the next level by splitting your data across different Google Cloud projects and BigQuery datasets. While it’s easy to replicate data and structures across your datasets, it’s a good idea to define the requirements and naming conventions early in the design process so you set it up properly from the start.
Start driving faster and more insightful analytics
The best piece of advice we can give you is this: Try it yourself. Anyone with SQL knowledge can get started using the free BigQuery tier. New customers get $300 in free credits to spend on Google Cloud during the first 90 days. All customers get 10 GB storage and up to 1 TB queries/month, completely free of charge. In addition to discovering the massive processing capabilities, embedded machine learning, multiple integration tools, and cost benefits, you’ll soon discover how BigQuery can simplify your analytics tasks.
If you need additional assistance, our Google Cloud Professional Services Organization (PSO) and Customer Engineers will be happy to help show you the best path forward for your organization. For anything else, contact us at cloud.google.com/contact.
How Arvind Fashions Ltd leads the fashion industry with powerful data analytics on BigQuery

4111
Of your peers have already read this article.
3:30 Minutes
The most insightful time you'll spend today!
Arvind Ltd has been in the apparel industry for more than 90 years, with its retail powerhouse Arvind Fashions Ltd being the backbone of well-known names in the retail fashion industry in India.
Arvind Fashions Ltd (Arvind) has seen significant growth in its portfolio with new franchises being added every year. The six high conviction brands include Tommy Hilfiger, Calvin Klein, Sephora, Arrow, U.S. Polo Assn. & Flying Machine.
To secure a foundation for future growth, the company has embarked on a digital transformation (DX) journey, focusing on profitability and improving the customer experience. The key objectives for Arvind’s DX is to unlock the value of existing applications, gain new insights, and build a solid workflow with resilient systems.
Getting Google Cloud to address the challenges around insights & analytics was a natural step forward, since Arvind had already formed a relationship with Google Cloud, starting with its productivity and collaboration tools during the pandemic.
Key Challenges
Arvind’s enterprise applications estate is a mix of SAP, Oracle POS, logistics management systems and other applications. Having so many different applications made it a challenge for the company to bring all of this data together to drive retail insights and at the same time maintain the freshness of its products.
As a case in point, the existing sales reporting and inventory reconciliation process had been enabled by a mix of automated and semi-automated desktop applications. There were challenges to scale the infrastructure in order to process large amounts of data at a low latency.
The synchronization of master data across functions was critical to build the data platform that provides consistent insights to multiple stakeholders across the organization.
Solution Approach – Modern Data Platform
There are several ways to solve the challenges above and do more by building a modern data analytics platform. For example, using a data lake based approach that builds use case by use case, hybrid data estates and so on. Regardless of the approach, it is important to define the solution based on certain principles.
In Arvind’s scenario, the key business principles considered are that data platforms should support Variety, Variability, Velocity and Volume. Each of these 4 V’s are critical business pivots to successful fashion retailing. Variety in SKU’s to deal with myriad fashion trends every season, Variability in shopping footfalls due to different festivities, weekends and special occasions, Velocity to be agile and responsive to customer needs, and Volumes of data that bring richer insights.
This is where Google BigQuery enabled data platform comes in, as it is able to meet the needs above.
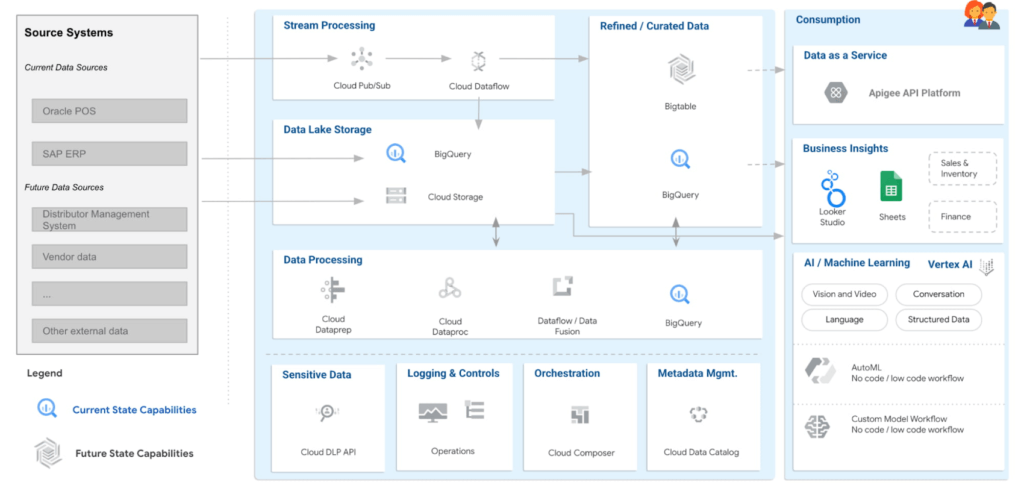
Solution Architecture – Current Capabilities & Future Vision
BigQuery is the mothership of the data and analytics platform on Google Cloud. Its serverless construct ensures that data engineering teams focus only on insights & analytics. Storage and compute is decoupled and can be independently scaled. BigQuery has been leveraged to service both the raw as well as the curated data zones.
With BigQuery procedures, it is possible to process the data natively within the data warehouse itself. Procedures have been leveraged to process the data in a low latency manner with the familiar SQL.
But then what happens to advanced analytics and insights? With simplicity being our key guiding principle, BigQuery machine learning ensures that data analysts can create, train and deploy analytics models even with complex requirements. It can also consume data from Looker Studio, which is seamlessly integrated with BigQuery.
Here are the key principles and highlights of the data platform that have been achieved:
- Simple, yet exhaustive – We needed a solution with vast technical capabilities such as data lake & data warehouse, data processing, data consumption, analytics amongst others. And at the same time it needed to be simple to implement and run ongoing operations.
- Agility – High quality analytics use cases typically require a significant amount of time, effort and skill set. While building a simple solution we ensured that the selection of technology services ensured agility in the long term.
- Security – An organization can be truly successful if the insights and analytics operations are democratized. But while data is made available to a wider community, we need to ensure data governance and security.
- Ease of operations – Data engineering teams spend a lot of time doing infrastructure setting and management operations. With BigQuery, teams can put in more effort on building the data pipelines and models to feed into analytics instead of worrying about the infrastructure operations.
- Costs – Decoupling storage and compute allows for flexible pricing. A pay-as-you-go model is the ideal solution to managing costs.
Business Impact
The ingestion frequency of the store level inventory (~800 stores) has now been changed to daily. With the additional data volumes and processing the scaling on BigQuery has been seamless. There are new processes and dashboards to address the reconciliation and root cause analysis. Operational efficiencies have improved leading to better productivity and turn around time of critical processes.
The discrepancies in various reconciliation activities have drastically reduced by an order of magnitude of 300X due to the capabilities offered by the data platform. Not only is it possible to identify discrepancies but the data platform has also enabled in identifying the root causes for the same as well.
Arvind Fashions Ltd have also been able to enhance some of the existing business processes and systems with insight from the data platform.
It’s going to be an exciting journey for Arvind Fashions Ltd and Google Cloud. There are several initiatives ready for kick off such as getting more apps on the edge devices, warehouse analytics, advanced customer data platforms, predicting the lifecycle of designs, style codes and other exciting initiatives.

1283
Of your peers have already downloaded this article
4:30 Minutes
The most insightful time you'll spend today!
Google Cloud’s managed database services can help you innovate faster and reduce operational overhead. The migration tools and resources included in this whitepaper will help you plan your migration.
This whitepaper provides guidance on:
- Managing services for maximum compatibility with your workloads
- Leveraging services that are compatible with the most popular commercial and open source engines, such as MySQL, PostgreSQL, and Redis
- Using robust tools and services to make migrations simple, secure, and fast with minimal downtime
- Understanding the value of using Google Cloud’s managed database services
More Relevant Stories for Your Company

Google Introduces BigQuery Connector for SAP to Power Customers’ Data Analytics Strategy
Google Cloud has a genuine passion for solving technology problems that make a difference for our customers. With the release of our BigQuery Connector for SAP, we're taking a another big step towards solving a major challenge for SAP customers with a quick, easy, and inexpensive way to integrate SAP data

How Data Teams in EdTech Firms Make Most of the Educational Data at All Levels
Education data can inform strategy, enhance both teaching and learning, and help us better understand customer needs. But that data is only as useful as an organization’s ability to access, analyze, and act upon it. Education Technology (EdTech) companies with a strong data warehouse management policy can help to make

2022 Healthcare Trends: Healthcare Data, M&As, Better Patient Care, AI in Drug Development & Strategic Partnerships
The COVID-19 pandemic continues to push the healthcare and life sciences industry in entirely new ways. In record time, we’ve witnessed public health officials, vaccine developers, equipment manufacturers, and essential workers take life saving actions—regularly putting their own lives at risk—to respond to the exceptional challenges of our time. Yet

How Connected-Stories Uses BigQuery and AI/ML to Craft Personalized Ad Experiences
Editor’s note: The post is part of a series highlighting our awesome partners, and their solutions, that are Built with BigQuery In the field of producing engaging video content such as ads, many marketers ignore the power of data to improve their creative efforts to meet the consumers' need for
