





11 Reasons Why Developers and DB Admins in APAC Are Moving to Google Cloud SQL From AWS RDS

4671
Of your peers have already read this article.
1:45 Minutes
The most insightful time you'll spend today!
We wanted to find out which of the most popular database services on two of the biggest cloud provider (AWS and Google), developers preferred to use.
More specifically, we wanted views from enterprises in the region (it’s hard to impossible to find data that’s specific to India.)
To simplify our quest, we looked at the most popular database services on AWS and then looked at the equivalent Google Cloud offering.
That’s how we came to pit AWS RDS and Google Cloud SQL.
For the uninitiated: Cloud SQL is a fully managed database service that makes it easy to set up and manage your relational PostgreSQL, MySQL, and SQL Server databases in the cloud.
It is ideal for: WordPress, backends, game states, CRM tools, MySQL, PostgreSQL, and Microsoft SQL Servers.
Based on real feedback from companies in the APAC region, there are 11 reasons why Google Cloud SQL is better.
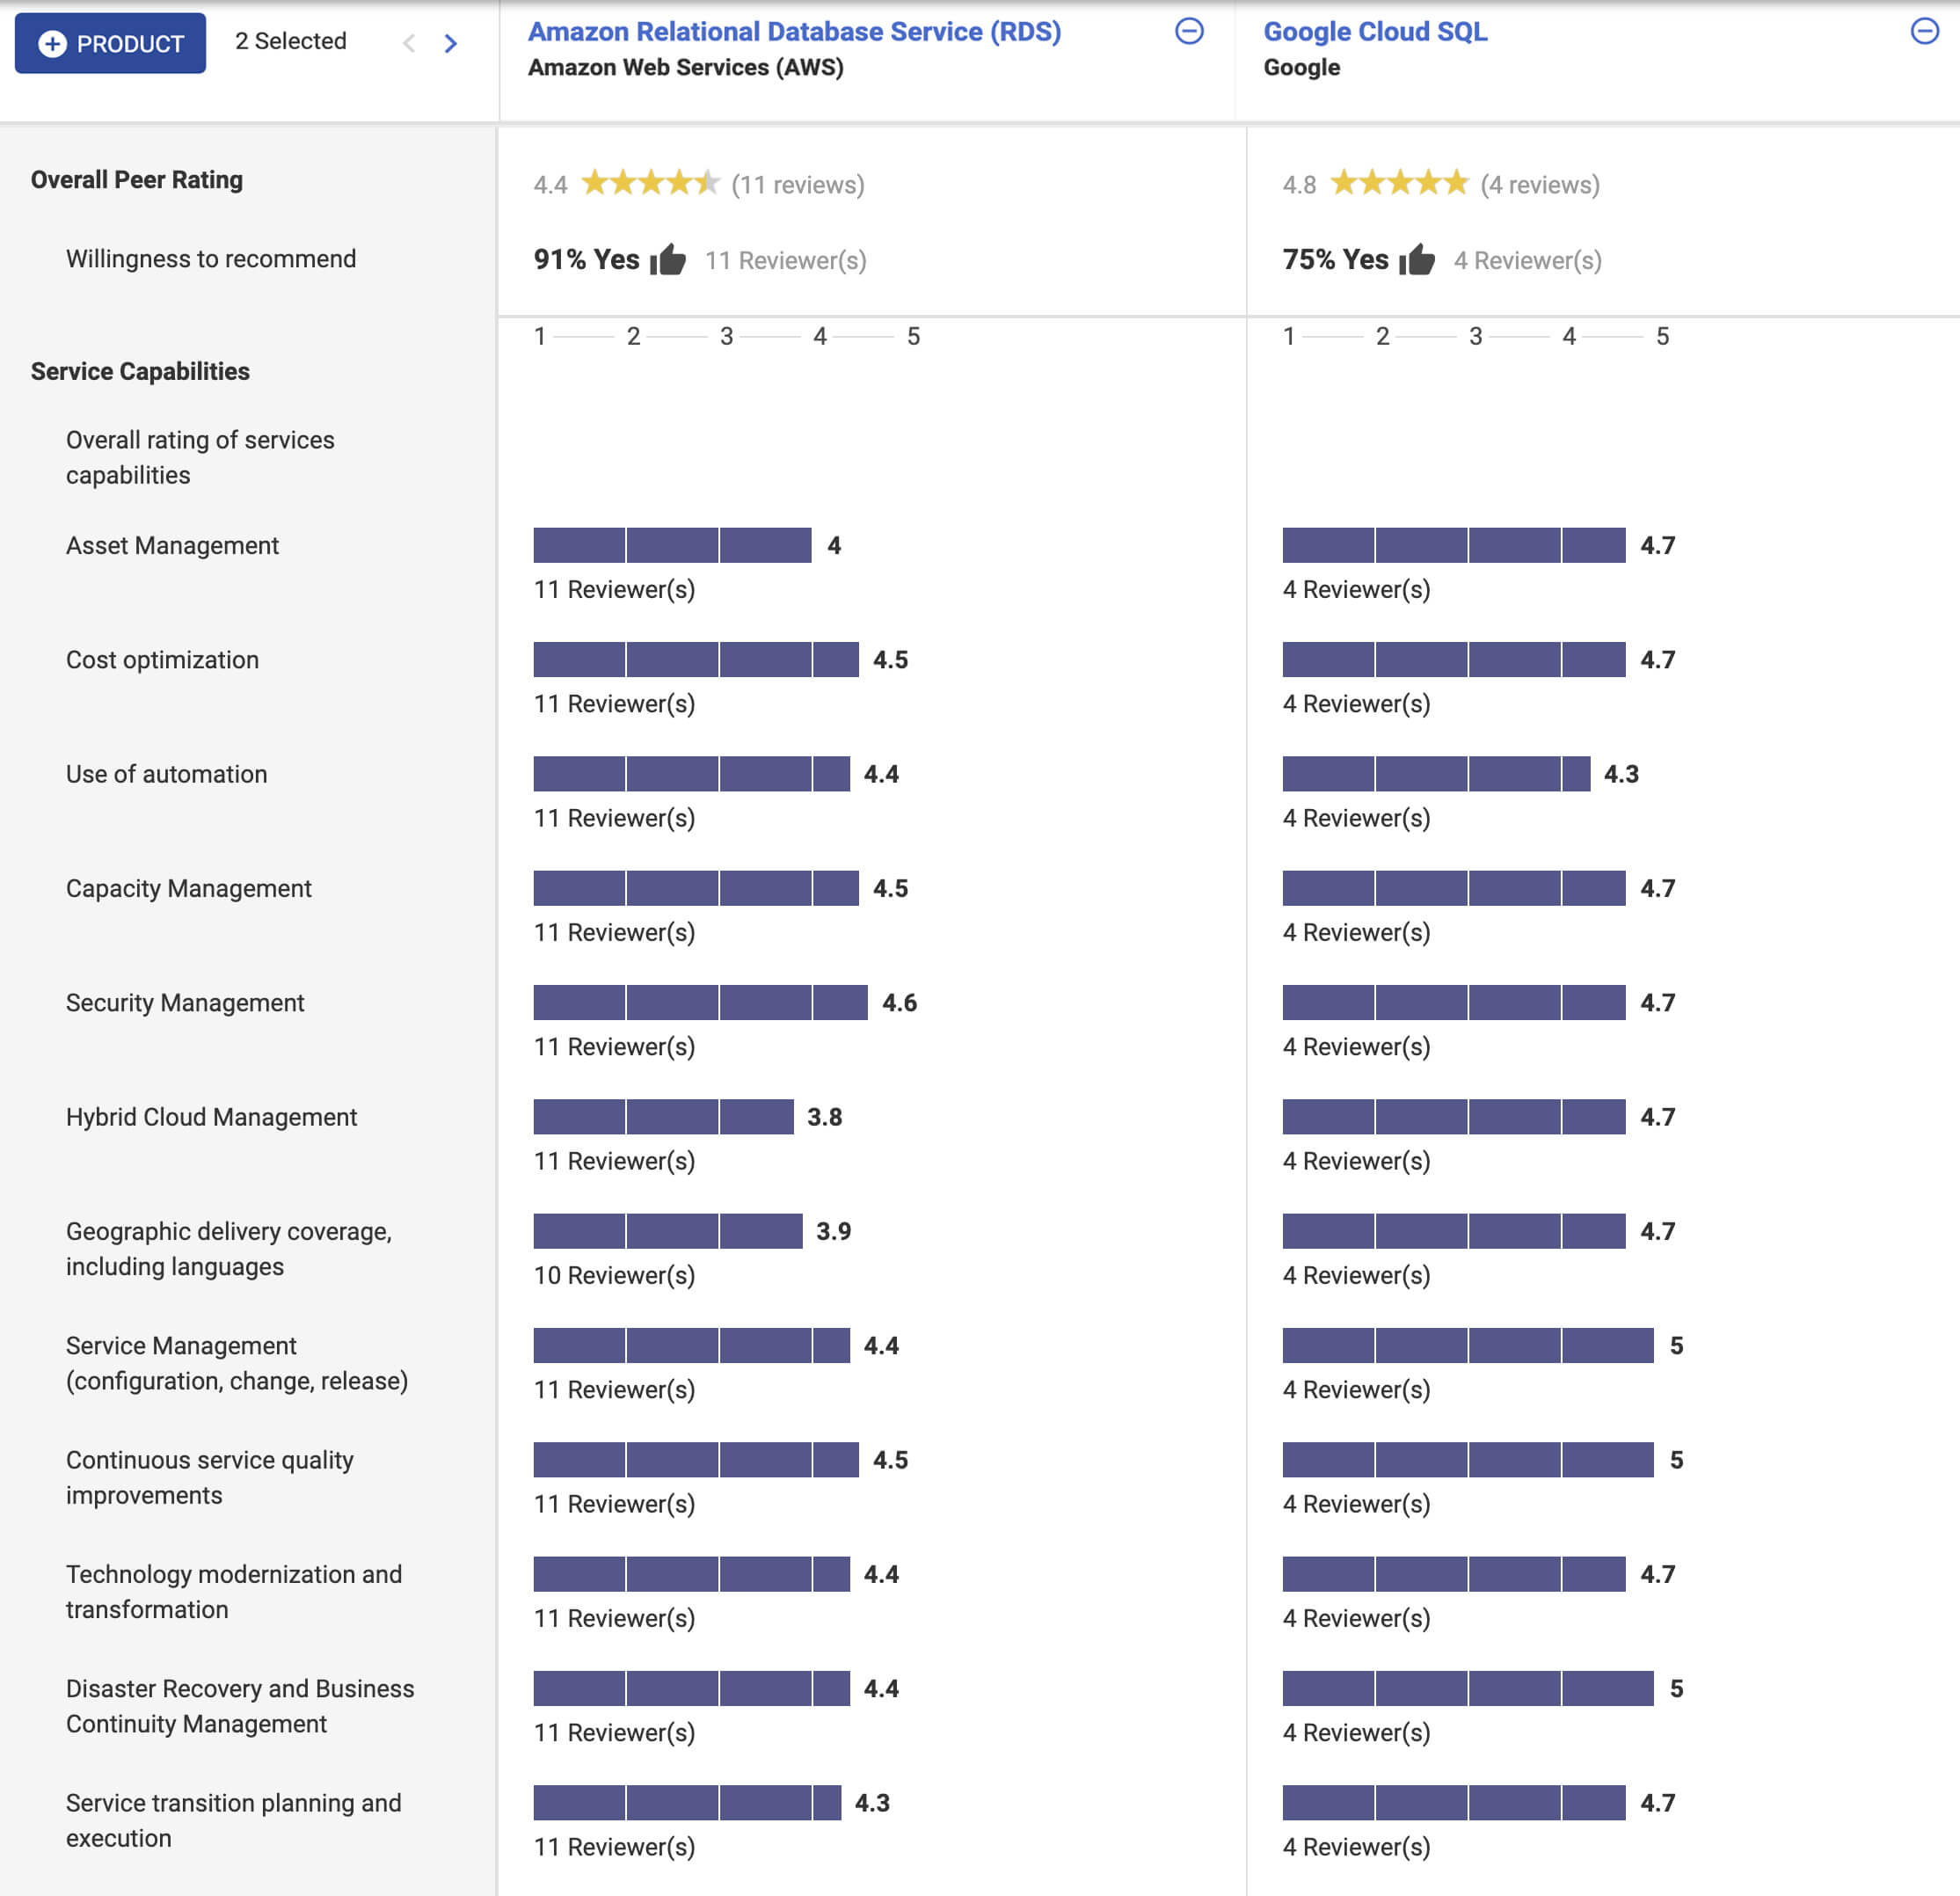
In addition, according to Stackshare and ITcentralstation, the biggest reason developers prefer Google Cloud SQL? Because it’s fully managed, easy to set up, easy to manage and it’s really scalable.
As one user says:
Its most valuable feature is that it’s scalable. I can start off with a base of a lot of data and move as much as I want and it’s the same as if asked to do a lot of infrastructure changes… it’s easy to use, simple, and user-friendly. The setup was straightforward. Just a couple of clicks, and we were done. My suggestion to anyone thinking about this solution is to jump into it head-first!
BigQuery ML for Sentiment Analysis: How to Make the Most of Your Data

1803
Of your peers have already read this article.
4:30 Minutes
The most insightful time you'll spend today!
Introduction
We recently announced BigQuery support for sparse features which help users to store and process the sparse features efficiently while working with them. That functionality enables users to represent sparse tensors and train machine learning models directly in the BigQuery environment. Being able to represent sparse tensors is a useful feature because sparse tensors are used extensively in encoding schemes like TF-IDF as part of data pre-processing in NLP applications and for pre-processing images with a lot of dark pixels in computer vision applications.
There are numerous applications of sparse features such as text generation and sentiment analysis. In this blog, we’ll demonstrate how to perform sentiment analysis with the space features in BigQuery ML by training and inferencing machine learning models using a public dataset. This blog also highlights how easy it is to work with unstructured text data on BigQuery, an environment traditionally used for structured data.
Using sample IMDb dataset
Let’s say you want to conduct a sentiment analysis on movie reviews from the IMDb website. For the benefit of readers who want to follow along, we will be using the IMDb reviews dataset from BigQuery public datasets. Let’s look at the top 2 rows of the dataset.
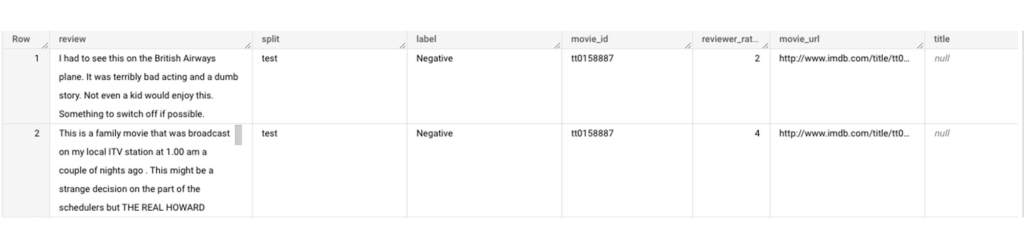
Although the reviews table has 7 columns, we only use reviews and label columns to perform sentiment analysis for this case. Also, we are only considering negative and positive values in the label columns. The following query can be used to select only the required information from the dataset.
SELECT
 review,
 label,
FROM
 `bigquery-public-data.imdb.reviews`
WHERE
 label IN ('Negative', 'Positive')
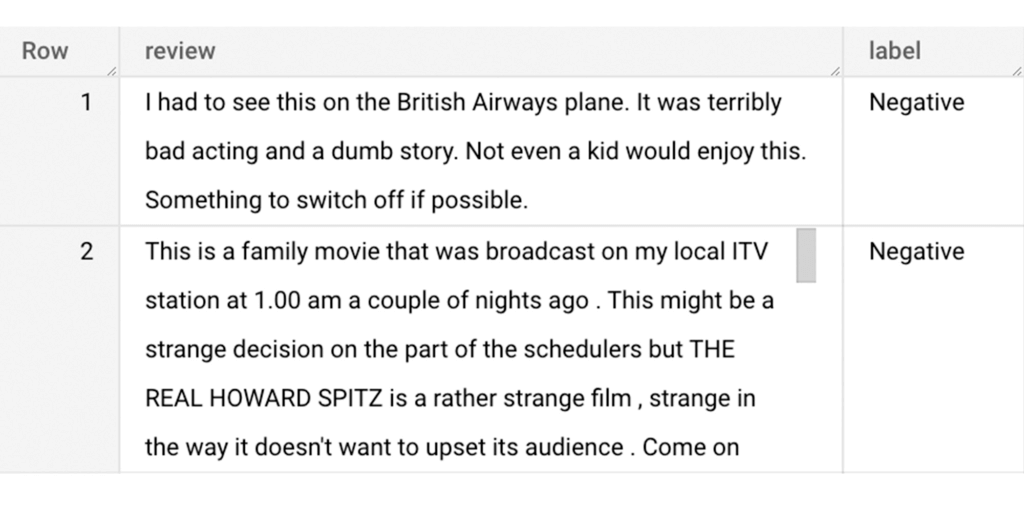
The top 2 rows of the result is as follows:
Methodology
Based on the dataset that we have, the following steps will be carried out:
- Build a vocabulary list using the review column
- Convert the review column into sparse tensors
- Train a classification model using the sparse tensors to predict the label (“positive” or “negative”)
- Make predictions on new test data to classify reviews as positive or negative.
Feature engineering
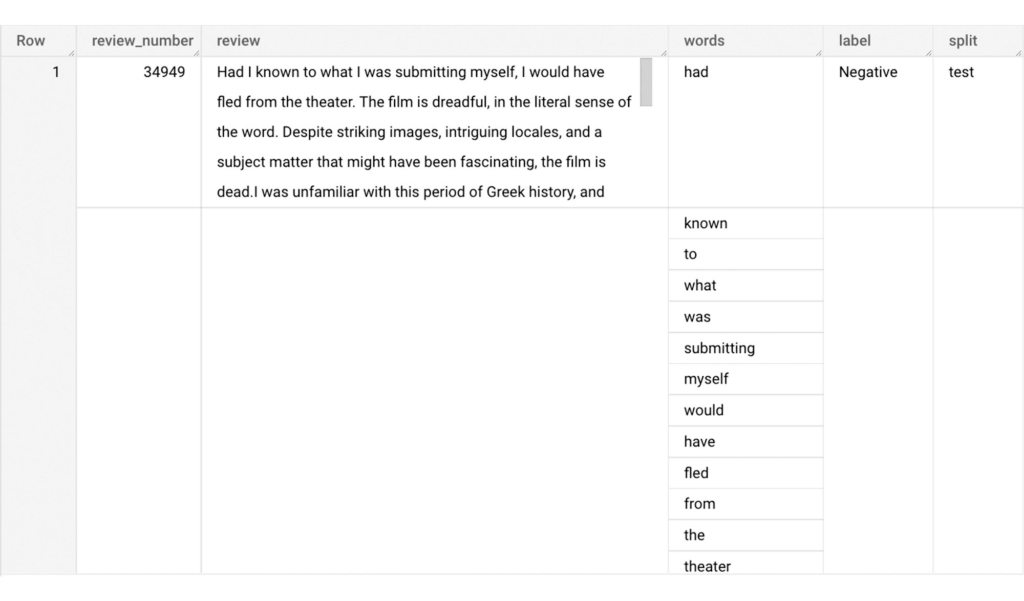
In this section, we will convert the text from the reviews column to numerical features so that we can feed them into a machine learning model. One of the ways is the bag-of-words approach where we build a vocabulary using the words from the reviews and select the most common words to build numerical features for model training. But first, we must extract the words from each review. The following code creates a dataset and a table with row numbers and extracted words from reviews.
-- Create a dataset named `sparse_features_demo` if doesn’t exist
CREATE SCHEMA IF NOT EXISTS sparse_features_demo;


-- Select unique reviews with only negative and positive labels
CREATE OR REPLACE TABLE sparse_features_demo.processed_reviews AS (
 SELECT
   ROW_NUMBER() OVER () AS review_number,
   review,
   REGEXP_EXTRACT_ALL(LOWER(review), '[a-z]{2,}') AS words,
   label,
   split
 FROM (
   SELECT
     DISTINCT review,
     label,
     split
   FROM
     `bigquery-public-data.imdb.reviews`
   WHERE
     label IN ('Negative', 'Positive')
 )
);
The output table from the query above should look like this:
The next step is to build a vocabulary using the extracted words. The following code creates a vocabulary including word frequency and word index from reviews. For this case, we are going to select only the top 20,000 words to reduce the computation time.
-- Create a vocabulary using train dataset and select only top 20,000 words based on frequency
CREATE OR REPLACE TABLE sparse_features_demo.vocabulary AS (
 SELECT
   word,
   word_frequency,
   word_index
 FROM (
   SELECT
     word,
     word_frequency,
     ROW_NUMBER() OVER (ORDER BY word_frequency DESC) - 1 AS word_index
   FROM (
     SELECT
       word,
       COUNT(word) AS word_frequency
     FROM
       sparse_features_demo.processed_reviews,
       UNNEST(words) AS word
     WHERE
       split = "train"
     GROUP BY
       word
   )
 )
 WHERE
   word_index < 20000 # Select top 20,000 words based on word count
);
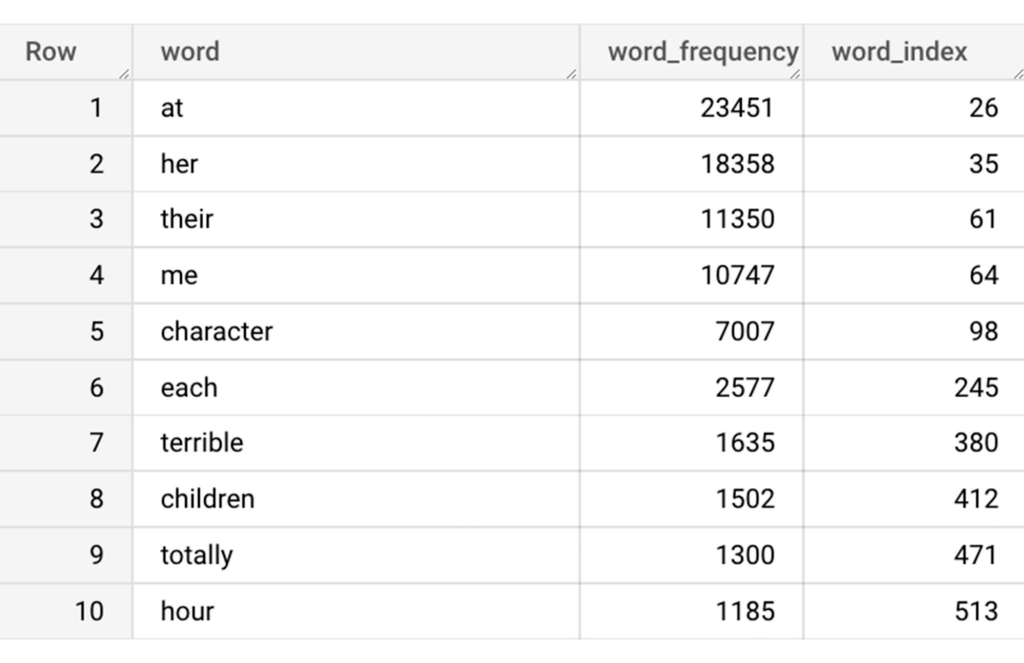
The following shows the top 10 words based on frequency and their respective index from the resulting table of the query above.
Creating a sparse feature
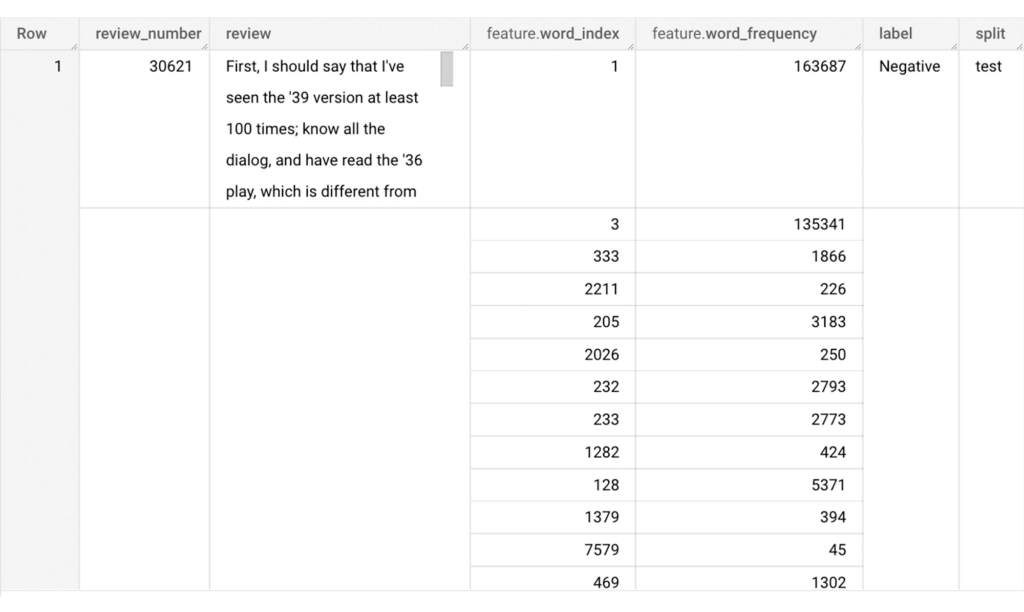
Now we will use the newly added feature to create a sparse feature in BigQuery. For this case, we aggregate word_index and word_frequency in each review, which generates a column as ARRAY[STRUCT] type. Now, each review is represented as ARRAY[(word_index, word_frequency)].
-- Generate a sparse feature by aggregating word_index and word_frequency in each review.
CREATE OR REPLACE TABLE sparse_features_demo.sparse_feature AS (
 SELECT
   review_number,
   review,
   ARRAY_AGG(STRUCT(word_index, word_frequency)) AS feature,
   label,
   split
 FROM (
   SELECT
     DISTINCT review_number,
     review,
     word,
     label,
     split
   FROM
     sparse_features_demo.processed_reviews,
     UNNEST(words) AS word
   WHERE
     word IN (SELECT word FROM sparse_features_demo.vocabulary)
 ) AS word_list
 LEFT JOIN
   sparse_features_demo.vocabulary AS topk_words
   ON
     word_list.word = topk_words.word
 GROUP BY
   review_number,
   review,
   label,
   split
);
Once the query is executed, a sparse feature named `feature` will be created. That `feature` column is an `ARRAY of STRUCT` column which is made of `word_index` and `word_frequency` columns. The picture below displays the resulting table at a glance.
Training a BigQuery ML model
We just created a dataset with a sparse feature in BigQuery. Let’s see how we can use that dataset to train with a machine learning model with BigQuery ML. In the following query, we will train a logistic regression model using the review_number, review, and feature to predict the label:
-- Train a logistic regression classifier using the data with sparse feature
CREATE OR REPLACE MODEL sparse_features_demo.logistic_reg_classifier
 TRANSFORM (
   * EXCEPT (
       review_number,
       review
     )
 )
 OPTIONS(
   MODEL_TYPE='LOGISTIC_REG',
   INPUT_LABEL_COLS = ['label']
 ) AS
 SELECT
   review_number,
   review,
   feature,
   label
 FROM
    sparse_features_demo.sparse_feature
 WHERE
   split = "train"
;
Now that we have trained a BigQuery ML Model using a sparse feature, we evaluate the model and tune it as needed.
-- Evaluate the trained logistic regression classifier
SELECT * FROM ML.EVALUATE(MODEL sparse_features_demo.logistic_reg_classifier);
The score looks like a decent starting point, so let’s go ahead and test the model with the test dataset.

-- Evaluate the trained logistic regression classifier using test data
SELECT * FROM ML.EVALUATE(MODEL sparse_features_demo.logistic_reg_classifier,
 (
   SELECT
     review_number,
     review,
     feature,
     label
   FROM
     sparse_features_demo.sparse_feature
   WHERE
     split = "test"
 )
);
The model performance for the test dataset looks satisfactory and it can now be used for inference. One thing to note here is that since the model is trained on the numerical features, the model will only accept numeral features as input. Hence, the new reviews have to go through the same transformation steps before they can be used for inference. The next step shows how the transformation can be applied to a user-defined dataset.
Sentiment predictions from the BigQuery ML model
All we have left to do now is to create a user-defined dataset, apply the same transformations to the reviews, and use the user-defined sparse features to perform model inference. It can be achieved using a WITH statement as shown below.
WITH
 -- Create a user defined reviews
 user_defined_reviews AS (
   SELECT
     ROW_NUMBER() OVER () AS review_number,
     review,
     REGEXP_EXTRACT_ALL(LOWER(review), '[a-z]{2,}') AS words
   FROM (
     SELECT "What a boring movie" AS review UNION ALL
     SELECT "I don't like this movie" AS review UNION ALL
     SELECT "The best movie ever" AS review
   )
 ),


 -- Create a sparse feature from user defined reviews
 user_defined_sparse_feature AS (
   SELECT
     review_number,
     review,
     ARRAY_AGG(STRUCT(word_index, word_frequency)) AS feature
   FROM (
     SELECT
       DISTINCT review_number,
       review,
       word
     FROM
       user_defined_reviews,
       UNNEST(words) as word
     WHERE
       word IN (SELECT word FROM sparse_features_demo.vocabulary)
   ) AS word_list
   LEFT JOIN
     sparse_features_demo.vocabulary AS topk_words
     ON
       word_list.word = topk_words.word
   GROUP BY
     review_number,
     review
 )


-- Evaluate the trained model using user defined data
SELECT review, predicted_label FROM ML.PREDICT(MODEL sparse_features_demo.logistic_reg_classifier,
 (
   SELECT
     *
   FROM
     user_defined_sparse_feature
 )
);
Here is what you would get for executing the query above:
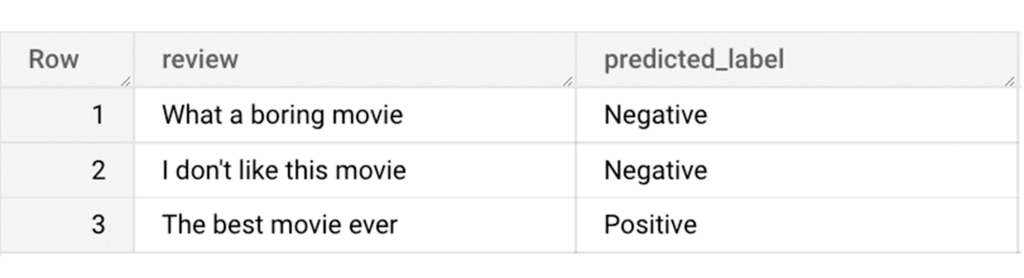
And that’s it! We just performed a sentiment analysis on the IMDb dataset from a BigQuery Public Dataset using only SQL statements and BigQuery ML. Now that we have demonstrated how sparse features can be used with BigQuery ML models, we can’t wait to see all the amazing projects that you would create by harnessing this functionality.
If you’re just getting started with BigQuery, check out our interactive tutorial to begin exploring.
How TapClicks’ Google Cloud Migration Makes Life Easy for Marketers

8525
Of your peers have already read this article.
2:00 Minutes
The most insightful time you'll spend today!
Editor’s note: In this blog post we learn how TapClicks migrated to Google Cloud to offer their marketing customers a unified platform for data management, operations, insights, and analysis.
TapClicks is a smart marketing cloud, powered by data, that unifies our customer’s marketing. By choosing to migrate our core applications last year to Google Cloud, we cut costs, solved data-sharing concerns for our customers, and opened our stack up to a new ecosystem of possibilities.
The core problem that we’re solving for our customers is how to manage their marketing infrastructures data and operations. Life isn’t easy for marketers now. There are 7,000 different vendors servicing this space today – creating much complexity between digital agencies, media, and brands. Marketers face challenges in navigating all of these systems, logging in and out, understanding pacing goals, and managing the flow of marketing data so they can analyze and report internally as well as to their clients at scale.
We unify omnichannel campaign data (250 API connectors and 6000 Smart Connectors ™ ) from a plethora of marketing sources on an automated data warehousing solution, creating simplicity for organizations. Over 4,000 agencies, media companies, and brands use our Marketing Operations and Data Management Platform, which imports data at scale and creates an automatic data warehouse on Google Cloud. Teams can also leverage TapClicks, like our world class Facebook connector, to import data directly into Google Data Studios. Beyond importing and storing, we also provide data exporting to other Google solutions like Google Data Studio and Google Sheets. We also create interactive dashboards that let stakeholders and clients analyze their data, as well as automated, multi-channel reports that go out to clients at specified times. So channel comparisons, optimizations, attribution, and calculations are easily performed. Some of our customers are able to generate hundreds of thousands of individual reports and dashboards for their clients.
Although we may be best known for our reporting and analytics, we also empower teams managing the marketing operations workflow from customers and internal stakeholders, especially at scale. Our user-friendly, configurable system helps manage their orders and campaigns. Through automation of this process, we deliver tremendous amounts of efficiency, time saving, cost savings, and reduction of errors. The combination of these solutions makes up our unified platform, with additional capabilities like marketing intelligence that offers competitive and brand-level analysis. This is a disruptive solution in use by all leading media companies, agencies and many brands.
Partnering for possibilities
We faced a few challenges with our original tech stack, which included a mix of the leader in web services revenue, leaders in high performance data warehousing, as well as vendors on bare metal servers.
- One challenge was around costs, which were growing.
- Second, many of our customers work with multiple brands, and are very hesitant to share their data with the leader in web services, who’s often viewed as their competitor.
- Third, these vendors are more focused on their own revenue rather than a true long term partnership that would enable their customers to enjoy similar success as they have experienced.
When looking at other cloud providers, Google Cloud emerged for us as the front runner. They were competitive on costs, and their native Kubernetes support was superior— a big selling point for our DevOps team. There’s also a movement in the marketing and advertising industry away from AWS toward Google Cloud because of the data-sharing concern. Finally, most of our customers are already using Google Cloud tools, so there’s brand recognition and familiarity there, and easier integrations with their own systems.
Migrating to Google Cloud
Our migration, which took about five months, involved moving a significant chunk of our infrastructure, including our core applications, using Google Kubernetes Engine (GKE). In our legacy architecture, each of our clients was assigned to one of our virtual machines (VMs), and there was a lot of unused capacity because we had to provision for the max usage. We appreciated GKE’s cloud native capabilities, especially autoscaling, a huge benefit for our web application. We have varying usage patterns during the day, and though our application is mostly used during business hours, there are also days in the month of higher usage, and autoscaling saves us time and costs. GKE also makes deployments much easier, and we anticipate a lot of benefits there for our developer environments. We’ve moved some of our microservices into GKE and plan to move more in the future. All in all, we were able to migrate our core products and the bulk of our AWS spend successfully to Google Cloud.
We also moved from our other vendors Relational Database Service (RDS) to running MySQL on our own VMs on Google Cloud, which gives us more flexibility in terms of settings and fine tuning. We’re still trying to find the best mix as we’re modernizing our infrastructure, and we took this opportunity to migrate from MySQL 5.7 to 8.0.
Our next stage is exploring more of the capabilities and services of Google Cloud, including BigQuery, which we’re considering for our own data warehouse. The fact that we could also run Snowflake on Google Cloud, if needed, was another selling point for our migration.
We’re especially interested in BigQuery ML’s machine learning and natural language processing capabilities, which enabled better predictive insights. Our customers want insights from their campaigns— which are working, which are paying off, where should they invest next? Using our platform, they’re looking not only to generate reporting, but also identify opportunities to improve campaign performance. We plan to use AI and ML to improve those capabilities, so that our customers can seamlessly unlock insight and intelligence from their marketing data and campaigns.
Double-clicking on Google Cloud
For us, being able to deeply leverage and partner with Google Cloud to deliver those solutions on a single stack is critical, and we think our customers will love it. We see TapClicks and Google Cloud partnering at a level beyond what you typically see in a cloud provider relationship. Already, fifty percent of our company is working with various Google Cloud solutions, and we envision TapClicks and Google Cloud as extensions of each other, providing a single, powerful platform solution.
Google Cloud understands the partnership concept, and their team was able to shine a light on their services and what they could bring to the table. Compared to our previous experiences, dealing with the Google Cloud team has been a true pleasure. Now that we’ve migrated, we’re ready to take our next steps into the services available to us in the Google Cloud ecosystem, and the problems we’ll continue to solve for our customers. Learn more about TapClicks and BigQuery ML.
New Enterprise Capabilities and Changes to Cloud Spanner Reduces Cost of Running Workloads by 90 Percent

5387
Of your peers have already read this article.
3:00 Minutes
The most insightful time you'll spend today!
Customers love Cloud Spanner because it gives them the benefits of relational semantics and SQL while also delivering the scale and availability of non-relational databases. Many of these customers want to move even more of their work to Spanner, and have requested smaller instance sizes to support development, testing and small production workloads. We’re happy to announce that they’ll soon get what they asked for: more granular instance sizing is coming to Spanner.
Granular instance sizing will be available in Public Preview soon. With this feature, you can run workloads on Spanner at as low as 1/10th the cost of regular instances, equating to approximately $65/month.
In addition, we are launching new enterprise capabilities to break down operational silos for real-time insights and provide greater database observability to developers:
- Datastream, now in public preview, is a change data capture (CDC) service that allows enterprises to synchronize data across heterogeneous databases and applications. With Spanner support in Datastream, users will be able to stream data from MySQL or Oracle to Spanner reliably and with minimal latency.
- BigQuery federation to Spanner (coming soon) lets users query transactional data residing in Spanner, from BigQuery, without moving or copying data.
- Key Visualizer, available now in public preview, provides interactive monitoring so developers can quickly identify trends and usage patterns in Spanner.
Democratizing access with more granular instance sizing
Today, customers provision Spanner instances by specifying the number of nodes they need to run their workloads. Each node can provide up to 10,000 queries per second (QPS) of reads or 2,000 QPS of writes (writing single rows at 1 KB of data per row) and 2 TB of storage. A Spanner node is replicated across 3 zones for regional instances, and 5 or more zones for multi-regional instances. The choice of node count determines the amount of serving and storage resources that are available to the databases in a given instance.
Historically, the most granular unit for provisioning resources on Spanner has been one node. To enable more granular control, we are introducing Processing Units (PUs); one Spanner node is equal to 1,000 PUs. Customers can now provision in batches of 100 PUs, and get a proportionate amount of compute and storage resources. This will allow teams to run smaller workloads on Spanner at much lower cost. With this feature, customers can start at 100 PUs and scale up as needed in batches of 100 PUs, to up to 1,000 PUs (1 node), all with zero downtime. Subsequently, customers can continue to scale up by adding more nodes, just like what they do today. Customers do have the choice of using either PUs or nodes to provision resources within workloads, when those workloads occupy multiple nodes of capacity.
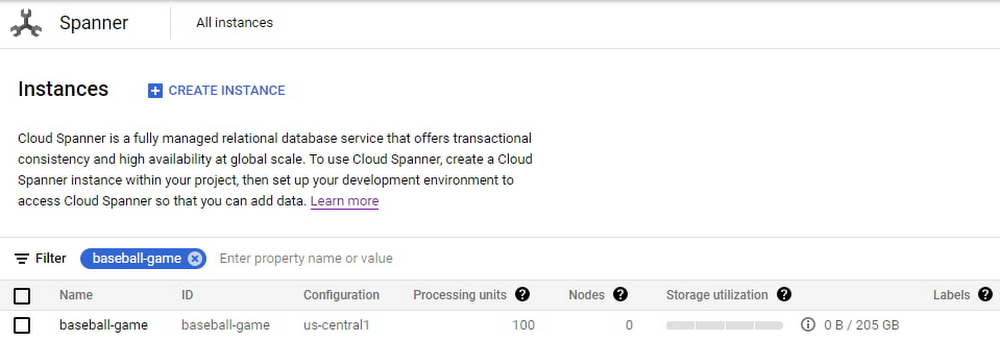
To illustrate with an example, let’s say a game developer creates a Spanner instance called “baseball-game” in us-central1, with 100 PU compute capacity at $65/month price.
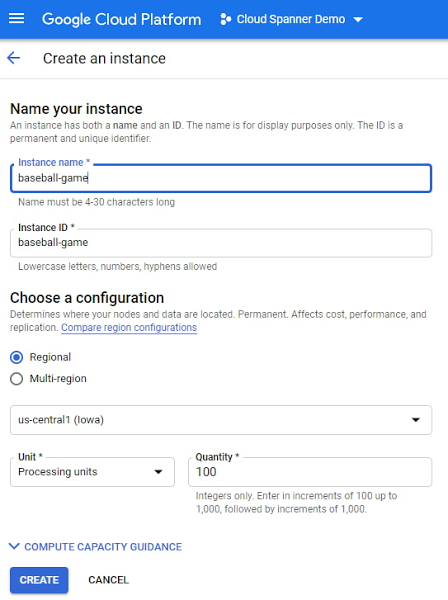
As you can see below, proportional maximum storage of 205 GB is assigned to the 100 PU instance.
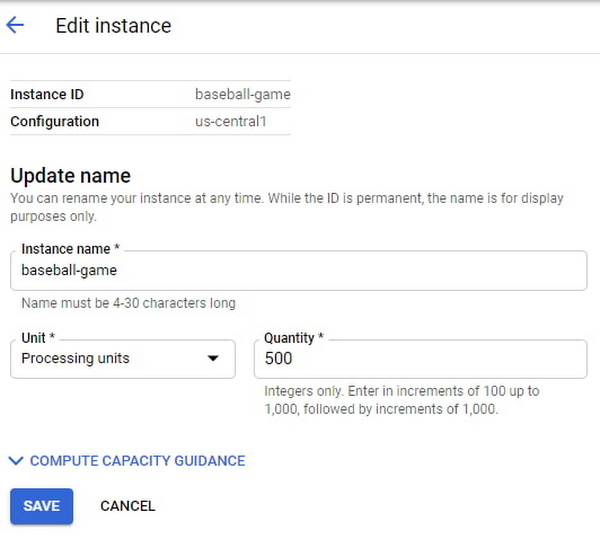
Once the game starts becoming popular and resource demands increase, the user edits the instance to increase the compute capacity to 500 PUs with proportional maximum 1 TB of storage.
The game grows in popularity, and the gaming company prepares to launch a much-awaited capability in the game. Anticipating a sharp increase in usage at launch day, the game developers increase the compute capacity to 3,000 PUs. Compute capacity assigned to the instance over a period of time can be viewed in Cloud Monitoring graphs:

Request Access
You can request early access to granular instance sizing feature by filling this form.
Breaking down operational silos with Datastream CDC and BigQuery federation
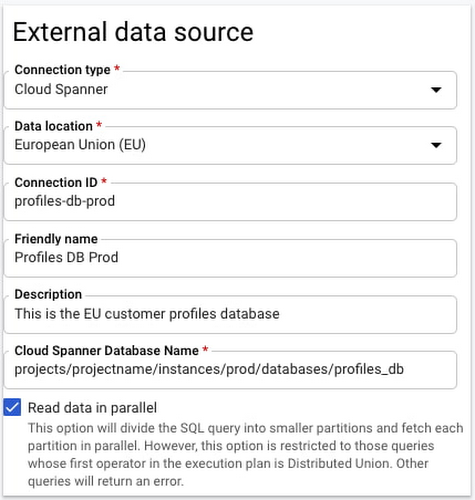
BigQuery Federation. BigQuery has made analytics easy by bringing together data from multiple sources for seamless analysis. Soon you’ll also be able to analyze data in Spanner directly in BigQuery. With Spanner’s BigQuery federation, you’ll be able to instantly query data residing in Spanner in real-time without moving or copying the data. Simply set up the Spanner as an external data source in BigQuery, as shown below.
Change Data Capture ingest. Now in public preview, Datastream lets you stream change data into Google Cloud from MySQL and Oracle databases. As of today, you can ingest this change data directly into Spanner using a built-in Dataflow template. This lets you migrate data from MySQL and Oracle databases into Spanner in near-real time.
Understanding performance and resource usage with Key Visualizer
Key Visualizer is a new interactive monitoring tool that lets developers and administrators analyze usage patterns in Spanner. It reveals trends and outliers in key performance and resource metrics for databases of any size, helping to optimize queries and reduce infrastructure costs. Designed for performance tuning and instance sizing, Key Visualizer is available today in public preview in the web-based Cloud Console for all Spanner databases at no additional cost. Learn more in the Key Visualizer blog.
Learn more
- To request early access to granular instance sizing in Spanner, fill out this form.
- To get started with Spanner today, create an instance or try it out with a Spanner Qwiklab.
Unified, Flexible and Accessible: How Companies’ Data Help Them Achieve More on Google Cloud

4868
Of your peers have already read this article.
1:30 Minutes
The most insightful time you'll spend today!
As the volume of data that people and businesses produce continues to grow exponentially, it goes without saying that data-driven approaches are critical for tech companies and startups across all industries. But our conversations with customers, as well as numerous industry commentaries, reiterate that managing data and extracting value from it remains difficult, especially with scale.
Numerous factors underpin the challenges, including access to and storage of data, inconsistent tools, new and evolving data sources and formats, compliance concerns, and security considerations. To help you identify and solve these challenges, we’ve created a new whitepaper, “The future of data will be unified, flexible, and accessible,” which explores many of the most common reasons our customers tell us they’re choosing Google Cloud to get the most out of their data.
For example, you might need to combine data in legacy systems with new technologies. Does this mean moving all your data to the cloud? Should it be in one cloud or distributed across several? How do you extract real value from all of this data without creating more silos?
You might also be limited to analyzing your data in batch instead of processing it in real-time, adding complexity to your architecture and necessitating expensive maintenance to combat latency. Or you might be struggling with unstructured data, with no scalable way to analyze and manage it. Again, the factors are numerous—but many of them accrue to inadequate access to data, often exacerbated by silos, and insufficient ability to process and understand it.
The modern tech stack should be a streaming stack that scales with your data, provides real-time analytics, incorporates and understands different types of data, and lets you use AI/ML to predictively derive insights and operationalize processes. These requirements mean that to effectively leverage your data assets:
- Data should be unified across your entire company, even across suppliers, partners, and platforms., eliminating organizational and technology silos.
- Unstructured data should be unlocked and leveraged in your analytics strategy.
- The technology stack should be unified and flexible enough to support use cases ranging from analysis of offline data to real-time streaming and application of ML without maintaining multiple bespoke tech stacks.
- The technology stack should be accessible on-demand, with support for different platforms, programming languages, tools, and open standards compatible with your employees’ existing skill sets.
With these requirements met, you’ll be equipped to maximize your data, whether that means discerning and adapting to changing customer expectations or understanding and optimizing how your data engineers and data scientists spend their time. In coming weeks, we’ll explore aspects of the whitepaper in additional blog posts—but if you’re ready to dive in now, and to steer your tech company or startup towards success by making your data better work for you, click here to download your copy, free of charge.
Case Study: When Database Choice Powers New Revenue-driving Product Features

4161
Of your peers have already read this article.
4:30 Minutes
The most insightful time you'll spend today!
Editor’s note: Streak makes a CRM add-on for Gmail, and recently adopted Cloud Spanner to take advantage of its scalability and SQL capabilities to implement a graph data model. Read on to learn about their decision, what they love about the system, and the ways in which it still needs work.]
Streak is a customer relationship management (CRM) tool built directly into Gmail. It is used for sales, marketing, hiring, and just about anything else you can think of.
We built it because out of the box, email is actually a really crummy team sharing system. By adding a layer of organization on top of email, Streak lets you add email threads directly into its spreadsheet view, making it useful as a workflow tool with capabilities including task creation, email template management, and easy data entry.
Streak has been integrated with G Suite (originally Google Apps For Your Domain) since its inception so when choosing a cloud, it made sense to colocate our server stack with Google Cloud.
Likewise, Streak was on Google App Engine from the start, and we slowly added other GCP services as the offerings improved or as our use cases became more complex.
In addition to App Engine, we use Google Kubernetes Engine to run a bunch of our compute workload, including both application servers and our offline processes like indexers and task queue consumers.
We use Cloud Dataflow for both streaming event processing and logs ETL, and BigQuery for all of our analytics queries. We use Cloud Pub/Sub for interacting with the Gmail watch API, as well as Stackdriver (logging, tracing, monitoring, errors) and OpenCensus to dig into any operational issues as they arise.
Then, on the database front, we recently started using Cloud Spanner, Google Cloud’s scalable relational database service. Before that, we stored most of our business data in Cloud Datastore, Google Cloud’s NoSQL document database.
Partially, that was historical, since Cloud Datastore was GCP’s only managed database when we wrote the Streak backend. And we’ve been very happy with how easy Cloud Datastore is to maintain. Between Google App Engine and Cloud Datastore, we’ve never had to have an explicit infrastructure on-call rotation.
But as more users rely on Streak to collaborate with larger and larger teams, we were feeling the pain of not having a fully relational database. We found ourselves having to manually join data in our application, which increased application latency and increased the time developers spent coding workarounds and debugging that complexity.
We found we needed two things out of our database: a scalable relational store and a graph store that could power next-gen Streak features. At the same time, we wanted a single database that could handle both use cases and wouldn’t increase our operational burden. This meant finding a managed service to give us more query flexibility, so we decided to give Cloud Spanner a try.
Of course, we didn’t want to migrate our existing stack to a new data platform without first testing it out (never a smart strategy). But since most of our existing data model required transactional updates with other entities, pulling out a single entity to test was challenging. We did have a feature in our pipeline that necessitated a graph data store and that was removed from our other data: our email metadata indexing system.
How your client software handles email metadata indexing can make or break the useability of a system. Think about how many times somebody forgets to reply-all or that you receive a forwarded thread with thirty emails in reverse-chronological order. Within our own inboxes, we rely on Gmail’s UI to nicely organize email threads, but that organization breaks down when working with a team or across organizational boundaries.
We decided to fix that in the Streak product by organizing metadata (i.e., headers but not message content) from users’ email by using Cloud Spanner as a graph database. Using a graph database lets us answer questions like “What are all the emails on this thread in the inboxes of everybody on my team?” and “Who on my team has previously talked with the organization that this prospect works at?”
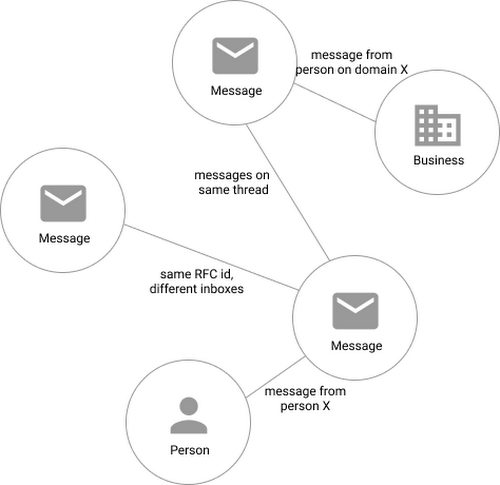
In our model, the nodes of the graph are either an email message, a person (email address) or a company (a domain). Then we have four different types of “edges”— properties by which nodes in a graph connect to one another:
- Message to message (thread): messages that are on the same thread have an edge between them. The reason we do this is because we want to show users a list of threads to answer their questions, not messages, so we need to be able to get the spanning set of messages.
- Message to message (same RFC id): A core value proposition of Streak is being able to see the “unified” version of a thread that shows each person on a team’s version of the email thread. To make sure we are getting each user’s version of a thread when we issue a query, there needs to be an edge between a message in the queryer’s inbox and the same message in their team’s inbox. In case you’re curious, Streak uses the RFC message id to determine that two messages across inboxes are actually the same.
- Email address to message: a message has an edge to an email address if it was either the from, to, cc, or bcc on the message. This edge is crucial for queries that start with: “Show me all threads between this person and our team.”
Domain to message: a message has an edge to a domain if the domain is present in any of the from, to, cc, or bcc addresses on the message. This edge is similarly used for queries that start with “Show me all threads between this company and our team.”
Using Cloud Spanner’s distributed SQL capabilities and scalability to build a graph database also let us answer the important follow-up question: “Which threads have I been granted permission to view?” And while a lot of these questions could be answered per-user by a traditional relational database, scale limitations have to be taken into consideration, especially as we plan for 10x or more data volume growth as both our user base grows and as their inboxes accumulate more emails. A graph database model is simply a better fit for Streak’s collaboration model with many-to-many mappings between users and teams, and will allow us to query the data in any number of configurations, without worrying about scale limitations or having to manually shard a relational database. Cloud Spanner gives us queryability and scalability.
Taking the Cloud Spanner plunge
With so many advantages to it, we went ahead and began building out our metadata system with Cloud Spanner as a back-end.
Adopting Cloud Spanner has been great. Here are some of the high points:
- The fast distributed queries and transactions are absolutely real. We have global indexes across our entire dataset and we haven’t had to spend very much time at all thinking about co-locating data. In particular, we only use interleaved tables for values that would be repeated fields in Cloud Datastore, and that hasn’t been a problem for us yet.
- We haven’t had any reliability problems whatsoever, despite averaging 20K writes/sec in steady state.
- Once we optimized our queries on realistic data, Cloud Spanner scaled up in a surprisingly predictable way. You need to run queries after you’ve populated data, do the explain to figure out how the query planner is executing the query, and add indexes/modify queries to make sure they’re performant.
- Compared to the hoops some traditional relational databases make you jump through, Cloud Spanner’s online schema changes and index builds are magical. There is no downtime for these operations.
Overall, the experience has been encouraging, and we’re planning to move 20 TB of existing data in Cloud Datastore to Cloud Spanner as well. We built out an ORM library for Java on top of Cloud Spanner called Ratchet and are testing a framework for dual-writing entities to both Cloud Datastore and Cloud Spanner to support the rest of the migration. We now store about 40 TB of email metadata in Cloud Spanner, which makes us a large user of Cloud Spanner.
In short, if you’re starting to outgrow your NoSQL database, and want to move to a managed SQL database, give Cloud Spanner a try. You definitely want to model out your costs and try out a proof of concept, both to see how it works on your workload and to get familiar with the quirks of the system. But you don’t need to spend much time worrying about the reliability of the product: it’s there.
More Relevant Stories for Your Company

Serverless for Startups, the Best Way to Succeed: Expert Says
As Google Cloud has become a choice for more startups, I’ve experienced an increase in founders asking how they should think about cloud services. Though each startup is different and requirements may vary across industries and regions, I’ve seen a few core best practices that help startups to succeed—as well as several

Make Meaningful Analysis with Geo Boundary Public Datasets on BigQuery
Geospatial data is a critical component for a comprehensive analytics strategy. Whether you are trying to visualize data using geospatial parameters or do deeper analysis or modeling on customer distribution or proximity, most organizations have some type of geospatial data they would like to use - whether it be customer

Scaling Ad Personalization with Bigtable
Cloud Bigtable is a popular and widely used key-value database available on Google Cloud. The service provides scale elasticity, cost efficiency, excellent performance characteristics, and 99.999% availability SLA. This has led to massive adoption with thousands of customers trusting Bigtable to run a variety of their mission-critical workloads. Bigtable has

BigQuery Reference Guide: Understanding Tables within and Routine for Data Transformation
Last week in our BigQuery Reference Guide series, we spoke about the BigQuery resource hierarchy - specifically digging into project and dataset structures. This week, we’re going one level deeper and talking through some of the resources within datasets. In this post, we’ll talk through the different types of tables
