





BigQuery Reference Guide: Understanding Tables within and Routine for Data Transformation

3683
Of your peers have already read this article.
3:00 Minutes
The most insightful time you'll spend today!
Last week in our BigQuery Reference Guide series, we spoke about the BigQuery resource hierarchy – specifically digging into project and dataset structures. This week, we’re going one level deeper and talking through some of the resources within datasets. In this post, we’ll talk through the different types of tables available inside of BigQuery, and how to leverage routines for data transformation. Like last time, we’ll link out to the documentation so you can learn more about using these resources in practice.
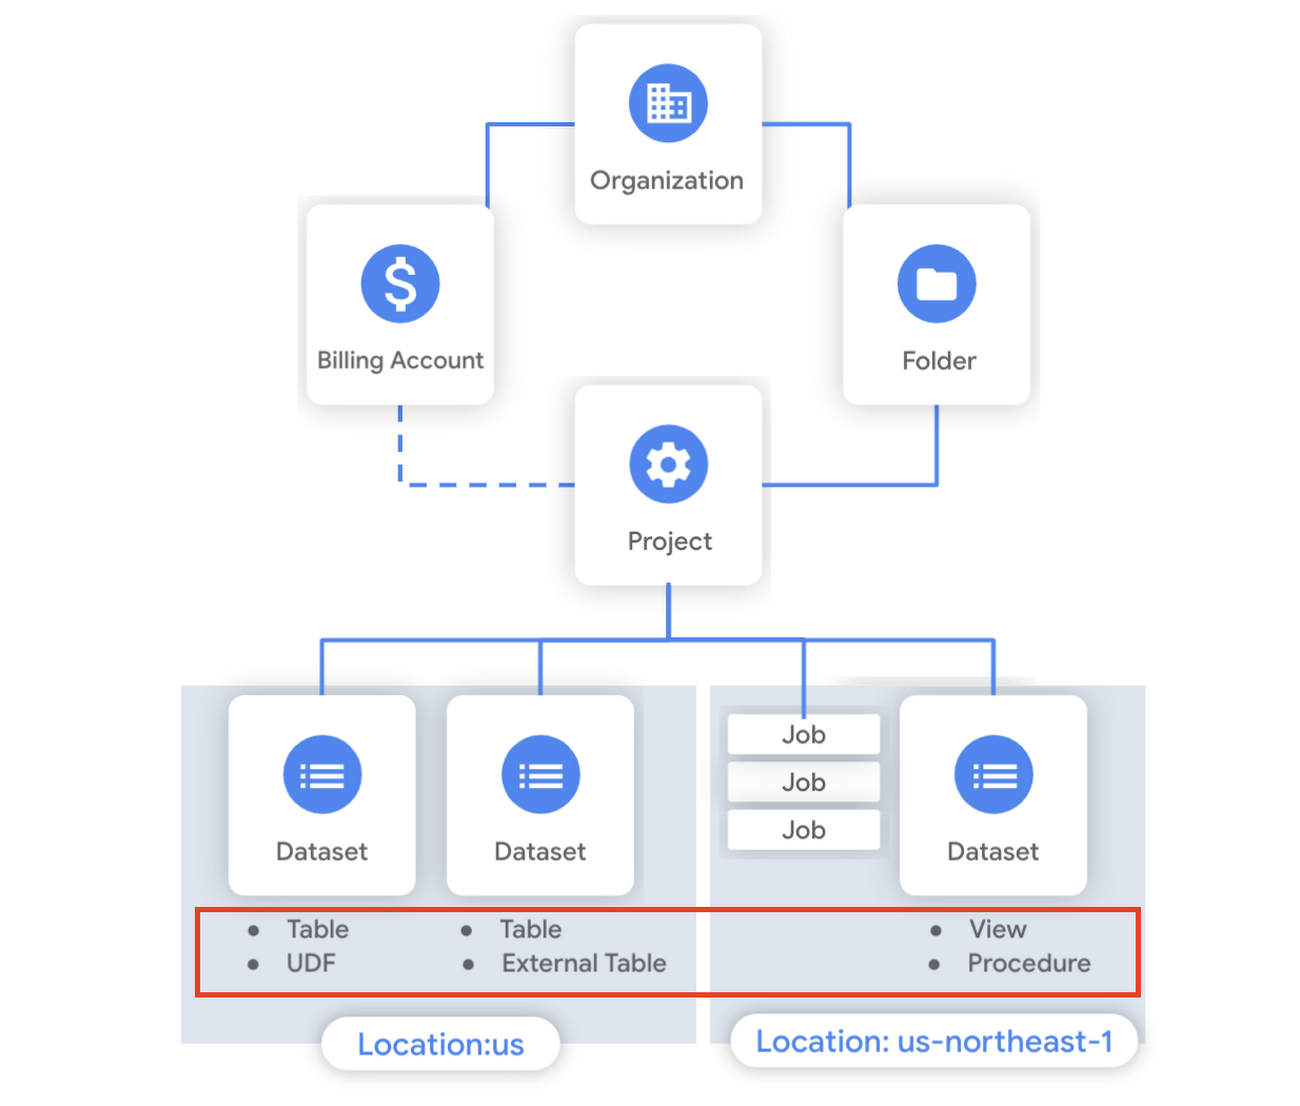
What is a table?
A BigQuery table is a resource that lives inside a dataset. It contains individual records organized into rows, with each record composed of columns (also called fields) where a specified data type is enforced. BigQuery supports numerous different data types including GEOGRAPHY for geospatial data, STRUCT and ARRAY for more complex data, and new parameterized data types to add specific constraints like the number of characters in a string.
Data access can also be controlled at the table, row and column levels; more details on data governance will be covered later in the series. Metadata, such as descriptions and labels, can be used for surfacing information to end users and as tags for monitoring. You can create and manage a table directly in the UI, through the API / Client SDKs or in a SQL query using a DDL statement.
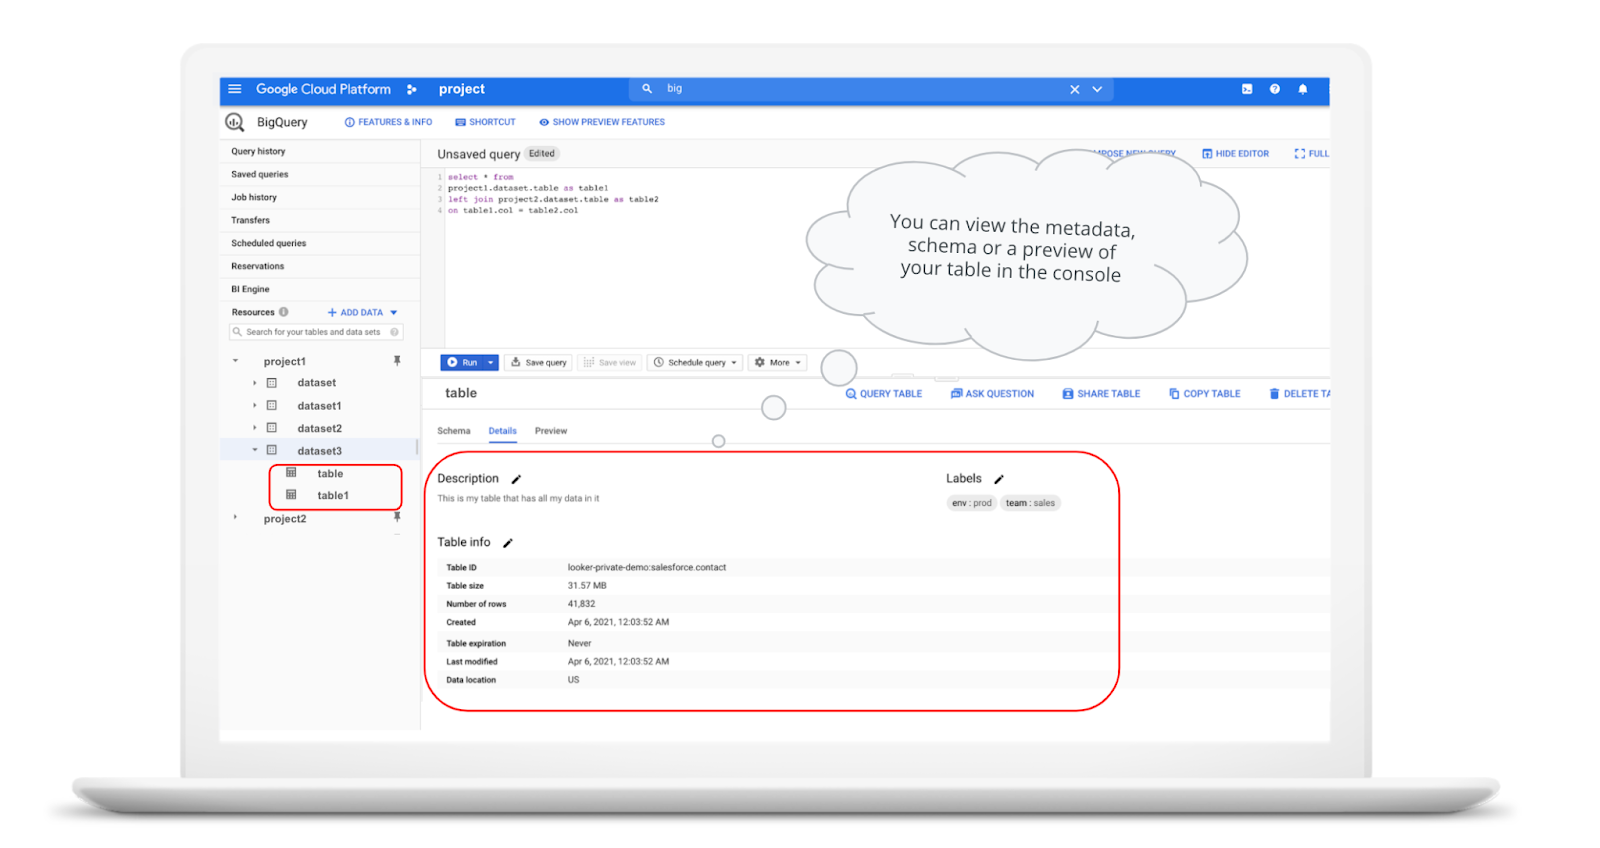
bq show \--schema \--format=prettyjson \project1:dataset3.table
Managed and external tables
Managed tables are tables that are backed by native BigQuery storage, which has many benefits that improve query performance including support for partitions and clusters. We’ll cover more details on BigQuery storage later in this series. Another advantage of using a managed table is that BigQuery allows you to use time travel to access data from any point within the last seven days and query data that was updated, expired or deleted. And now you can even create a snapshot of your table, to preserve its contents at a given time.
# create a snapshot of transactions in the library_backup dataset as of one hour agoCREATE SNAPSHOT TABLElibrary_backup.salesCLONE retail.transactionsFOR SYSTEM_TIME AS OF TIMESTAMP_SUB(CURRENT_TIMESTAMP(), INTERVAL 1 HOUR);
While managed tables store data inside BigQuery storage, external tables are backed by storage external to BigQuery. BigQuery currently supports creating an external table from Cloud Storage, Cloud Bigtable and Google Drive. Besides an external table, you can create a connection to Cloud SQL, which is somewhat analogous to an external dataset. Here, you can leverage federated queries to send a query that executes in Cloud SQL but returns the results to be used within BigQuery.
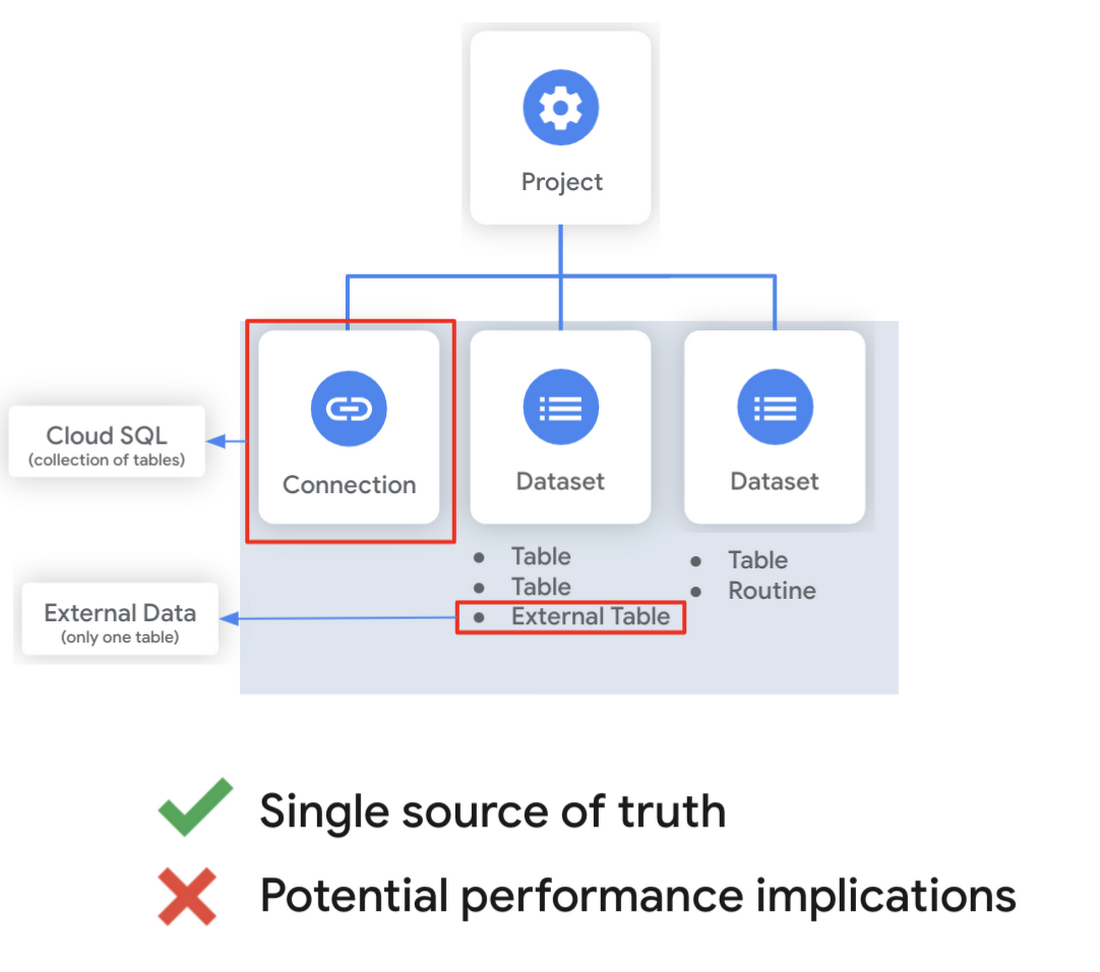
Using external tables or federated queries may result in queries that aren’t as fast as if the data had been stored in BigQuery itself. However, they can be useful for some data transformation patterns – for example, you may want to schedule a DDL/DML query that hydrates a managed table using a federated query, which selects and transforms data from Cloud SQL. An external table might also be useful for multi-consumer workflows where BQ storage isn’t the source of truth. Like, if you have a dataproc cluster accessing data in a Cloud Storage bucket that you’re not quite ready to port into BigQuery (although I do recommend taking a look at our connector if you need some convincing). You can learn more about querying external data in this video.
Logical and materialized views
In BigQuery, you can create a virtual table with a logical view or a materialized view. With logical views, BigQuery will execute the SQL statement to create the view at run time, it will not save the result anywhere. Additionally, you can grant users access to an authorized view to share query results without giving them access to the underlying tables.
# create a view that aggregates daily sales from a retail transaction tableCREATE VIEW retail.daily_sales as (SELECT date(t.transaction_timestamp) as date, sum(li.sale_price) as total_salesFROM retail.transaction_detail as tLEFT JOIN UNNEST(t.line_items) as liGROUP BY 1)
On the other hand, materialized views are re-computed in the background when the base data changes. No user action is required – they are always fresh! Better yet, if a query, or part of a query, against the source table can be resolved by querying the materialized view, BigQuery will reroute for improved performance. However, materialized views use a restricted SQL syntax and a limited set of aggregation functions. You can find details on limitations here.
# create a materialized view that aggregates daily salesCREATE MATERIALIZED VIEW retail.daily_sales as (SELECT date(t.transaction_timestamp) as date, sum(li.sale_price) as total_salesFROM retail.transaction_detail as tLEFT JOIN UNNEST(t.line_items) as liGROUP BY 1)
Temporary and cached results tables
Aside from the tables we’ve mentioned so far, you can also create a temporary managed table using the TEMP or TEMPORARY keyword. This table is saved in BigQuery storage and can be referenced for the duration of the script. Temporary tables can be a good alternative to WITH clauses because the defining query is only executed once as opposed to being inlined every place the alias is referenced.
| Original code | Optimized |
| with a as ( select …),b as ( select … from a …),c as ( select … from a …)select b.dim1, c.dim2from b, c; | create temp table a asselect …; with b as ( select … from a …),c as ( select … from a …)select b.dim1, c.dim2from b, c; |
It’s also important to mention that BigQuery writes all query results to a table – one either explicitly identified by the user or to a cached results table. Temporary, cached results tables are maintained per-user, per-project. There are no storage costs for temporary tables.
User defined functions & procedures
In BigQuery, a routine is either a user defined function (UDF) or a procedure. Routines allow you to re-use logic and handle your data in a unique way. A UDF is a function that is created using either SQL or Javascript, it takes arguments as input and returns a single value as an output. UDFs are often used for cleaning or re-formatting data. For example, extracting parameters from a URL string, restructuring nested data, or cleaning up strings:
# UDF to clean up string valuesCREATE OR REPLACE FUNCTIONmy_dataset.cleanse_string_test (text STRING)RETURNS STRINGAS (REGEXP_REPLACE(LOWER(TRIM(text)), '[^a-zA-Z0-9 ]+', ''));
We even have a community driven open-source repository of BigQuery UDFs! Just like logical views, you can create an authorized UDF that protects aspects of the underlying data. For more details on UDFs checkout our video here. You might also want to take a look at table functions – a preview feature where you can create a SQL UDF that returns a table instead of a scalar value.
Procedures, on the other hand, are blocks of SQL statements that can be called from other queries. Unlike UDFs, stored procedures can return multiple values or no values – which means you can run them to create or modify tables. In BigQuery, you can also leverage scripting capabilities within procedures to control execution flow with IF and WHILE statements. Plus, you can call your UDFs within your procedure! These aspects make procedures great for extract-load-transform (ELT) driven workflows.
# Procedure to create daily sales rollup, starting from startDate until endDateCREATE OR REPLACE PROCEDURE my_dataset.sum_sales(startDate STRING, endDate STRING)BEGINCREATE OR REPLACE TABLE retail.sales_resultAS (SELECTdate(t.transaction_timestamp) as date,sum(li.sale_price) as total_salesFROM retail.transaction_detail as tLEFT JOIN UNNEST(t.line_items) as liWHERE transaction_timestamp >= TIMESTAMP(startDate) AND transaction_timestamp <= TIMESTAMP(endDate)GROUP BY 1);END;CALL retail.sum_sales('2020-08-01', '2020-01-20');
To ensure consistent analytics across your organization, I recommend that you create a library dataset to house UDFs and procedures. You can easily grant everyone in your organization the BigQuery Data Viewer role to the library dataset so that all analysts use consistent and up-to-date logic in their queries.
Stay tuned!
We hope this gave you an understanding of how to leverage some of the different resources inside of a BigQuery dataset, and to help you make decisions like using native versus external storage, logical versus materialized views, and user defined functions or procedures.
Next up we’ll be talking about workload management in BigQuery by taking a look at jobs and the reservation model. Be sure to keep an eye out for more in this series by following me on LinkedIn and Twitter, and subscribing to our Youtube channel.
Principles to Make Organizations Data Engineering Driven

4844
Of your peers have already read this article.
4:00 Minutes
The most insightful time you'll spend today!
In the “What type of data processing organisation” paper, we examined that you can build a data culture whether your organization consists mostly of data analysts, or data engineers, or data scientists. However, the path and technologies to become a data-driven innovator are different and success comes from implementing the right tech in a way that matches a company’s culture. In this blog we will expand the data engineering driven organizations and provide how it can be built from the first principles.
Not all organizations are alike. All companies have similar functions (sales, engineering, marketing), but not all functions have the same influence on the overall business decisions. Some companies are more engineering-driven, others are sales-driven, others are marketing-driven. In practice, all companies are a mixture of all these functions. In the same way, the data strategy can be more focused on data analysts, and others on data engineering. Culture is a combination of several factors, business requirements, organizational culture, and skills within the organization.
Traditionally organizations that focused on engineering mainly came from technology driven digital backgrounds. They built their own frameworks or used programming frameworks to build repeatable data pipelines. Some of this is due to the way the data is received, the shape the data is received and the speed of the data arrival as well. If your data allows it, your organization can be more focused on data analysis, and not so much on data engineering. If you can apply an Extract-Load-Transform approach (ELT) rather than the classic Extract-Transform-Load (ETL), then you can focus on data analysis and might not need extensive data engineering capability. For example, data that can be loaded directly into the data warehouse allows data analysts to also do data engineering work and apply transformations to the data.
This does not happen so often though. Sometimes your data is messy, inconsistent, bulky, and encoded in legacy file formats or as part of legacy databases or systems, with a little potential to be actionable by data analysts.
Or maybe you need to process data in streaming, applying complex event processing to obtain competitive insights in near real time. The value of data decays exponentially with time. Most companies can process data by the next day in batch mode. However, not so many are probably obtaining such knowledge the next second data is produced.
In these situations, you need the talent to unveil the insights hidden in that amalgam of data, either messy or fast changing (or both!). And almost as importantly, you need the right tools and systems to enable that talent too.
What are those right tools? Cloud provides the scalability and flexibility for data workloads that are required in such complex situations. Long gone are the times when data teams had to beg for the resources that were required to have an impact in the business. Data processing systems are no longer scarce, so your data strategy should not generate that scarcity artificially.
In this article, we explain how to leverage Google Cloud to enable data teams to do complex processing of data, in batch and streaming. By doing so, your data engineering and science teams can have an impact when (in seconds) after the input data is generated.
Data engineering driven organizations
When the complexity of your data transformation needs is high, data engineers have a central role in the data strategy of your company, leading to data engineering driven organization. In this type of organization, data architectures are organized in three layers: business data owners, data engineers, and data consumers.
Data engineers are at the crossroads between data owners and data consumers, with clear responsibilities:
- Transporting data, enriching data whilst building integrations between analytical systems and operational systems ( as in the real time use cases)
- Parsing and transforming messy data coming from business units into meaningful and clean data, with documented metadata
- Applying DataOps, that is, functional knowledge of the business plus software engineering methodologies applied to the data lifecycle
- Deployment of models and other artifacts analyzing or consuming data
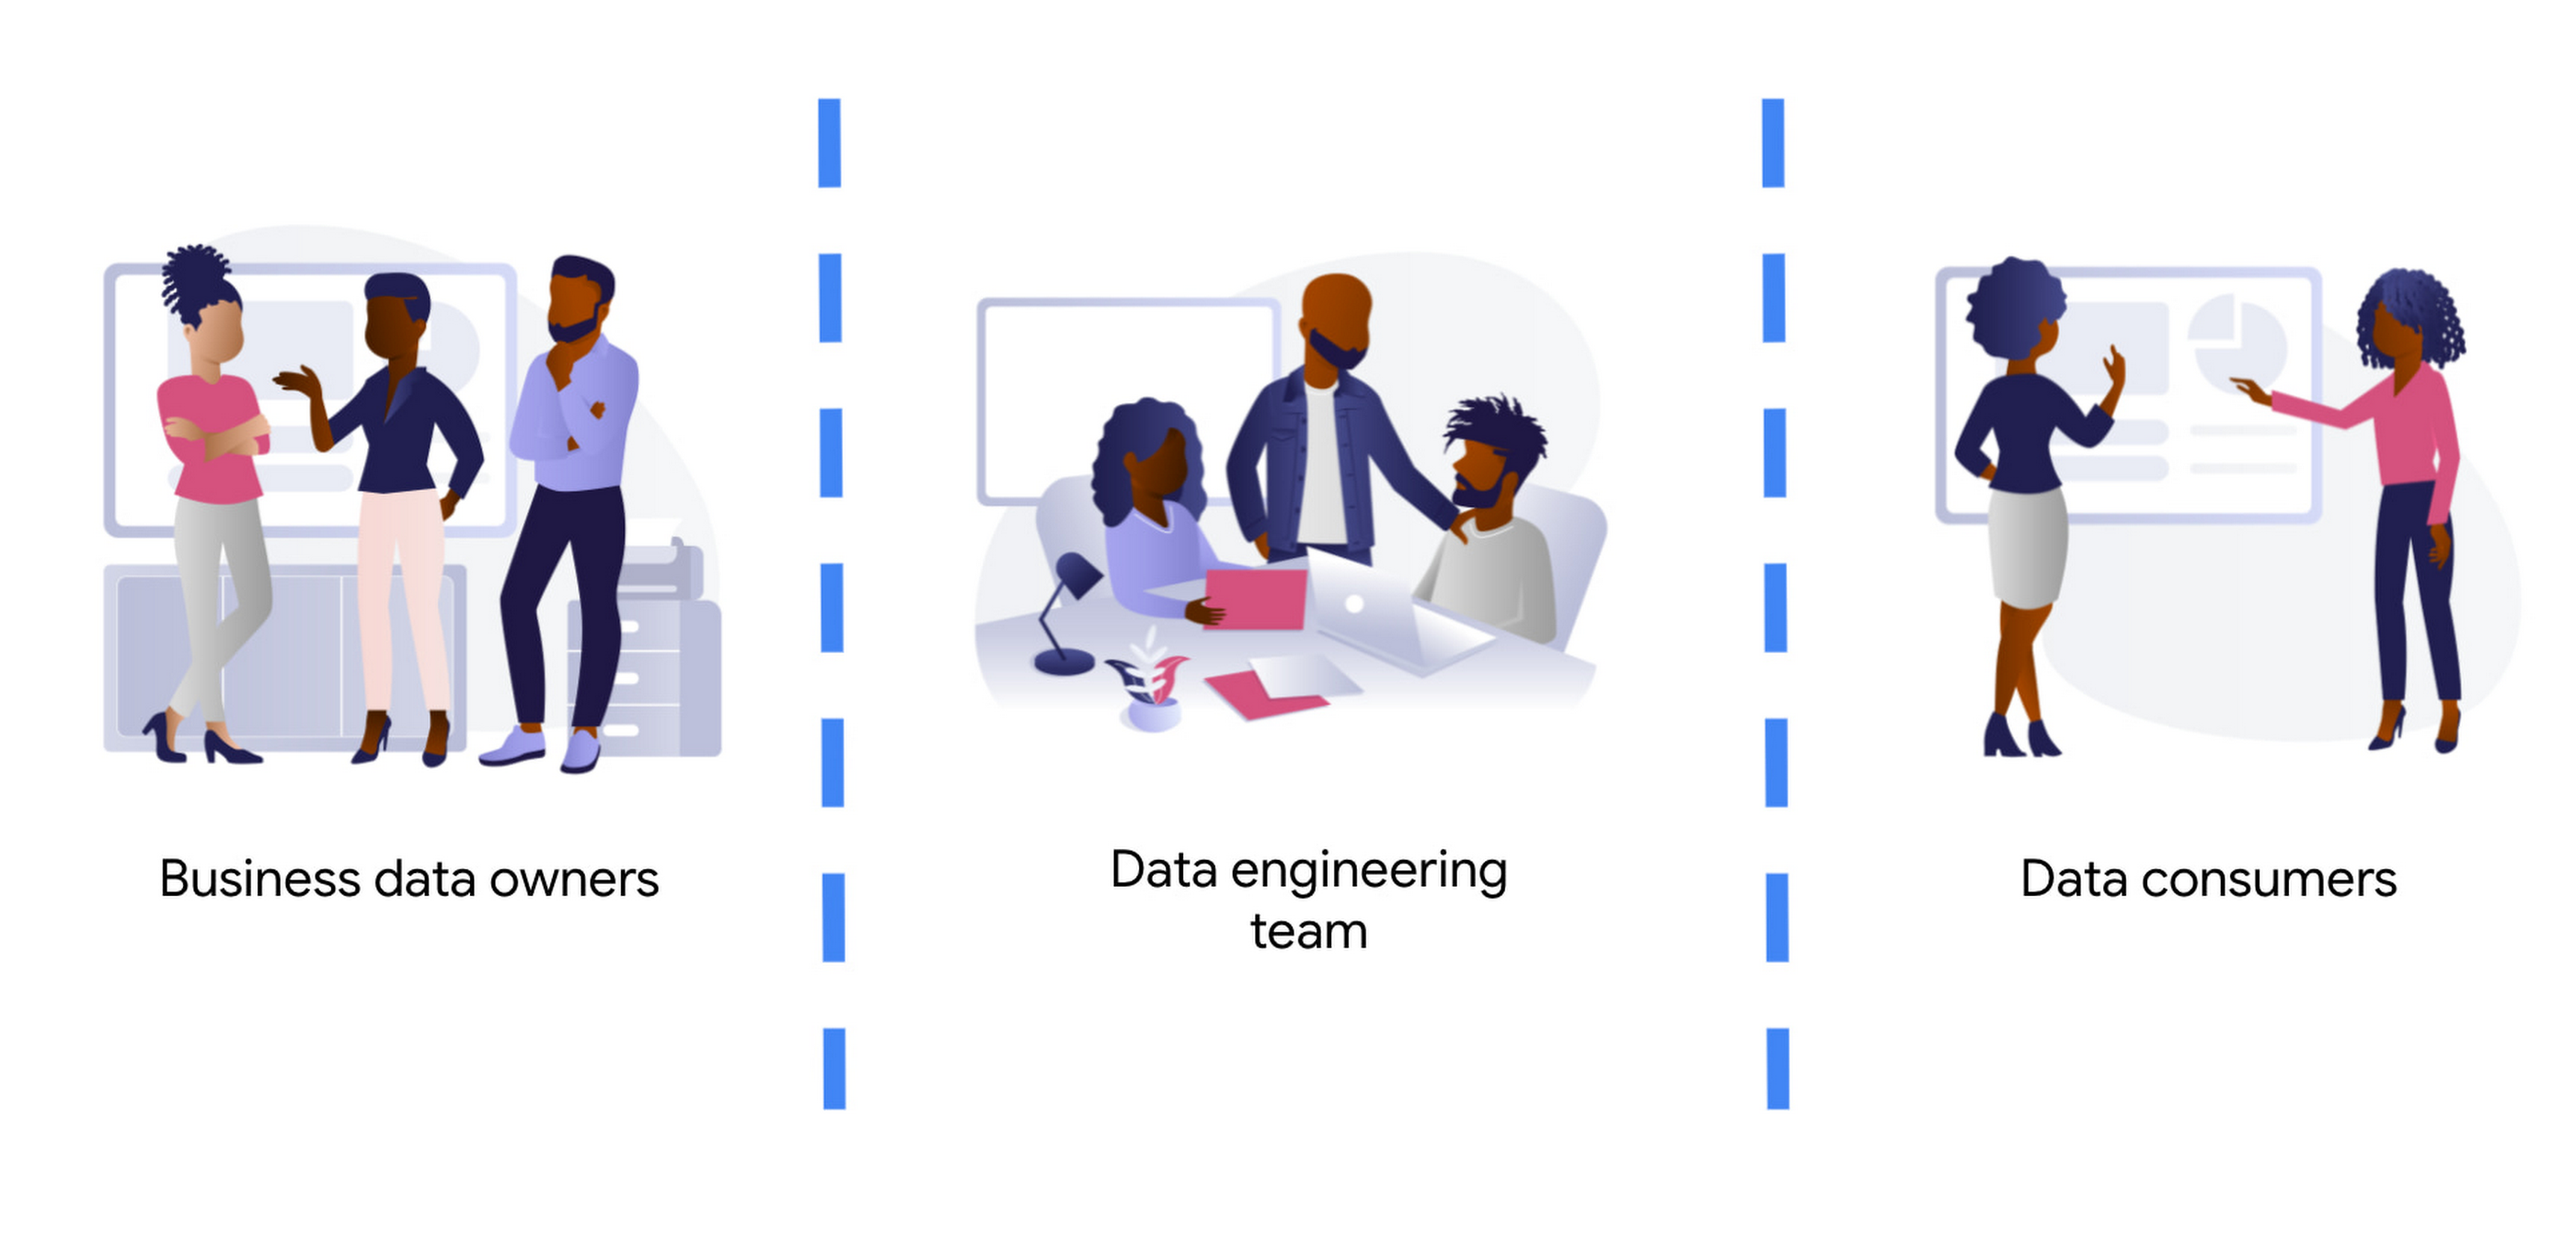
Business data owners are cross-functional domain-oriented teams. These teams know the business in detail, and are the source of data that feeds the data architecture. Sometimes these business units may also have some data-specific roles, such as data analysts, data engineers, or data scientists, to work as interfaces with the rest of the layers. For instance, these teams may design a business data owner, that is the point of contact of a business unit in everything that is related to the data produced by the unit.
At the other end of the architecture, we find the data consumers. Again, also cross-functional, but more focused on extracting insights from the different data available in the architecture. Here we typically find data science teams, data analysts, business intelligence teams, etc. These groups sometimes combine data from different business units, and produce artifacts (machine learning models, interactive dashboards, reports, and so on). For deployment, they require the help of the data engineering team so that data is consistent and trusted.
At the center of these crossroads, we find the data engineering team. Data engineers are responsible for making sure that the data generated and needed by different business units gets ingested into the architecture. This job requires two disparate skills: functional knowledge and data engineering/software development skills. This is often coined under the term DataOps (which evolved from DevOps methodologies developed within the past decades but applied to data engineering practices).
Data engineers have another responsibility too. They must help in the deployment of artifacts produced by the data consumers. Typically, the data consumers do not have the deep technical skills and knowledge to take the sole responsibility for deployment of their artifacts.This is also true for highly sophisticated data science teams. So data engineers must add other skills under their belt: machine learning and business intelligence platform knowledge. Let’s clarify this point, we don’t expect data engineers to become machine learning engineers. Data engineers need to understand ML to ensure that the data delivered to the first layer of a model ( the input ) is correct. They will also become key when delivering that first layer of data in the inference path, as here the data engineering skills around scale / HA etc really need to shine.
By taking the responsibility of parsing and transforming messy data from various business units, or for ingesting in real time, data engineers allow the data consumers to focus on creating value. Data science and other types of data consumers are abstracted away from data encodings, large files, legacy systems, complex message queue configurations for streaming. The benefits of concentrating that knowledge in a highly skilled data engineering team are clear, notwithstanding that other teams (business units and consumers) may also have their data engineers to work as interfaces with other teams. More recently, we even see squads created with members of the business units (data product owners), data engineers, data scientists, and other roles. Effectively creating complete teams with autonomy and full responsibility over a data stream, from the incoming data down to the data driven decision with impact in the business.
Reference architecture – Serverless
The number of skills required for the data engineering team is vast and diverse. We should not make it harder by expecting the team to maintain the infrastructure where they run data pipelines. They should be focusing on how to cleanse, transform, enrich, and prepare the data rather than how much memory or how many cores their solution may require.
The reference architectures presented here are based on the following principles:
- Serverless no-ops technologies
- Streaming-enabled for low time-to-insight
We present different alternatives, based on different products available in Google Cloud:
- Dataflow, the built-in streaming analytics platform in Google Cloud
- Dataproc, the Google Cloud’s managed platform for Hadoop and Spark.
- Data Fusion, a codeless environment for creating and running data pipelines
Let’s dig into these principles.
By using serverless technology we eliminate the maintenance burden from the data engineering team, and we provide the necessary flexibility and scalability for executing complex and/or large jobs. For example, scalability is essential when planning for traffic spikes during mega Friday for retailers. Using serverless solutions allows retailers to look into how they are performing during the day. They no longer need to worry about resources needed to process massive data generated during the day.
The team needs to have full control and write their own code for the data pipelines because of the type of pipelines that the team develops. This is true either for batch or streaming pipelines. In batch, the parsing requirements can be complex and no off the shelf solution works. In streaming, if the team wants to fully leverage the capabilities of the platform, they should implement all the complex business logic that is required, without artificially simplifying the complexity in exchange for some better latency. They can develop a pipeline that achieves a low latency with highly complex business logic. This again requires the team to start writing code from first principles.
However, that the team needs to write code should not imply that they need to rewrite any existing piece of code. For many input/output systems, we can probably reuse code from patterns, snippets, and similar examples. Moreover, a logical pipeline developed by a data engineering team does not necessarily need to map to a physical pipeline. Some parts of the logic can be easily reused by using technologies like Dataflow templates, and use those templates in orchestration with other custom developed pipelines. This brings the best of both worlds (reuse and rewrite), while saving precious time that can be dedicated to higher impact code rather than common I/O tasks. The reference architecture presented has another important feature: the possibility to transform existing batch pipelines to streaming.
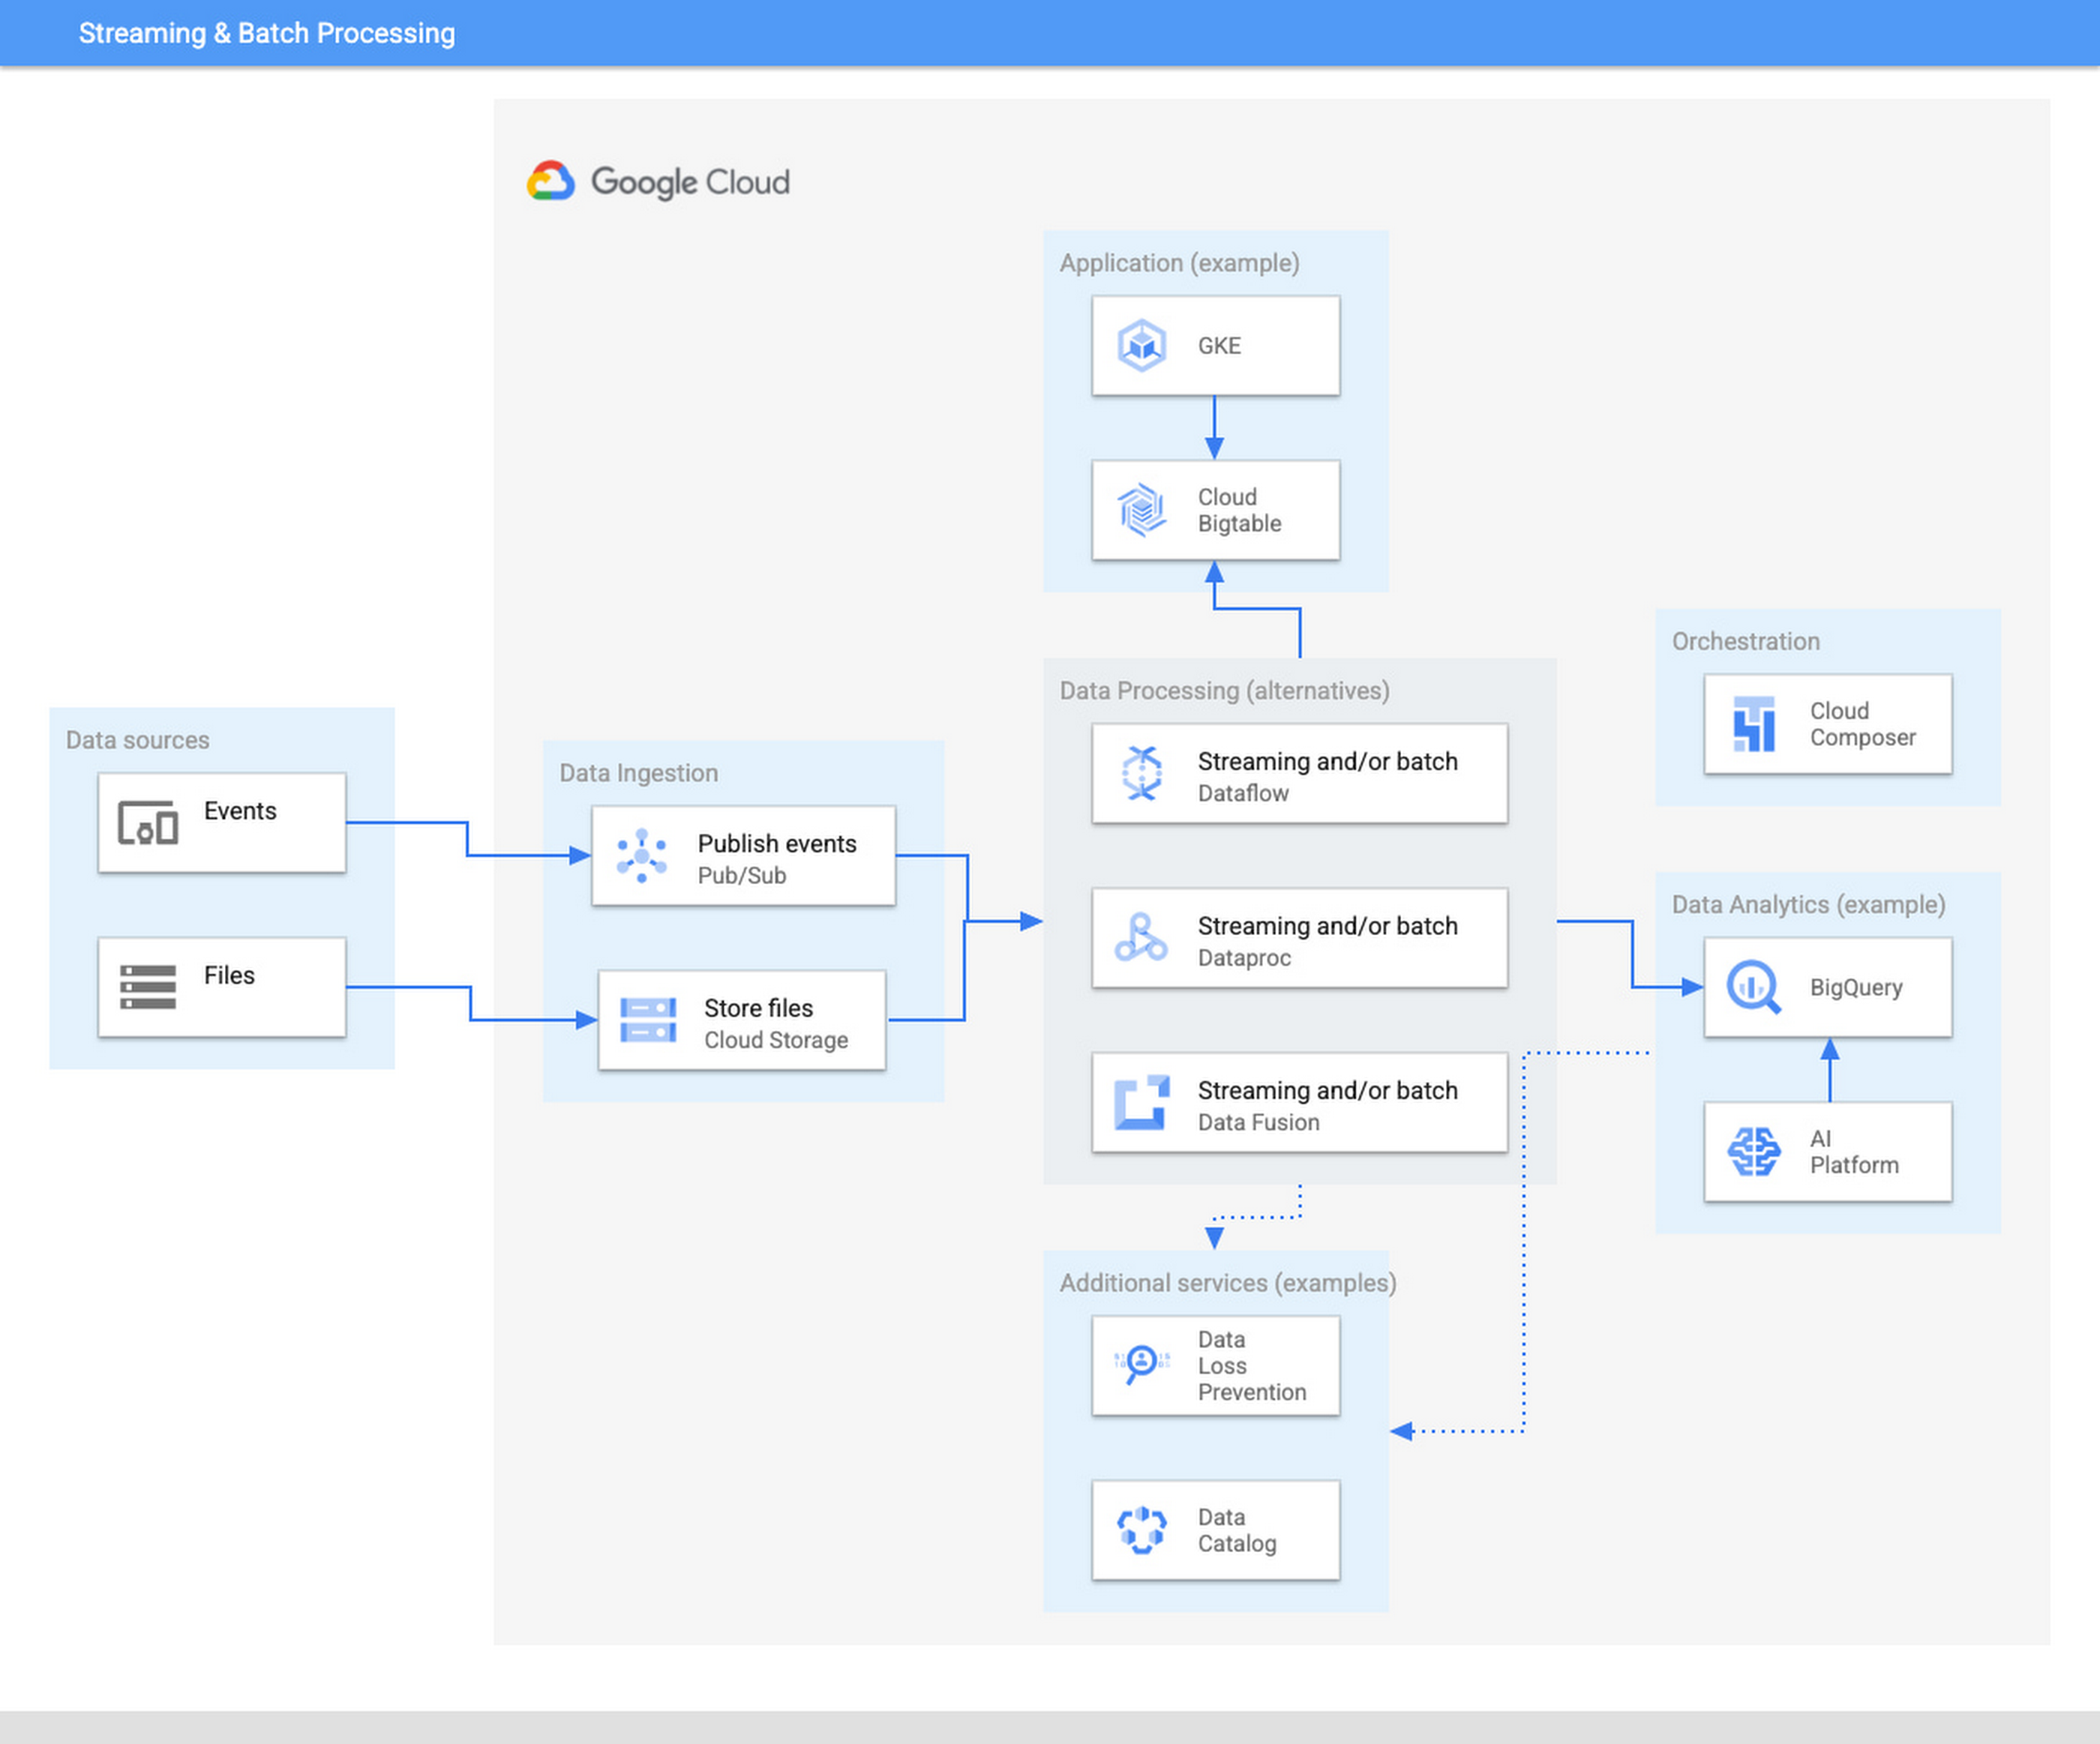
The ingestion layer consists of Pub/Sub for real time and Cloud Storage for batch and does not require any preallocated infrastructure. Both Pub/Sub and Cloud Storage can be used for a range of cases as it can automatically scale up with the input workload.
Once the data has been ingested, our proposed architecture follows the classical division in three stages: Extract, Transform, and Load (ETL). For some types of files, direct ingestion into BigQuery (following an ELT approach) is also possible.
In the transform layer, we primarily recommend Dataflow as the data process component. Dataflow uses Apache Beam as SDK. The main advantage of Apache Beam is the unified model for batch and streaming processing. As mentioned before, the same code can be adapted to run in batch or streaming by adapting input and output. For instance, switching the input from files in Cloud Storage to messages published in a topic in Pub/Sub.
One of the alternatives to Dataflow in this architecture is Dataproc, Google Cloud’s solution for managed Hadoop and Spark clusters. The main use case is for those teams that are migrating to Google Cloud but have large amounts of inherited code in Spark or Hadoop. Dataproc enables a direct path to the cloud, without having to review all those pipelines.
Finally, we also present the alternative of Data Fusion, a codeless environment for creating data pipelines using a drag-and-drop interface. Data Fusion actually uses Dataproc as its Compute Engine, so everything we have mentioned earlier applies also to the case of Data Fusion. If your team prefers to create data pipelines without having to write any code, Data Fusion is the right tool.
So in summary, these are the three recommended components for the transform layer:
- Dataflow, powerful and versatile with a unified model for batch and streaming processing. Straightforward path to move from batch processing to streaming
- Dataproc, for those teams that want to reuse existing code from Hadoop or Spark environments.
- Data Fusion, if your team does not want to write any code.
Challenges and opportunities
Data platforms are complex. Having on top of that data responsibility the duty to maintain infrastructure is a wasteful use of valuable skills and talent. Often data teams end up managing infrastructure rather than focusing on analyzing the data. The architecture presented in this article liberates the data engineering team from having to allocate infrastructure and tweak clusters but instead to focus on providing value through data processing pipelines.
For data engineers to focus on what they do best, you need to fully leverage the cloud. A lift & shift approach from any on-premise installation is not going to provide that flexibility and liberation. You need to leverage serverless technologies. As an added advantage, serverless lets you also scale your data processing capabilities with your needs, and be able to respond to peaks of activity, however large these are.
Serverless technologies sometimes face the doubts of practitioners: will I be locked in with my provider if I fully leverage serverless? This is actually a question that you should be asking when deciding whether to set up your architecture on top of a provider.
The components presented here for data processing are based on open source technologies, and fully interoperable with other open source equivalent components. Dataflow uses Apache Beam, which not only unifies batch and streaming, but also offers a widely compatible runner. You can take your code elsewhere to any other runner. For instance, Apache Flink or Apache Spark. Dataproc is a fully managed Hadoop and Spark based on the vanilla open source components of this ecosystem. Data Fusion is actually the Google Cloud version of CDAP, an open source project.
On the other hand, for the serving layer, BigQuery is based on standard Ansi SQL. Whereas in the case of Bigtable and Google Kubernetes Engine, Bigtable is compatible at API level with HBase, and Kubernetes is an open source component.
In summary, when your components are based on open source, like the ones included in this architecture, serverless does not lock you in. The skills required to encode business logic in the form of data processing pipelines are based on engineering principles that remain stable across time. The same principles apply if you are using Hadoop, Spark, or Dataflow or UI driven ETL tooling. In addition, there are now new capabilities, such as low-latency streaming, that were not available before. A team of data engineers that learn the fundamental principles of data engineering will be able to quickly leverage those additional capabilities.
Our recommended architecture separates the logical level, the code of your applications, from the infrastructure where they run. This enables data engineers to focus on what they do best and on where they provide the highest added value. Let your Dataflow and your engineers impact your business, by adopting the technologies that liberate them and allow them to focus on adding business value. To learn more about building an unified data analytics platform, take a look at our recently published Unified Data Analytics Platform paper and Converging Architectures paper.
Want to Code for the Cloud? Get Started with the Native App Development Track

6744
Of your peers have already read this article.
2:00 Minutes
The most insightful time you'll spend today!
Earlier this year, we launched the Google Cloud skills challenge, which provides 30 days of free access to training to build your cloud knowledge and an opportunity to earn skill badges that showcase your Google Cloud competencies. Today, we’re adding a Native App Development track to the skills challenge, joining the Getting Started, Data Analytics, Kubernetes, Machine Learning (ML) and Artificial Intelligence (AI) tracks.
The Native App Development track is designed for cloud developers who want to learn to build serverless web apps and Google Assistant applications on Google Cloud using Cloud Run and Firebase. Specifically, you’ll have an opportunity to earn three skill badges in the Native App Dev track: Serverless Firebase Development, Serverless Cloud Run Development, and Build Interactive Apps with Google Assistant. To earn a skill badge, you complete a series of hands-on labs and take a final assessment challenge lab to test your skills.
Here’s an overview of each badge.
Serverless Firebase Development
To earn this skill badge, you’ll learn how to build serverless web apps, import data into a serverless database, and build Google Assistant applications using Firebase, Google’s backend-as-service platform for creating mobile and web applications.
Serverless Cloud Run Development
For this badge, you’ll discover how to use Cloud Run, a fully managed serverless platform, to connect and leverage data stored in Cloud Storage. You’ll learn how to use Cloud Run to build a resilient, asynchronous system with Pub/Sub, build a REST API gateway as well as build and expose services.
Build Interactive Apps with Google Assistant
To earn the final skills badge, you’ll build Google Assistant applications by creating a project in the Actions console, integrating Dialogflow, testing your action in the Actions simulator, and adding Cloud Translation API to your assistant application.
Ready to jump into the skills challenge? Sign up here.
You can also check out this quick video below to learn how to join the skills challenge.
BigQuery Helps Insurance Firms Leverage Previous Storm Data for Better Pricing Insights

8563
Of your peers have already read this article.
2:00 Minutes
The most insightful time you'll spend today!
It may be surprising to know that U.S. natural catastrophe economic losses totaled $119 billion in 2020, and 75% (or $89.4B) of those economic losses were caused by severe storms and cyclones. In the insurance industry, data is everything. Insurers use data to influence underwriting, rating, pricing, forms, marketing, and even claims handling. When fueled by good data, risk assessments become more accurate and produce better business results. To make this possible, the industry is increasingly turning to predictive analytics, which uses data, statistical algorithms, and machine learning (ML) techniques to predict future outcomes based on historical data. Insurance firms also integrate external data sources with their own existing data to generate more insight into claimants and damages. Google Cloud Public Datasets offers more than 100 high-demand public datasets through BigQuery that helps insurers in these sorts of data “mashups.”
One particular dataset that insurers find very useful is Severe Storm Event Details from the U.S. National Oceanic and Atmospheric Administration (NOAA). As part of the Google Cloud Public Datasets program and NOAA’s Public Data Program, this severe storm data contains various types of storm reports by state, county, and event type—from 1950 to the present—with regular updates. Similar NOAA datasets within the Google Cloud Public Datasets program include the Significant Earthquake Database, Global Hurricane Tracks, and the Global Historical Tsunami Database.
In this post, we’ll explore how to apply storm event data for insurance pricing purposes using a few common data science tools—Python Notebook and BigQuery—to drive better insights for insurers.
Predicting outcomes with severe storm datasets
For property insurers, common determinants of insurance pricing include home condition, assessor and neighborhood data, and cost-to-replace. But macro forces such as natural disasters—like regional hurricanes, flash floods, and thunderstorms—can also significantly contribute to the risk profile of the insured. Insurance companies can leverage severe weather data for dynamic pricing of premiums by analyzing the severity of those events in terms of past damage done to property and crops, for example.
It’s important to set the premium correctly, however, considering the risks involved. Insurance companies now run sophisticated statistical models, taking into account various factors—many of which can change over time. After all, without accurate data, poor predictions can lead to business losses, particularly at scale.
The Severe Storm Event Details database includes information about a storm event’s location, azimuth (an angle measurement used in celestial coordination), distance, impact, and severity, including the cost of damages to property and crops. It documents:
- The occurrence of storms and other significant weather events of sufficient intensity to cause loss of life, injuries, significant property damage, and/or disruption to commerce.
- Rare, unusual weather events that generate media attention, such as snow flurries in South Florida or the San Diego coastal area.
- Other significant weather events, such as record maximum or minimum temperatures or precipitation that occur in connection with another event.
Data about a specific event is added to the dataset within 120 days to allow time for damage assessments and other analysis.
Driving business insights with BigQuery and notebooks
Google Cloud’s BigQuery provides easy access to this data in multiple ways. For example, you can query directly within BigQuery and perform analysis using SQL.
Another popular option in the data science and analyst community is to access BigQuery from within the Notebook environment to intersperse Python code and SQL text, and then perform ad hoc experimentation. This uses the powerful BigQuery compute to query and process huge amounts of data without having to perform the complex transformations within the memory in Pandas, for example.
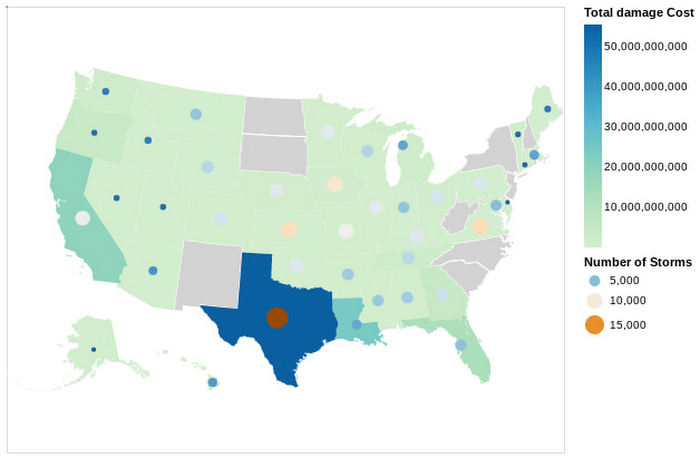
In this Python notebook, we have shown how the severe storm data can be used to generate risk profiles of various zip codes based on the severity of those events as measured by the damage incurred. The severe storm dataset is queried to retrieve a smaller dataset into the notebook, which is then explored and visualized using Python. Here’s a look at the risk profiles of the zip codes:
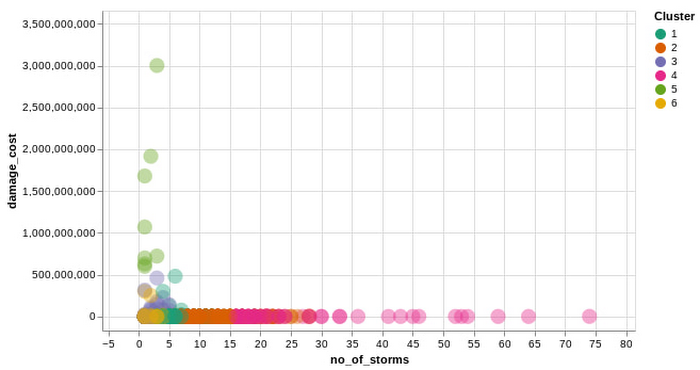
Another Google Cloud resource for insurers is BigQuery ML, which allows them to create and execute machine learning models on their data using standard SQL queries. In this notebook, with a K-Means Clustering algorithm, we have used BigQuery ML to generate different clusters of zip codes in the top five states impacted by severe storms. These clusters show different levels of impact by the storms, indicating different risk groups.
The example notebook is a reference guide to enable analysts to easily incorporate and leverage public datasets to augment their analysis and streamline the journey to business insights. Instead of having to figure out how to access and use this data yourself, the public datasets, coupled with BigQuery and other solutions, provide a well-lit path to insights, leaving you more time to focus on your own business solutions.
Making an impact with big data
Google Cloud’s Public Datasets is just one resource within the broader Google Cloud ecosystem that provides data science teams within the financial services with flexible tools to gather deeper insights for growth. The severe storm dataset is a part of our environmental, social, and governance (ESG) efforts to organize information about our planet and make it actionable through technology, helping people make a positive impact together.
To learn more about this public dataset collaboration between Google Cloud and NOAA, attend the Dynamic Pricing in Insurance: Leveraging Datasets To Predict Risk and Price session at the Google Cloud Financial Services Summit on May 27. You can also check out our recent blog and explore more about BigQuery and BigQuery ML.
Google Cloud Next 21 for Data Analytics Unplugged

4948
Of your peers have already read this article.
4:30 Minutes
The most insightful time you'll spend today!
October 23rd (this past Saturday!) was my 4th Googlevarsery and we are wrapping an incredible Google Next 2021!
When I started in 2017, we had a dream of making BigQuery Intelligent Data Warehouse that would power every organization’s data driven digital transformation.
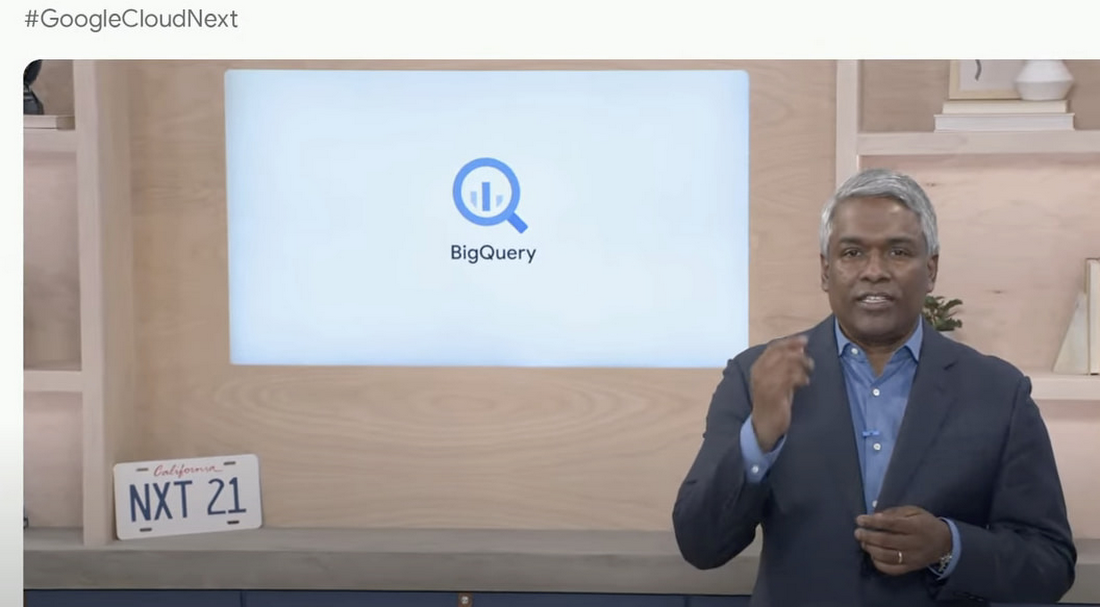
This year at Next, It was amazing to see Google Cloud’s CEO, Thomas Kurian, kick off his keynote with CTO of WalMart, Suresh Kumar , talking about how his organization is giving its data the “BigQuery treatment”.
AS I recap Next 2021 and reflect on our amazing journey over the past 4 years, I’m so proud of the opportunity I’ve had to work with some of the world’s most innovative companies from Twitter to Walmart to Home Depot, Snap, Paypal and many others.
So much of what we announced at Next is the result of years of hard work, persistence and commitment to delivering the best analytics experience for customers.
I believe that one of the reasons why customers choose Google for data is because we have shown a strong alignment between our strategy and theirs and because we’ve been relentlessly delivering innovation at the speed they require.
Unified Smart Analytics Platform
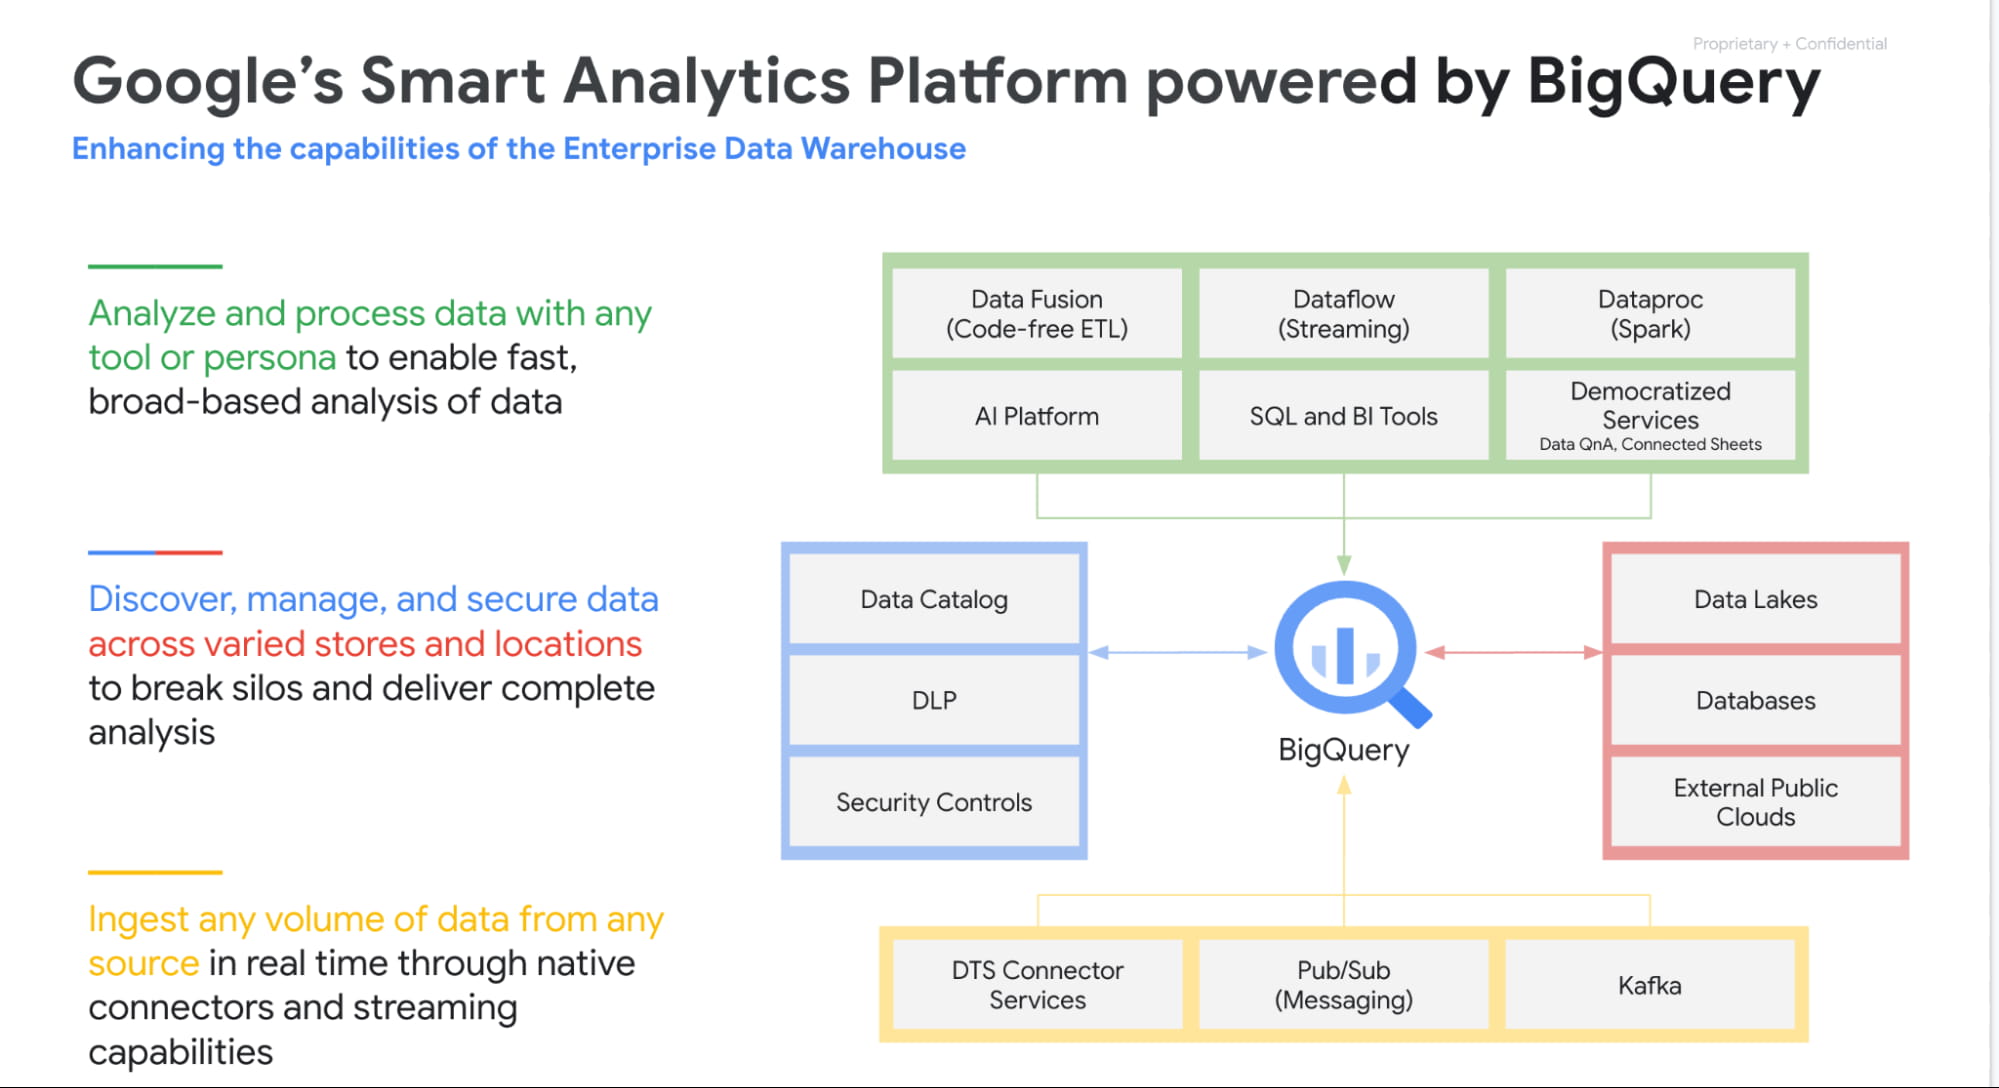
Over the past 4 years our focus has been to build industries leading unified smart analytics platforms. BigQuery is at the heart of this vision and seamlessly integrates with all our other services. Customers can use BigQuery to query data in BigQuery Storage, Google Cloud Storage, AWS S3, Azure Blobstore, various databases like BigTable, Spanner, Cloud SQL etc. They can also use any engine like Spark, Dataflow, Vertex AI with BigQuery. BigQuery automatically syncs all its metadata with Data Catalog and users can then run a Data Loss Prevention service to identify sensitive data and tag it. These tags can then be used to create access policies.
In addition to Google services, all our partner products also integrate with BigQuery seamlessly. Some of the key partners highlighted at Next 21 included Data Ingestion (Fivetran, Informatica & Confluent), Data preparation (Trifacta, DBT), Data Governance (Colibra), Data Science (Databricks, Dataiku) and BI (Tableau, PowerBI, Qlik etc).
Planet Scale analytics with BigQuery
BigQuery is an amazing platform and over the past 11 years we have continued to innovate in various aspects. Scalability has always been a huge differentiator for BigQuery. BigQuery has many customers with more than 100 petabytes of data and our largest customer is now approaching an exabyte of data. Our large customers have run queries over trillions of rows.
But scale for us is not just about storing or processing a lot of data. Scale is also how we can reach every organization in the world. This is the reason we launched BigQuery Sandbox which enables organizations to get started with BigQuery without a credit card. This has enabled us to reach tens of thousands of customers. Additionally to make it easy to get started with BigQuery we have built integrations with various Google tools like Firebase, Google Ads, Google Analytics 360, etc.
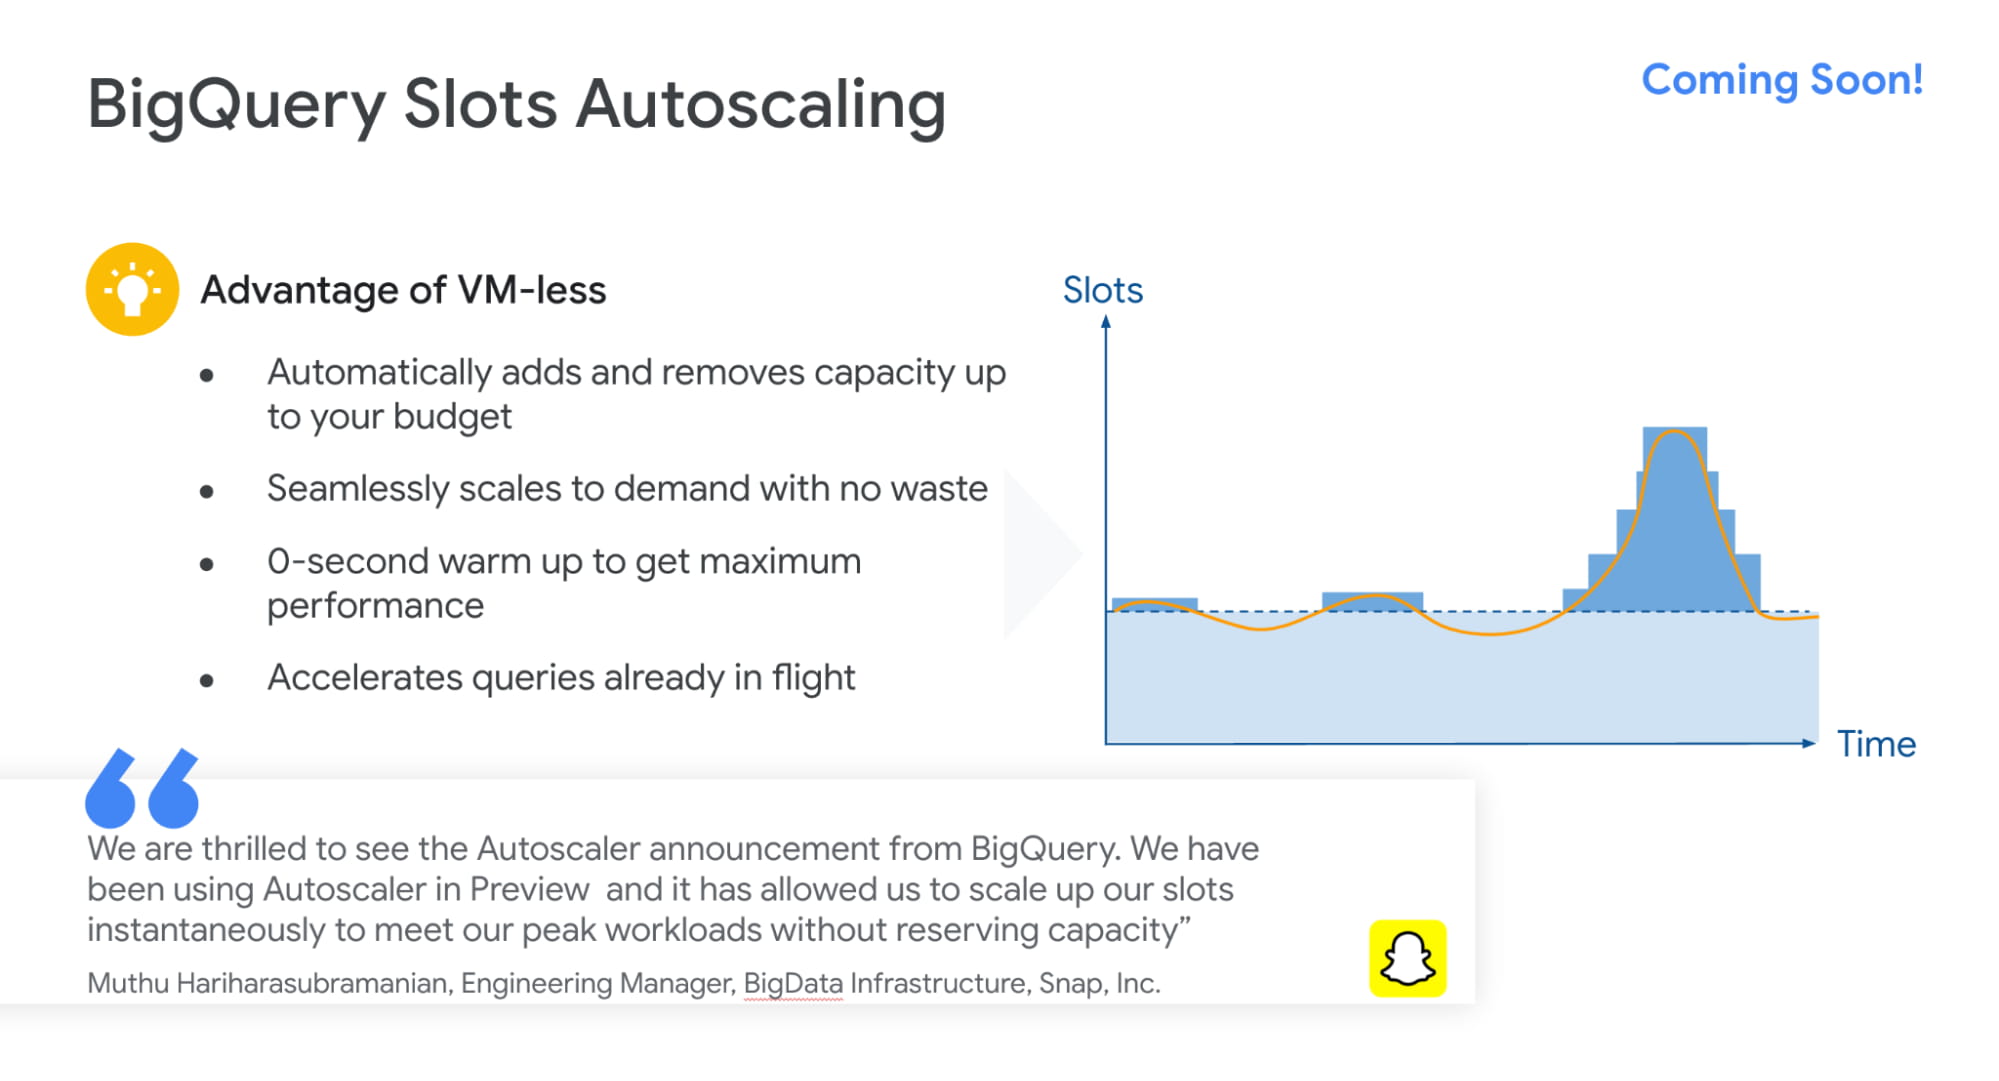
Finally, to simplify adoption we now provide options for customers to choose whether they would like to pay per query, buy flat rate subscriptions or buy per second capacity. With our autoscaling capabilities we can provide customers best value by mixing flat rate subscription discounts with auto scaling with flex slots.
Intelligent Data Warehouse to empower every data analyst to become a data scientist
BigQuery ML is one of the biggest innovations that we have brought to market over the past few years. Our vision is to make every data analyst a data scientist by democratizing Machine learning. 80% of time is spent in moving, prepping and transforming data for the ML platform. This also causes a huge data governance problem as now every data scientist has a copy of your most valuable data. Our approach was very simple. We asked:”what if we could bring ML to data rather than taking data to an ML engine?”
That is how BigQuery ML was born. Simply write 2 lines of SQL code and create ML models.
Over the past 4 years we have launched many models like regression, matrix factorization, anomaly detection, time series, XGboost, DNN etc. These models are used by customers to solve complex business problems simply from segmentation, recommendations, time series forecasting, package delivery estimation etc. The service is very popular: 80%+ of our top customers are using BigQueryML today. When you consider that the average adoption rate of ML/AI is in the low 30%, 80% is a pretty good result!

We announced tighter integration of BQML with Vertex AI. Model explainability will provide the ability to explain the results of predictive ML classification and regression models by understanding how each feature contributes to the predicted result. Also users will be able to manage, compare and deploy BigQuery ML models in Vertex; leverage Vertex Pipelines to train and predict BigQuery ML models.
Real-time streaming analytics with BigQuery
Customer expectations are changing and everyone wants everything in an instant: according to Gartner, by the end of 2024, 75% of enterprises will shift from piloting to operationalizing AI, driving a 5X increase in streaming data and analytics infrastructures.
The BigQuery’s storage engine is optimized for real-time streaming. BigQuery supports streaming ingestion of 10s of millions of events in real-time and there is no impact on query performance. Additionally customers can use materialized views and BI Engine (which is now GA) on top of streaming data. We guarantee always fast, always fresh data. Our system automatically updates MVs and BI Engine.
Many customers also use our PubSub service to collect real-time events and process these through Dataflow prior to ingesting into BigQuery. This is a streaming ETL pattern which is very popular. Last year,we announced PubSub Lite to provide customers with a 90% lower price point and aTCO that is lower than any DIY Kafka deployment.
We also announced Dataflow Prime, it is our next generation platform for Dataflow. Big Data processing platforms have only focused on horizontal scaling to optimize workloads. But we have seen new patterns and use cases like streaming AI where you may have a few steps in pipelines that perform data prep and then customers have to run a GPU based model. Customers want to use different sizes and shapes of machines to run these pipelines in the most optimum manner. This is exactly what Dataflow Prime does. It delivers vertical auto scaling with the right fitting for your pipelines. We believe this should lower costs for pipelines significantly.
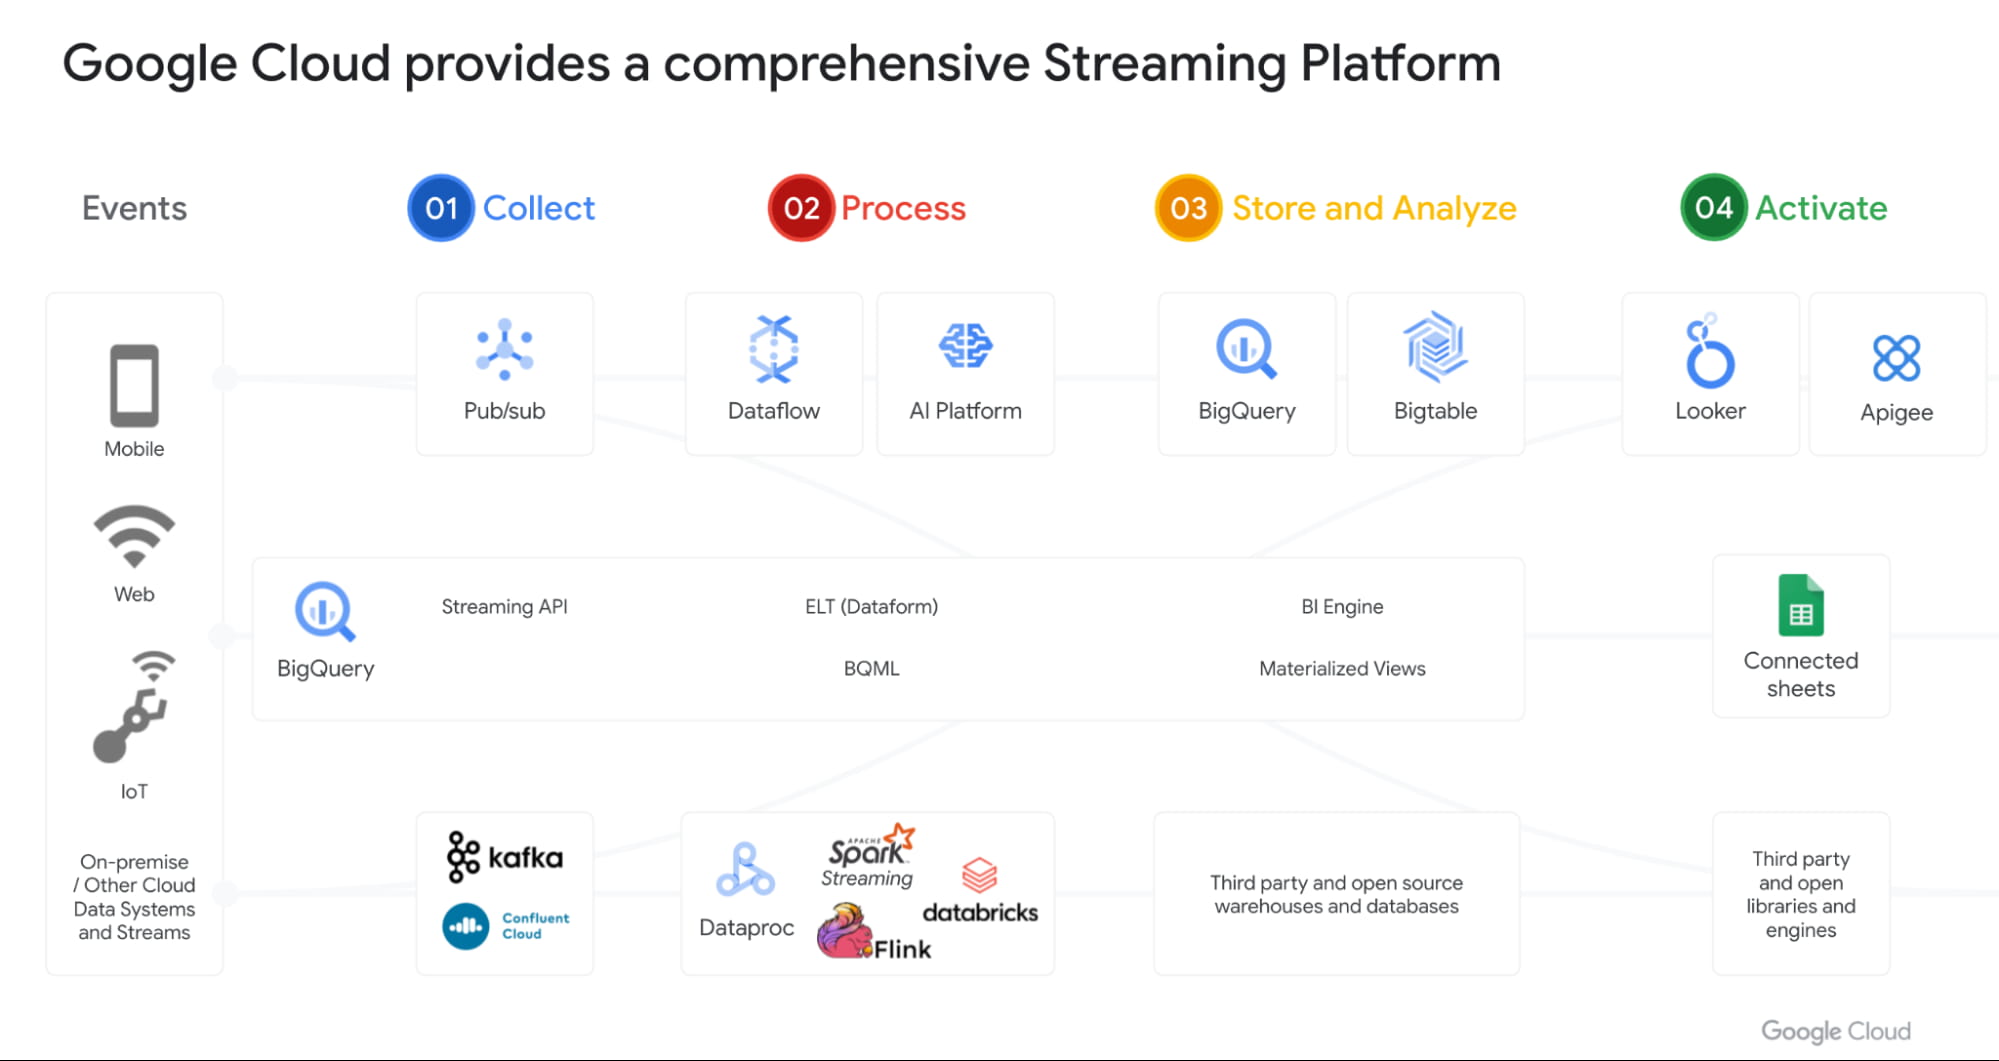
With Datastream as our change data capture service (built on Alooma technology), we have solved the last key problem space for customers. We can automatically detect changes in your operational databases like MySQL, Postgres, Oracle etc and sync them in BigQuery.
Most importantly, all these products work seamlessly with each other through a set of templates. Our goal is to make this even more seamless over next year.
Open Data Analytics with BigQuery
Google has always been a big believer in Open Source initiatives. Our customers love using various open source offerings like Spark, Flink, Presto, Airflow etc. With Dataproc & Composer our customers have been able to run various of these open source frameworks on GCP and leverage our scale, speed and security. Dataproc is a great service and delivers massive savings to customers moving from on-prem Hadoop environments. But customers want to focus on jobs and not clusters.
That’s why we launched Dataproc Serverless Spark (GA) offering at Next 2021. This new service adheres to one of our key design principles we started with: make data simple.
Just like with BigQuery, you can simply RUN QUERY. With Spark on Google Cloud, you simply RUN JOB. ZDNet did a great piece on this. I invite you to check it out!
Many of our customers are moving to Kubernetes and wanted to use that as the platform for Spark. Our upcoming Spark on GKE offering will give the ability to deploy spark workloads on existing Kubernetes clusters.
But for me the most exciting capability we have is, the ability to run Spark directly on BigQuery Storage. BigQuery storage is highly optimized analytical storage. By running Spark directly on it, we again bring compute to data and avoid moving data to compute.
BigSearch to power Log Analytics
We are bringing the power of Search to BigQuery. Customers already ingest massive amounts of log data into BigQuery and perform analytics on it. Our customers have been asking us for better support for native JSON and Search. At Next 21 we announced the upcoming availability of both these capabilities.
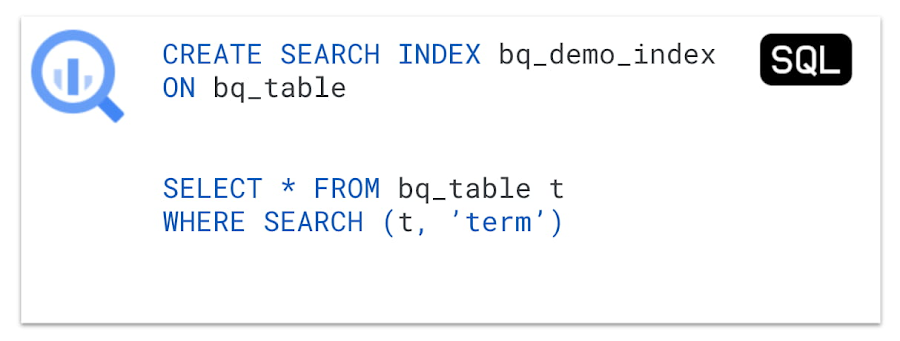
Fast cross column search will provide efficient indexing of structured, semi-structured and unstructured data. User friendly SQL functions let customers rapidly find data points without having to scan all the text in your table or even know which column the data resides in.
This will be tightly integrated with native JSON, allowing customers to get BigQuery performance and storage optimizations on JSON as well as search on unstructured or constantly changing data structures.
Multi & Cross Cloud Analytics
Research on multi cloud adoption is unequivocal — 92% of businesses in 2021 report having a multi cloud strategy. We have always believed in providing customers choice to our customers and meeting them where they are. It was clear that all our customers wanted us to take our gems like BigQuery to other clouds as their data was distributed on different clouds.
Additionally it was clear that customers wanted cross cloud analytics not multi-cloud solutions that can just run in different clouds. In short, see all their data with a single pane of glass, perform analysis on top of any data without worrying about where it is located, avoid egress costs and finally perform cross cloud analysis across datasets on different clouds.
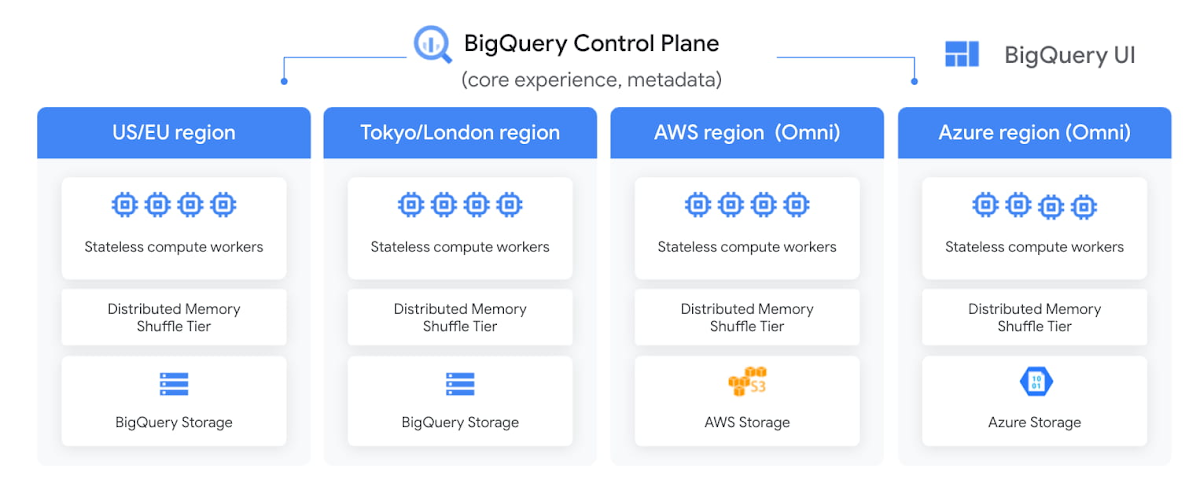
With BigQuery Omni, we deliver on this vision, with a new way of analyzing data stored in multiple public clouds. Unlike competitors, BigQuery Omni does not create silos across different clouds. BigQUery provides a single control plane that shows an analyst all data they have access to across all clouds. Analyst just writes the query and we send it to the right cloud across AWS, Azure or GCP to execute it locally. Hence no egress costs are incurred.
We announced BQ Omni GA for both AWS and Azure at Google Next 21 and I’m really proud of the team for delivering on this vision. Check out Vidya’s session and learn from Johnson and Johnson how they innovate in a multi-cloud world.
Geospatial Analytics with BigQuery and Earth Engine
We have partnered with our Google Geospatial team to deliver GIS functionality inside BigQuery over the years. At Next we announced that customers will be able to integrate Earth Engine with BigQuery, Google Cloud’s ML technologies, and Google Maps Platform.
Think about all the scenarios and use-cases your team’s going to be able to enable sustainable sourcing, saving energy or understanding business risks.
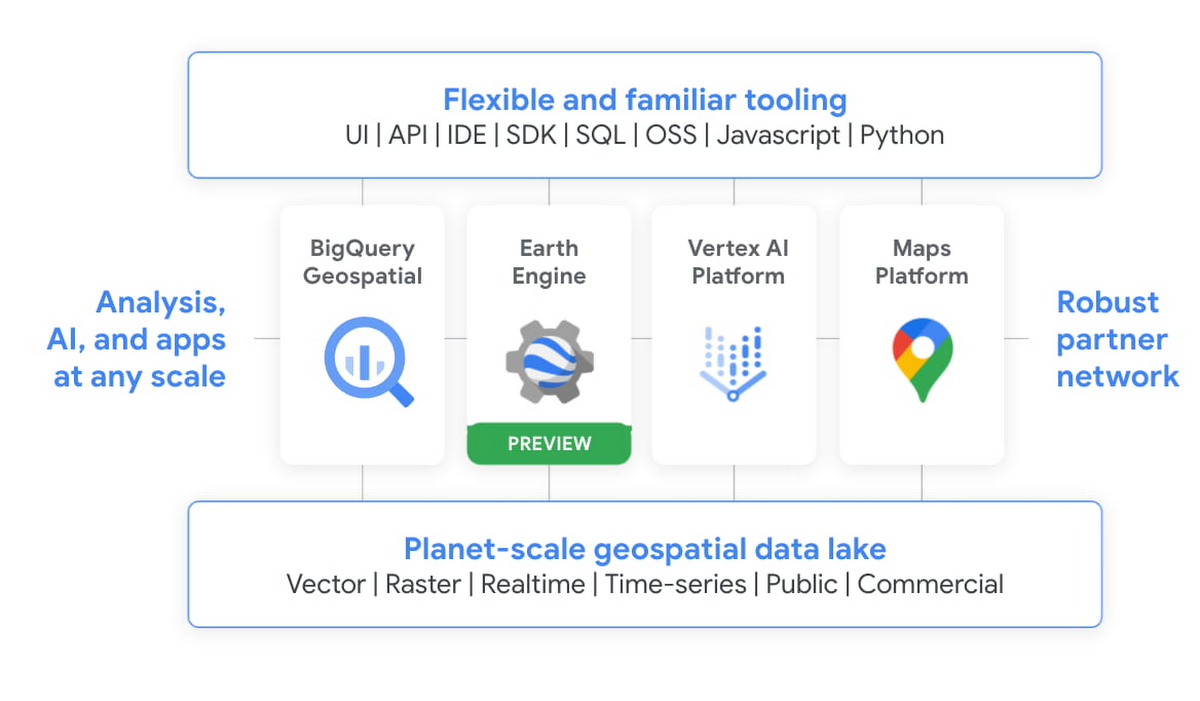
We’re integrating the best of Google and Google Cloud together to – again – make it easier to work with data to create a sustainable future for our planet.
BigQuery as a Data Exchange & Sharing Platform
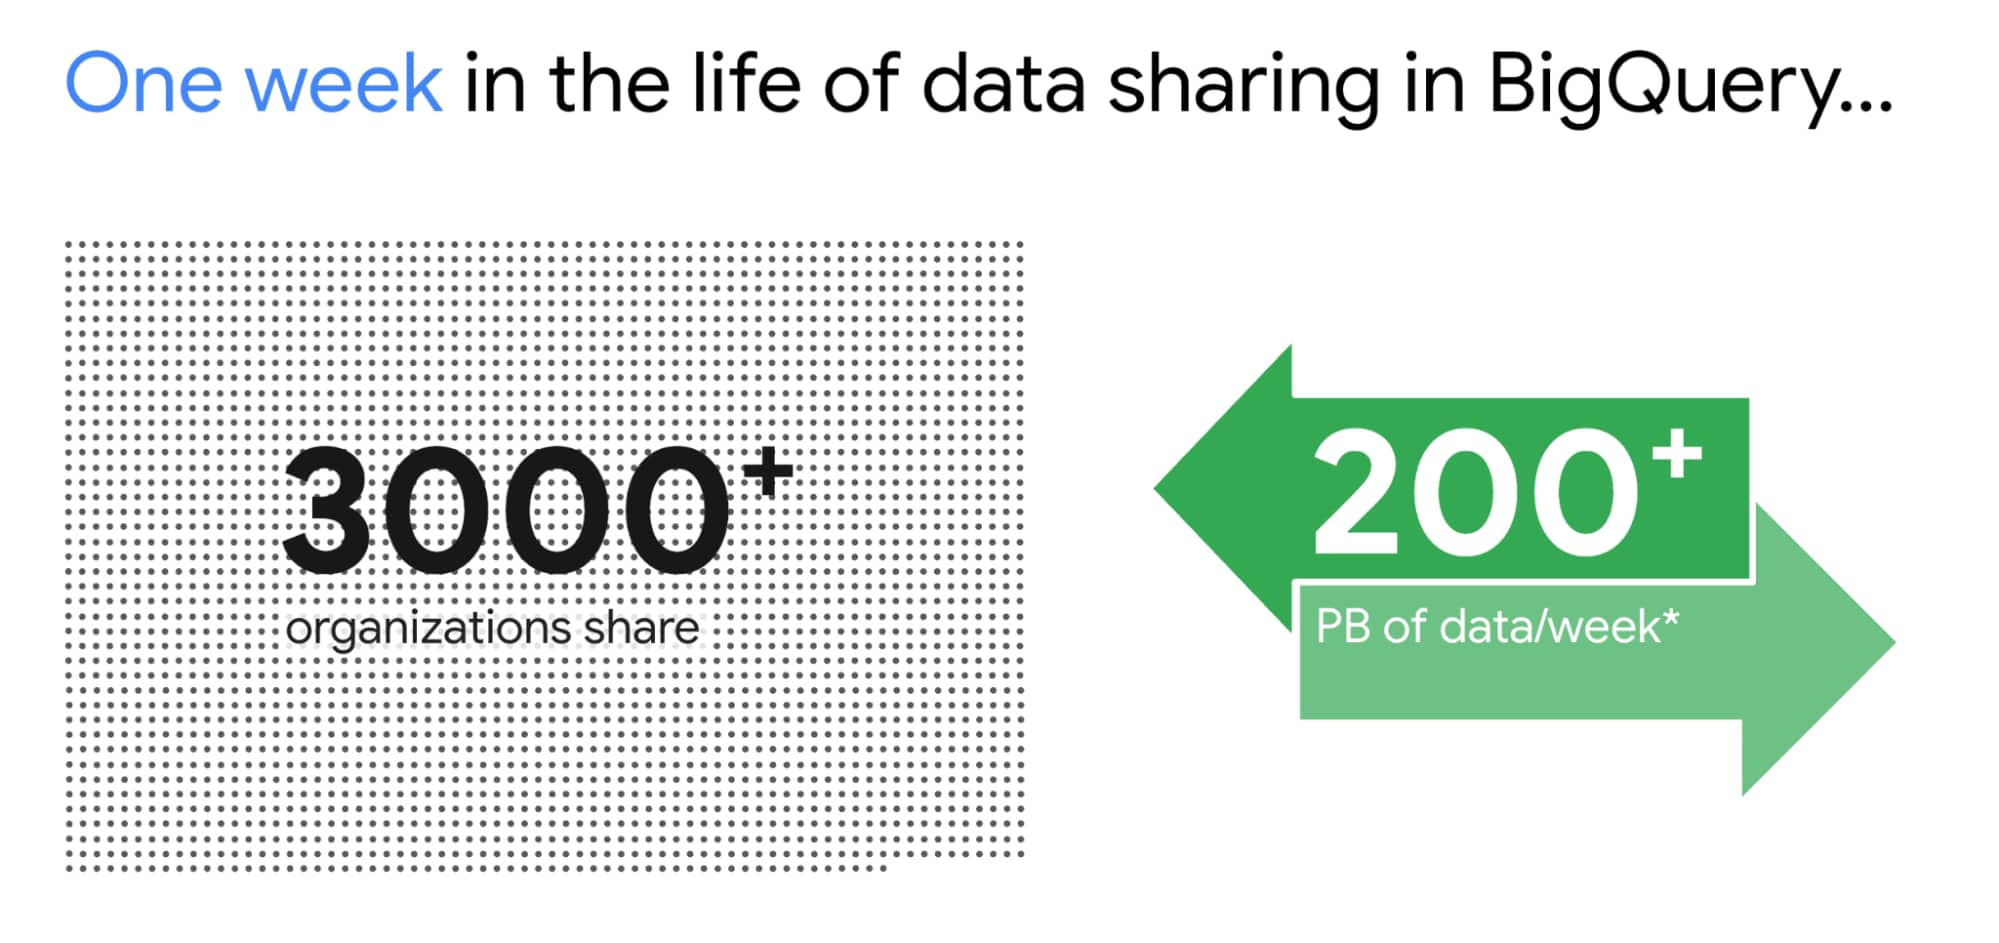
BigQuery was built to be a sharing platform. Today we have 3000+ organizations sharing more than 250 petabytes of data across organizations. Google also brings more than 150 public datasets to be used across various use cases. In addition to this, we are also bringing some of the most unique datasets like Google Trends to BigQuery. This will enable organizations to understand in real-time trends and apply to their business problems.
I am super excited about the Analytics Hub Preview announcement. Analytics Hub will provide the ability for organizations to build private and public analytics exchanges. This will include data, insights, ML Models and visualizations. This is built on top of the industry leading security capabilities of BigQuery.

Breaking Data Silos
Data is distributed across various systems in the organization and making it easy to break the data silo and make all this data accessible to all is critical. I’m also particularly excited about the Migration Factory we’re building with Informatica and the work we are doing for data movement, intelligent data wrangling with players like Trifacta and FiveTran, with whom we share over 1,000 customers (and growing!). Additionally we continue to deliver native Google service to help our customers.
We acquired Cask in 2018 and launched our self service Data Integration service in Data Fusion. Now Fusion allows customers to create complex pipelines with just simple drag and drop. This year we focused on unlocking SAP data for our customers. We have launched various SAP connectors and accelerators to achieve this.
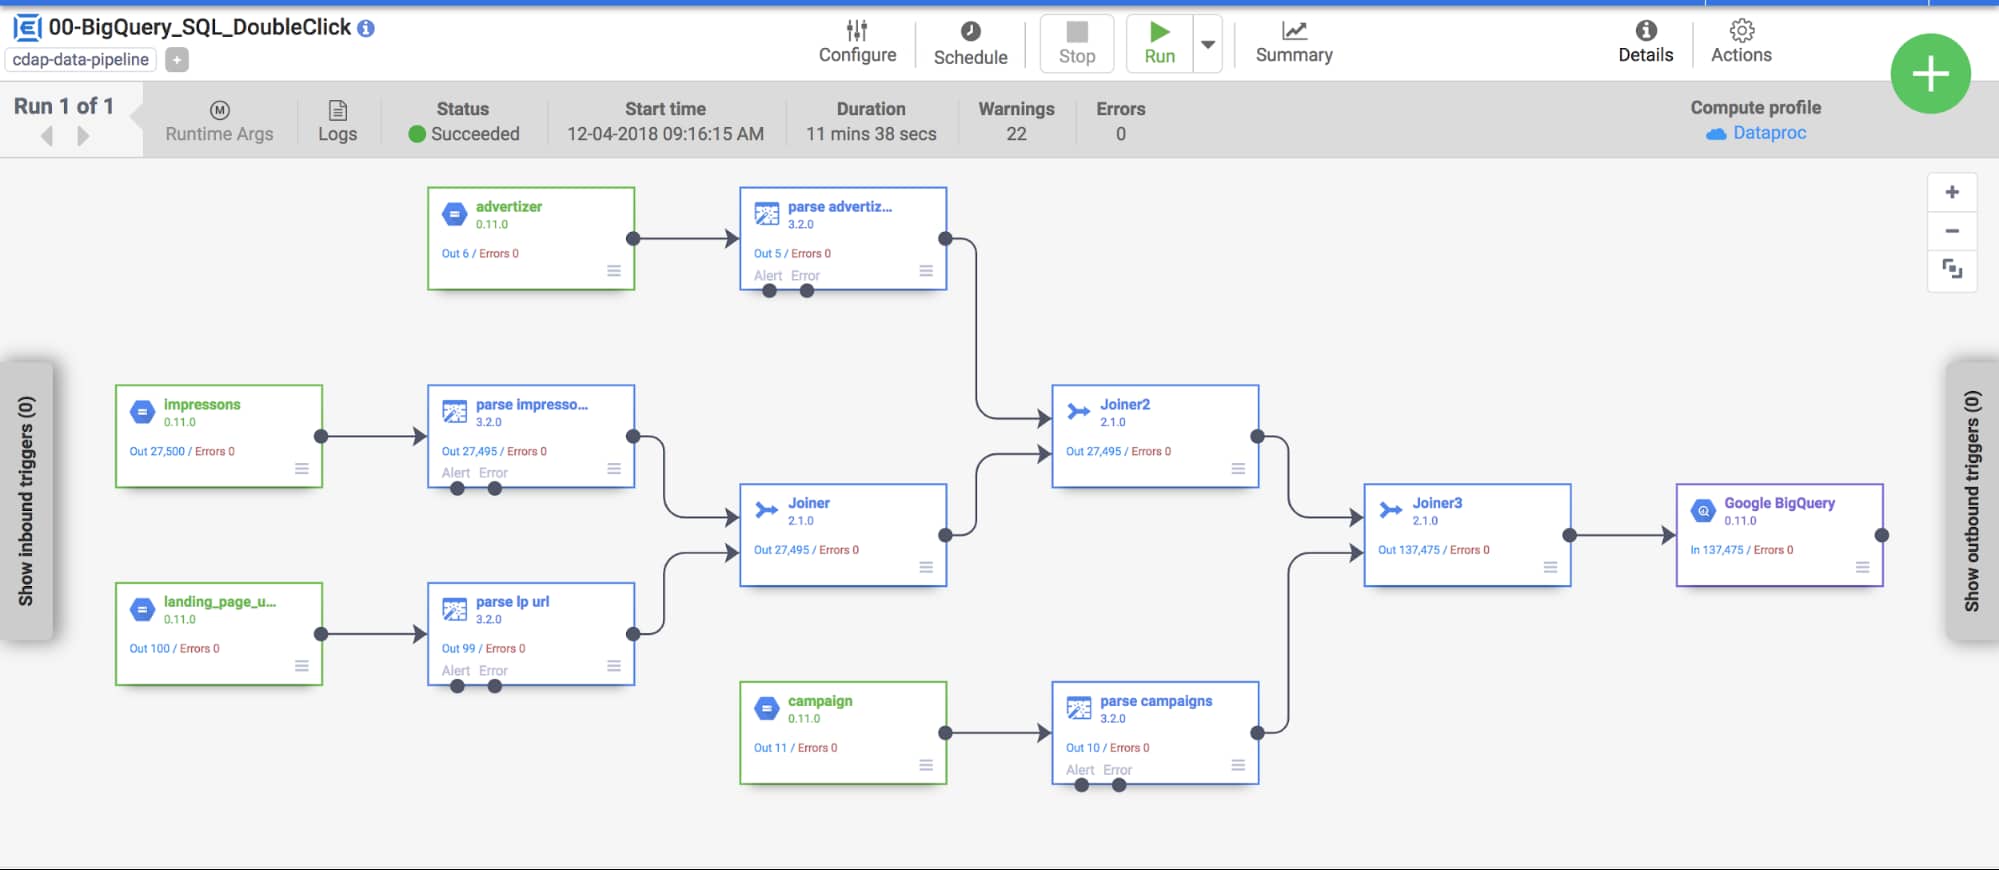
At GCP Next we also announced our BigQuery Migration service in preview. Many of our customers are migrating their legacy data warehouses and data lakes to BigQuery. BigQuery Migration Service provides end-to-end tools to simplify migrations for these customers.
And today, to make migrations to BigQuery easier for even more customers, I am super excited to announce the acquisition of CompilerWorks. CompilerWorks’ Transpiler is designed from the ground up to facilitate SQL migration in the real world and will help our customers accelerate their migrations. It supports migrations from over 10 legacy enterprises data warehouses and we will be making it available as part of our BigQuery Migration service in the coming months.
Data Democratization with BigQuery
Over the past 4 years we have focused a lot on making it very easy to derive actionable insights from data in BigQuery. Our priority has been to provide a strong ecosystem of partners that can provide you with great tools to achieve this but also deliver native Google capabilities.
With our BI engine GA announcement which we introduced in 2019, previewed earlier this year and showcased with tools like Microsoft PowerBI and Tableau, is now available for all to play with.

BigQuery + Data Studio are like peanut butter and Jelly. They just work well together. We launched BI Engine first with Data Studio and scaled it to all the users. More than 40% of our BigQuery customers use Data Studio. Once we knew BI Engine works extremely well we now have made it an integral part of BigQuery API and launched it for all our internal and partner BI tools.
We announced GA for BI Engine at Next 2021 but we were already GA with Data Studio for the past 2 years. We recently moved the Data Studio team back into Google Cloud making the partnership even stronger. If you have not used Data Studio, I encourage you to take a look and get started for free today here!!
Connected Sheets for BigQuery is one of my favorite combinations. You can give every business user in your organization the ability to analyze billions of records using standard Google Sheets experience. I personally use it everyday to analyze all our product data.
We acquired Looker in Feb 2020 with a vision of providing a semantic modeling layer to our customers with a governed BI solution. Looker is tightly integrated with BigQuery including BigQuery ML. Our latest partnership with Tableau where Tableau customers will soon be able to leverage Looker’s semantic model, enabling new levels of data governance while democratizing access to data.
Finally, I have a dream that one day we will bring Google Assistant to your enterprise data. This is the vision of Data QnA. We are in early innings on this and we will continue to work hard to make this vision a reality.
Intelligent Data Fabric to unify the platform
Another important trend that shaped our market is the Data Mesh. Earlier this year, Starburst invited me to talk about this very topic. We have been working for years on this concept, and although we would love for all data to be neatly organized in one place, we know that our customers’ reality is that it is not (If you want to know more about this, read about my debate on this topic with Fivetran’s George Fraser, a16z’s Martin Casado and Databricks’ Ali Ghodsi).
Everything I’ve learned from customers over my years in this field is that they don’t just need a data catalog or a set of data quality and governance tools, they need an intelligent data fabric. That is why we created Dataplex, whose general availability we announced at Next.
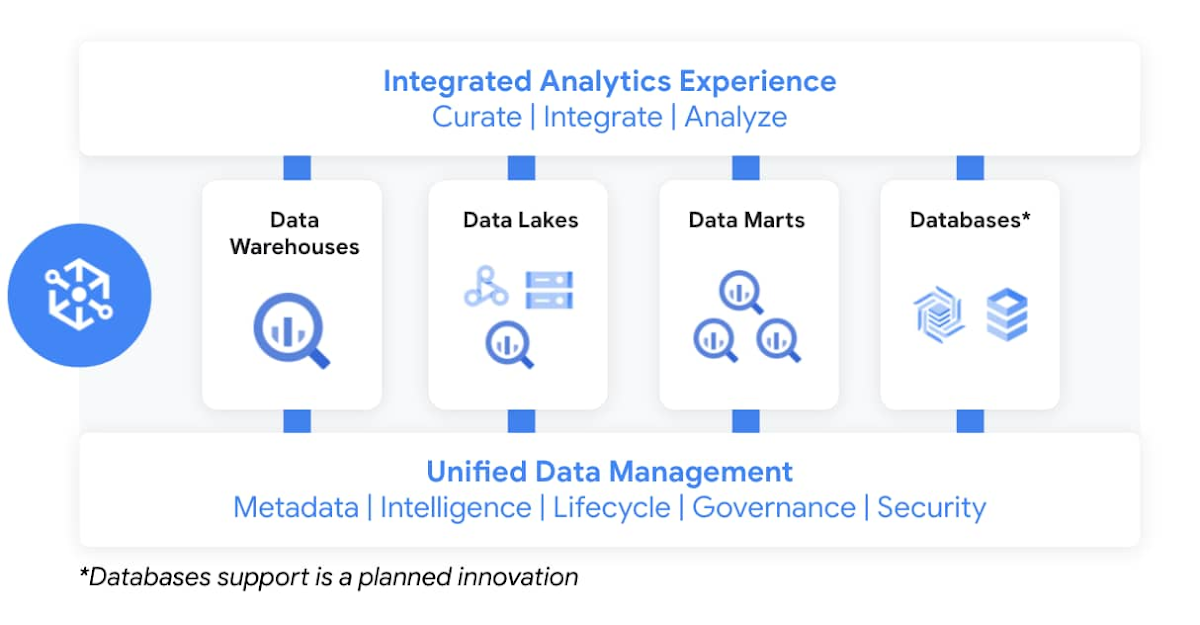
Dataplex enables customers to centrally manage, monitor, and govern data across data lakes, data warehouses, and data marts, while also ensuring data is securely accessible to a variety of analytics and data science tools. It lets customers organize and manage data in a way that makes sense for their business, without data movement or duplication. It provides logical constructs – lakes, data zones, and assets – which enable customers to abstract away the underlying storage systems to build a foundation for setting policies around data access, security, lifecycle management, and so on. Check out Prajakta Damle’s session and learn from Deutsche Bank how they are thinking about a unified data mesh across distributed data.
Closing Thoughts
Analysts have recognized our momentum and, as I look back at this year, I couldn’t thank our customers and partners enough for the support they provided my team and I across our large Data Analytics portfolio: in March, Google BigQuery was named a Leader in The Forrester Wave™: Cloud Data Warehouse, Q1 2021. And in June, Dataflow was named a Leader in The Forrester Wave™: Streaming Analytics, Q2 2021 report.
If you want to get a taste for why customers choose us over other hyperscalers or cloud data warehousing, I suggest you watch the Data Journey series we’ve just launched, which documents the stories of organizations modernizing to the cloud with us.
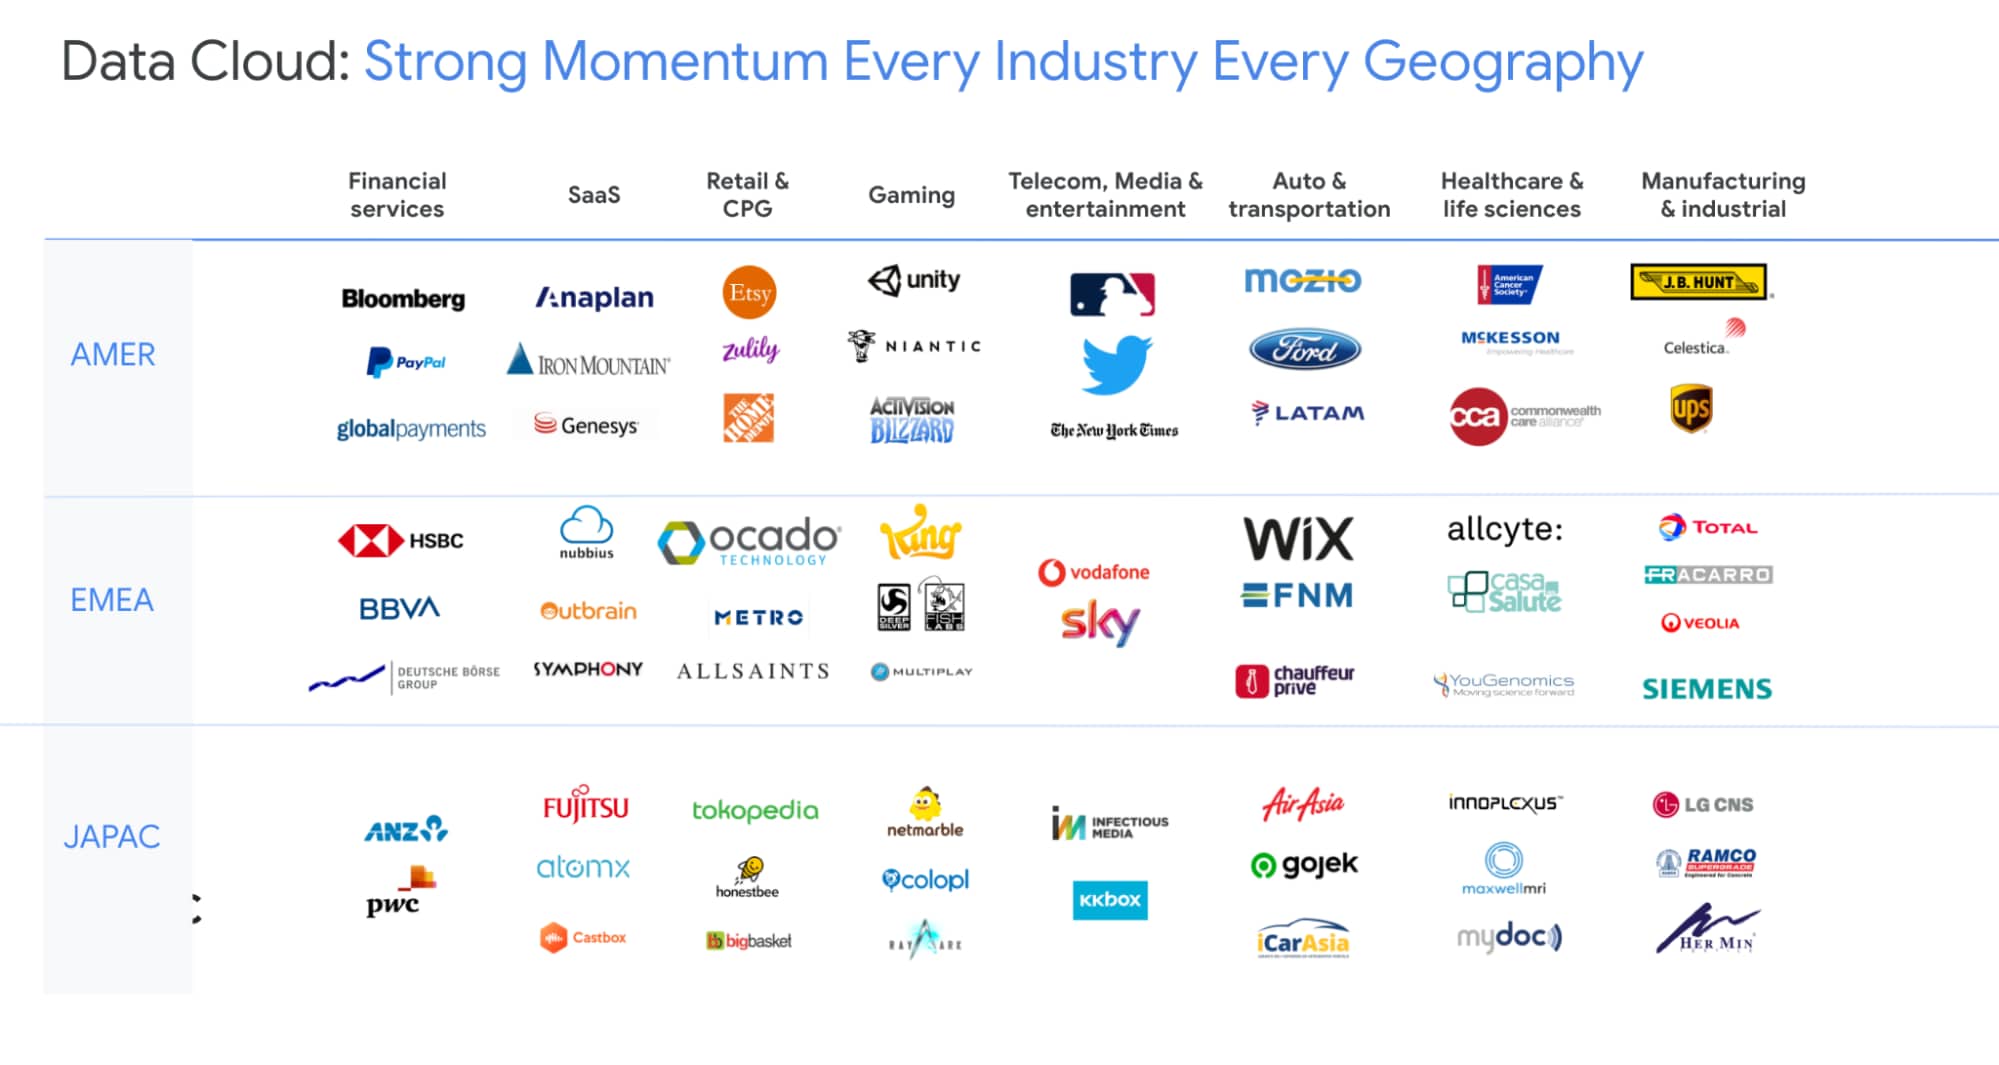
The Google Cloud Data Analytics portfolio has become a leading force in the industry and I couldn’t be more excited to have been part of it. I do miss you, my customers and partners, and I’m frankly bummed that we didn’t get to meet in person like we’ve done so many times before (see a photo of my last in-person talk before the pandemic), but this Google Next was extra special, so let’s dive into the product innovation and their themes.
I hope that I will get to see you in person next time we run Google Next!
Query Insights for Spanner: A blessing for developers and DBAs

3296
Of your peers have already read this article.
1:30 Minutes
The most insightful time you'll spend today!
Today, application development teams are more agile and are shipping features faster than ever before. In addition to these rapid development cycles and the rise of microservices architectures, the end-to-end ownership of feature development (and performance monitoring) has moved to a shared responsibility model between advanced database administrators and full-stack developers. However, most developers don’t have the years of experience or the time needed to debug complex query performance issues and database administrators are now a scarce resource in most organizations. As a result, there is a dire need for tools for developers and DBAs alike to quickly diagnose performance issues.
Introducing Query Insights for Spanner
We are delighted to announce the launch of Query Insights for Spanner, a set of visualization tools that provide an easy way for developers and database administrators to quickly diagnose query performance issues on Spanner. Using Query Insights, users can now troubleshoot query performance in a self-serve way. We’ve designed Query Insights using familiar design patterns with world-class visualizations to provide an intuitive experience for anyone who is debugging issues with query performance on Spanner. Query Insights is available at no additional cost.
By using out-of-the-box visual dashboards and graphs, developers can visualize aberrant behavior like peaks and troughs in various performance metrics over a time-series and quickly identify problematic queries. Time series data provides significant value to organizations because it enables them to analyze important real-time and historical metrics. Data is valuable only if it’s easy to comprehend;. that’s where being able to view intuitive dashboards becomes a force multiplier for organizations looking to expose their time series data across teams.
Follow a visual journey with pre-built dashboards
With Query Insights, developers can seamlessly move from detection of database performance issues to diagnosis of problematic queries using a single interface. Query Insights will help identify query performance issues easily with pre-built dashboards.
The user could do this by following a simple journey where they can quickly confirm, identify and analyze query performance issues. Let’s walk through an example scenario.
Understand database performance
This journey will start by the user setting up an alert on Google Cloud Monitoring for CPU utilization going above a certain threshold. The alert could be configured in a way that if this threshold is crossed, the user will be notified with an email alert, with a link to the “Monitoring” dashboard.
Once the user receives this alert, they would click on the link in the email, and navigate to the “Monitoring” dashboard. If they observe high CPU Utilization and high read latencies, the possible root cause could be expensive queries. A spike in CPU Utilization could be a strong signal that the system is using more compute than it usually would, due to an inefficient query.
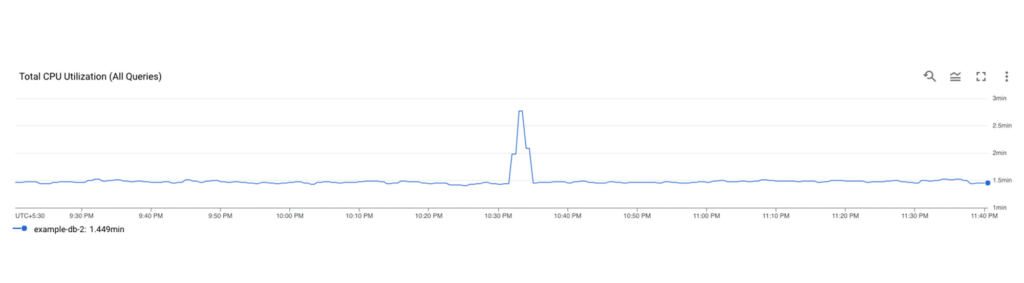
The next step is to identify which query might be the problem, this is where Query Insights comes in. The user can get to this tool by clicking on Query Insights in the left navigation of your Spanner Instance. Here, they can drill down into the CPU usage by query and observe that for a specific database, CPU Utilization (attributed to all queries) is spiking for a particular time window. This confirms that the CPU utilization is due to inefficient queries.
Identifying a problematic query
The user now observes the TopN (Top queries by CPU Utilization) query graph to see the TopN queries by CPU Utilization. From the graph, it is very easy to visualize and identify the top queries which could be causing the spike in CPU Utilization.
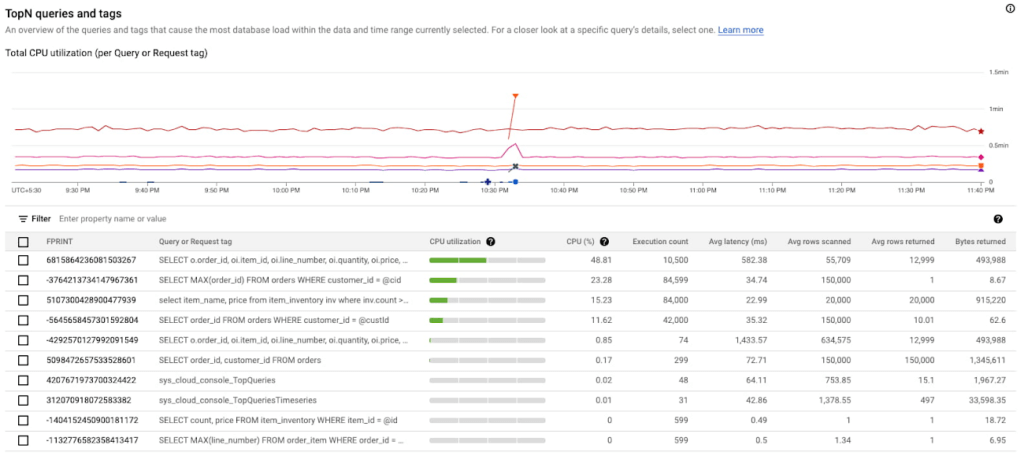
In the above screenshot, we can see that the first query in the table is showing a clear spike at 10:33 PM consuming 48.81% of total CPU. This is a clear indication that this query could be problematic, and the user should investigate further.
Analyzing the query performance
Once they have identified the problematic query, they can now drill down into this query shape to confirm, identify the root cause of the high CPU utilization.
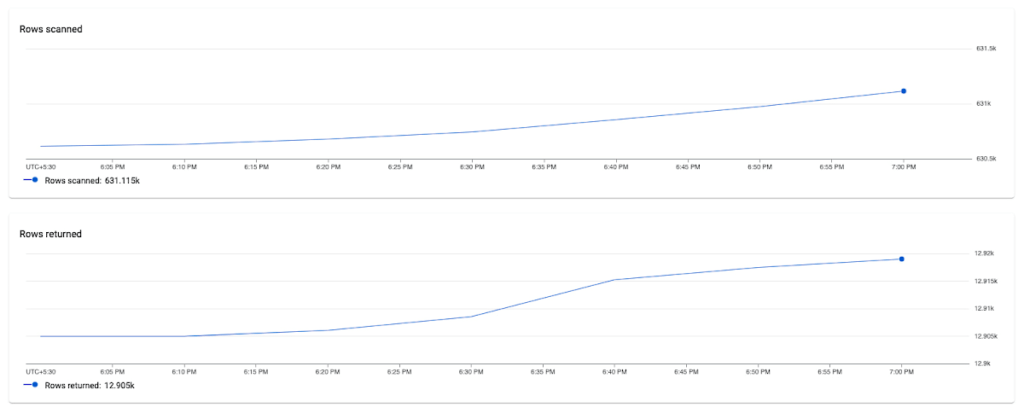
They can do this by clicking on the Fingerprint ID for the specific query from the topN table, and navigating to the Query Details page where they will be able to see a list of metrics (Latency, CPU Utilization, Execution count, Rows Scanned / Rows Returned) over a time series for that specific query.
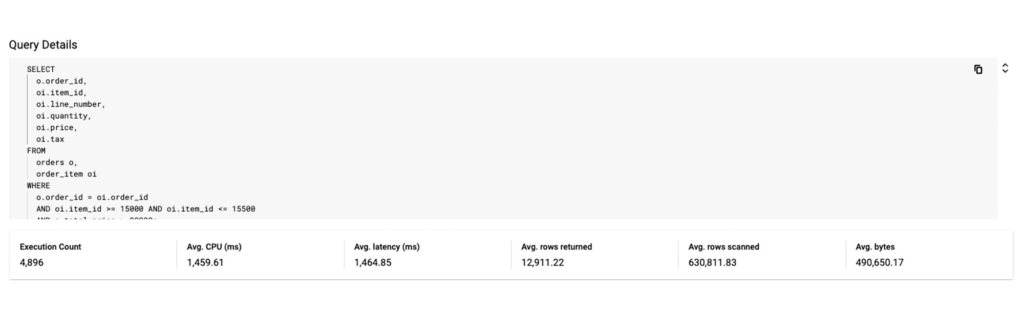
In this example, we notice that the average number of rows scanned for this specific query are very high (~ 600k rows scanned to return ~ 12k rows), which could point to a poor query design, resulting in an inefficient query. We can also observe that latency is high (1.4s) for this query.
Fixing the issue
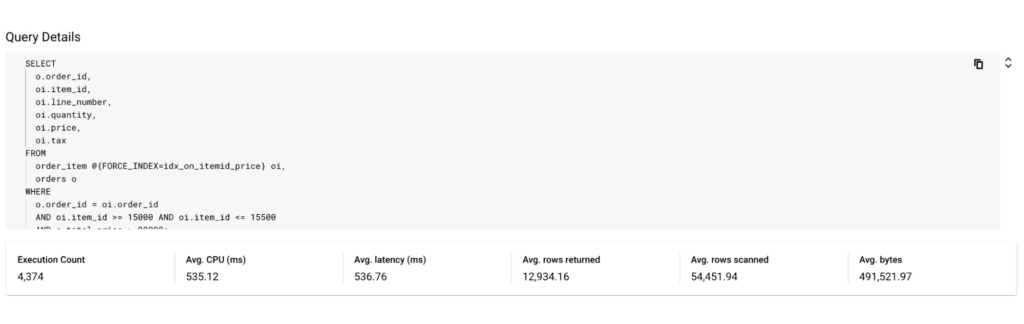
To fix the problem in this scenario, the user could optimize this query by specifying a secondary index in the query using a FORCE_INDEX query hint to provide an index directive. This would provide more consistent performance, make the query more efficient, and lower CPU utilization for this query.
In the screenshot below, you can see that after specifying the index in the query, the query performance dramatically increases in terms of CPU, rows scanned (54K vs 630k) and also in terms of query latency (536 ns vs 1.4 s).
Unoptimized Query:
Optimized Query:
By following this simple visual journey, the user can easily detect, diagnose and debug inefficient queries on Spanner.
Get started with Query Insights today
To learn more about Query Insights, review the documentation here. Query Insights is enabled by default. In the Spanner console, you can click on Query Insights in the left navigation and start visualizing your query performance metrics!
New to Spanner? Get started in minutes with a new database.
More Relevant Stories for Your Company

Move over Myths! Here’s What You Need to Know about Cloud Spanner
Intro to Cloud Spanner Cloud Spanner is an enterprise-grade, globally distributed, externally consistent database that offers unlimited scalability and industry-leading 99.999% availability. It requires no maintenance windows and offers a familiar PostgreSQL interface. It combines the benefits of relational databases with the unmatched scalability and availability of non-relational databases. As organizations

ActivStat: Enhancing Live Sports Broadcast with Real-time Stats and Metrics
Millions of people annually view esports, as top players and teams compete in thrilling, fast-paced tests of reflexes, strategy, and teamwork. Fans are a diverse group, sharing a passion for action. A new, revolutionary project we’re working on with Call of Duty League just made that action a lot better.

Transforming Software Development Education with CourseMatix
As the world increasingly relies on software, businesses have struggled to find enough developer talent to build and maintain their applications. IDC estimates the global shortage of software developers reached 1.4 million in 2021 and expects that number to balloon to 4 million by 2025. Higher education is a great starting

“It’s an Astonishing Difference”: What Data Operation Execs say About Google Cloud’s Data Warehouse
The popularity of meal kit delivery services has surged in recent years as consumer attitudes toward home cooking and grocery shopping have shifted. As a pioneer in the category, Blue Apron helps its customers create incredible home cooking experiences by sending culinary-driven recipes with high-quality ingredients and step-by-step instructions straight to customers’
