





11 Google Cloud Analytics Tools, Each Explained Simply in Under 2 Minutes

3568
Of your peers have already read this article.
22:00 Minutes
The most insightful time you'll spend today!
Need a quick overview of Google Cloud analytics technologies? Quickly learn these 11 Google Cloud products—each explained in under two minutes.
BigQuery in a minute
Storing and querying massive datasets can be time consuming and expensive without the right infrastructure. This video gives you an overview of BigQuery, Google’s fully-managed data warehouse. Watch to learn how to ingest, store, analyze, and visualize big data with ease.
Firestore in a minute
Cloud Firestore is a NoSQL document database that lets you easily store, sync, and query data for your mobile and web apps, at global scale. In this video, learn how use Firestore and discover features that simplify app development without compromising security.
Cloud Spanner in a minute
Cloud Spanner is a fully managed relational database with unlimited scale, strong consistency, and up to 99.999% availability. In this video, you’ll learn how Cloud Spanner can help you create time-sensitive, mission critical applications at scale.
Cloud SQL in a minute
Cloud SQL is a fully-managed database service that helps you set up, maintain, manage, and administer your relational databases on Google Cloud. In this video you’ll learn how Cloud SQL can help you with time-consuming tasks such as patches updates, replicas, and backups so you can focus on designing your application.
Memorystore in a minute
Memorystore is a fully managed and highly available in-memory service for Google Cloud applications. This tool can automate complex tasks, while providing top-notch security by integrating IAM protocols without increasing latency. Watch to learn what Memorystore is and what it can do to help in your developer projects.
Bigtable in a minute
Cloud Bigtable is a fully managed, scalable NoSQL database service for large analytical and operational workloads. In this video, you’ll learn what Bigtable is and how this key-value store supports high read and write throughput, while maintaining low latency.
BigQuery ML in a minute
BigQuery ML lets you create and execute machine learning models in BigQuery by using standard SQL queries. In this video, learn how you can use BigQuery ML for your machine learning projects.
Dataflow in a minute
Dataflow is a fully managed streaming analytics service that minimizes latency, processing time, and cost through autoscaling and batch processing. In this video, learn how it can be used to deploy batch and streaming data processing pipelines.
Cloud Pub/Sub in a minute
Cloud Pub/Sub is an asynchronous messaging service that decouples services that produce events from services that process events. In this video, you’ll learn how you can use it for message storage, real-time message delivery, and much more, while still providing consistent performance at scale and high availability.
Dataproc in a minute
Dataproc is a managed service that lets you take advantage of open source data tools like Apache Spark, Flink and Presto for batch processing, SQL, streaming, and machine learning. In this video, you’ll learn what Dataproc is and how you can use it to simplify data and analytics processing.
Data Fusion in a minute
Cloud Data Fusion is a fully managed, cloud-native, enterprise data integration service for quickly building and managing data pipelines. In this video, you’ll learn how Cloud Data Fusion can help you build smarter data marts, data lakes, and data warehouses.
3280
Of your peers have already watched this video.
5:00 Minutes
The most insightful time you'll spend today!
What is Dataflow?
What is Dataflow, and how can you use it for your data processing needs?
In this episode of Google Cloud Drawing Board, Priyanka Vergadia walks you through Dataflow, a serverless system for processing and enriching data, supporting both streaming and batch models.
Here’s what’s inside:
0:00 – 0:14 Video snapshot
0:15 – 0:57 What is Dataflow
0:58 – 2:23 How does Dataflow work
2:24 – 3:34 How to use Dataflow
3:35 – 3:58 Dataflow security
3:58 – 4:24 What does it cost to use Dataflow
4:25 – 4:55 Dataflow use cases
Data to Business Outcomes with Google’s Data Analytics Design Pattern

6753
Of your peers have already read this article.
1:30 Minutes
The most insightful time you'll spend today!
Companies today are inundated with vast amounts of data from various sources. This overwhelming amount of data is meant to benefit the company, but often leaves data teams feeling overwhelmed, which can create data bottlenecks and result in a slow time to value. In fact, only twenty seven percent of companies agree that data and analytics projects produce insights and recommendations that are highly actionable (Accenture). This means that nearly 3 in 4 companies are not unlocking value in their data, which poses a huge challenge for organizations trying to move the needle and drive real business results. We at Google Cloud, however, saw opportunity in this challenge, which is why we created Data Analytics Design Patterns: cross-product technical solutions designed to accelerate a customer’s path to value realization with their data. These industry solutions bring together product capabilities alongside design methodology, open source deployable code, data models, and reference architectures to accelerate your business outcomes.

With Data Analytics Design Patterns, you get access to more than 30 ready-to-deploy data analytics solutions. Design patterns leverage the best of Google and our rich partner ecosystem, including Technology Partners & System Integrators. In this blog, we will cover 3 examples on how a design pattern can be applied to unlock the value of data:
- Improve mobile app experience with Unified App Analytics
- Maximize digital shop’s revenue with Price Optimization
- Protect internal systems from security and malware threat with Anomaly Detection
Unified App Analytics
If mobile apps are part of your go-to-market strategy, you have several data sources that can provide invaluable customer insights. In addition to tools such as CRM (e.g. Salesforce) and customer care (e.g. Zendesk), you likely use Google Analytics to log app events and Firebase Crashlytics to gather data about app errors. But can you easily combine back-end server data with app front-end data to unlock customer insights?
The Unified App Analytics design pattern makes it easy to plug all the disparate data sources into a single warehouse (BigQuery) and start analyzing it with a Business Intelligence tool (Looker). Once you have a complete and real time view of your customer experience with your app, you can take action. For example, if you notice an increase in app errors, you can quickly combine your Crashlytics data with your CRM data to narrow down the crashes with the highest revenue impact and prioritize their resolution. Further, you can automate your issue resolution workflow by creating a rule for any future crash that impacts a subset of VIP customers.

With the Unified App Analytics design pattern, you’ll gain access to valuable insights about your user experience with your app so you can inform your future app strategy. For example, NPR, an American media company, increased user engagement by showing content that better mapped to listener interests and behaviors.
Price Optimization
In a competitive and hectic global marketplace, strategic pricing matters more than ever, but often projects are consumed by the tedium of standardizing, cleaning, and preparing data—from transactions, inventory, demand, among other sources.
Price Optimization solution allows retailers to build a data driven pricing model. The solution consists of three main components:
- Dataprep by Trifacta: integrates different data sources into a single Common Data Model (CDM). Dataprep is an intelligent data service for visually exploring, cleaning, and preparing structured and unstructured data for analysis, reporting, and machine learning.
- BigQuery: allows you to create and store pricing models in a consistent and scalable way as a serverless Cloud Data Warehouse service
- Looker dashboards: surface insights and enable business teams to take action with enterprise ready BI platform
With the Price Optimization design pattern from Google Cloud and our partner Trifacta, you’ll be able to rapidly unify multiple data sources and create a real-time and ML-powered analysis, leveraging predictive models to estimate future sales. For example, PDPAOLA, an online jewelry company, doubled sales with dynamic pricing adjustments enabled by a single data view.

Anomaly Detection
Organizations need to anticipate and act on risks and opportunities to stay competitive in a digitally transforming society. Anomaly detection helps organizations identify and respond to data points and data trends in high velocity, high volume data sets that deviate from historical standards and expected behaviors, allowing them to take action on changing user needs, mitigate malicious actors and behaviors, and prevent unnecessary costs and monetary losses.
The Anomaly Detection design pattern uses Google Pub/Sub, BigQuery, Dataflow, and Looker to:
- Stream events in real time
- Process the events, extract useful data points, train the detection algorithm of choice
- Apply the detection algorithm in near-real time to the events to detect anomalies
- Update dashboards and/or send alerts
The challenge of finding the important insights and anomalies in vast amounts of data applies to organizations across all industries and lines of business, but is especially important to protecting the security of an organization. For example, TELUS, a national communications company, modernized their security analytics platform leveraging this pattern, allowing them to detect anomalies in near real time to detect and mitigate suspicious activity.
Get started
Turn your data into business outcomes with Google Cloud and our broad partner ecosystem by deploying Data Analytics Design Patterns at your organization. There are more than 30 Data Analytics Design Patterns ready for you to use. We have more than 200+ more ideas in the pipeline, so be sure to check in regularly as new patterns will be added soon.
To dive deeper and find out more about how Data Analytics Design Patterns can help your organization accelerate use cases and create faster time to value, check out this video.
Google Cloud’s Virtual Appointment Scheduling Tool (VAST) Helps State of Arizona Recover from Unemployment Situation

6563
Of your peers have already read this article.
2:00 Minutes
The most insightful time you'll spend today!
When the world was forced to go primarily online, state governments also faced the reality of needing to provide community services without the health risk of meeting in person. Old systems that relied on interpersonal contact could not keep up. An unprecedented number of displaced workers swamped every unemployment system. The capacity challenges weren’t limited to state labor departments either. Everything from birth certificates and marriage licenses to apostilles and court system services that could usually be handled by a simple walk-in had to be scheduled in advance. Both internal and external communication suffered.
To meet these challenges, many organizations turned to new technology solutions and innovative approaches.
How VAST helped Arizona get back to work
The State of Arizona had tens of thousands of constituents who relied on pandemic unemployment insurance and would also need tools to reenter the workforce.Tim Tucker, Deputy Administrator of the Workforce Development Administration for the Arizona Department of Economic Security, started preparing in late 2020. He collaborated with Google Cloud and SADA to introduce the Virtual Appointment Scheduling Tool (VAST) to State of Arizona staff members. Using VAST reduced the excessive workload taken on by the Workforce Development Administration as they got Arizona back to work. VAST lets constituents book an appointment, upload documents and forms, and conduct career counseling virtually. This helped constituents move through the system faster so they could successfully reenter the workforce.
That preparation paid off. As of September 2021, Arizona had recovered the majority of the jobs lost during the pandemic. It has also seen one of the smallest percent change in employment compared with pre-pandemic numbers. Even more impressive, Arizona is one of only five states where unemployment claims are now lower than pre-pandemic numbers. Using VAST helped them get people back to work faster and has become a permanent part of their unemployment program.
Bringing streamlined services to the community
To fully realize a solution to the challenges faced by our public sector customers, we focused on three key areas in which we knew we needed VAST to excel:
- Efficient staff allocation
- Streamlined internal meetings
- Confident constituent interactions
We also knew our customers needed to get VAST online fast, and it needed to work with existing infrastructure without requiring a total overhaul. These areas informed the design of VAST’s features and have allowed us to meet the challenges faced by agencies such as the Arizona Department of Economic Security.
Virtual Agent support and integrations
VAST gives constituents 24×7 virtual agent support powered by Google Cloud’s contact center AI virtual agents. Virtual agents are custom programmed to fit the specific needs of each agency and community they serve. It’s easy to add new options and information whenever an update is needed. Virtual agents can be designed to understand the user’s intent and serve up relevant content for a smooth user experience on both ends of the system. Virtual agents run at scale and offer multi-language support, ensuring they can serve everyone in the community. By pairing these with VAST, constituents can experience seamless self-service.
6 week deployment time
Most of our public sector clients needed a solution yesterday. VAST can be deployed rapidly, taking about six weeks from start to finish, which includes everything–even staff training time.
Integration with Google Workspace and Chrome
VAST securely integrates with other Google solutions, such as Google Workspace and Chromebooks. We work to ensure VAST is fully functional within your existing systems.
Collaboration and support
SADA collaborates with each organization to ensure that the design, development, and functionality of VAST align with their needs. SADA specializes in helping public sector customers migrate to Google Cloud.
Analytics
Application administrators have access to analytic data gathered by VAST and options to customize and add additional datasets.This data helps organizations find blind spots in coverage, fix service bottlenecks, and better organize internal resources. Leveraging this data gives organizations the power to make changes, resulting in everything from a smoother customer experience to cost savings.
To learn more about how Google Cloud has supported Arizona during the pandemic, check out this blog on how their vaccination distribution system leveraged Google Cloud to get the vaccine to more people. For more information on how VAST can streamline a customer experience.
Build Open Data Platform on GCP with Delta Lake, Presto and Dataproc

3411
Of your peers have already read this article.
5:00 Minutes
The most insightful time you'll spend today!
Organizations today build data lakes to process, manage and store large amounts of data that originate from different sources both on-premise and on cloud. As part of their data lake strategy, organizations want to leverage some of the leading OSS frameworks such as Apache Spark for data processing, Presto as a query engine and Open Formats for storing data such as Delta Lake for the flexibility to run anywhere and avoiding lock-ins.
Traditionally, some of the major challenges with building and deploying such an architecture were:
- Object Storage was not well suited for handling mutating data and engineering teams spent a lot of time in building workarounds for this
- Google Cloud provided the benefit of running Spark, Presto and other varieties of clusters with the Dataproc service, but one of the challenges with such deployments was the lack of a central Hive Metastore service which allowed for sharing of metadata across multiple clusters.
- Lack of integration and interoperability across different Open Source projects
To solve for these problems, Google Cloud and the Open Source community now offers:
- Native Delta Lake support in Dataproc, a managed OSS Big Data stack for building a data lake with Google Cloud Storage, an object storage that can handle mutations
- A managed Hive Metastore service called Dataproc Metastore which is natively integrated with Dataproc for common metadata management and discovery across different types of Dataproc clusters
- Spark 3.0 and Delta 0.7.0 now allows for registering Delta tables with the Hive Metastore which allows for a common metastore repository that can be accessed by different clusters.
Architecture
Here’s what a standard Open Cloud Datalake deployment on GCP might consist of:
- Apache Spark running on Dataproc with native Delta Lake Support
- Google Cloud Storage as the central data lake repository which stores data in Delta format
- Dataproc Metastore service acting as the central catalog that can be integrated with different Dataproc clusters
- Presto running on Dataproc for interactive queries
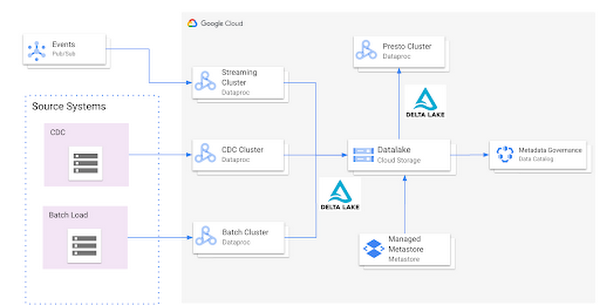
Such an integration provides several benefits:
- Managed Hive Metastore service
- Integration with Data Catalog for data governance
- Multiple ephemeral clusters with shared metadata
- Out of the box integration with open file formats and standards
Reference implementation
Below is a step by step guide for a reference implementation of setting up the infrastructure and running a sample application
Setup
The first thing we would need to do is set up 4 things:
- Google Cloud Storage bucket for storing our data
- Dataproc Metastore Service
- Delta Cluster to run a Spark Application that stores data in Delta format
- Presto Cluster which will be leveraged for interactive queries
Create a Google Cloud Storage bucket
Create a Google Cloud Storage bucket with the following command using a unique name.
gsutil mb gs://<your-bucket-name>
Create a Dataproc Metastore service
Create a Dataproc Metastore service with the name “demo-service” and with version 3.1.2. Choose a region such as us-central1. Set this and your project id as environment variables.
REGION=<your-region>PROJECT_ID=<your-project-id>gcloud metastore services create demo-service \--hive-metastore-version=3.1.2 \--location=${REGION}
Create a Dataproc cluster with Delta Lake
Create a Dataproc cluster which is connected to the Dataproc Metastore service created in the previous step and is in the same region. This cluster will be used to populate the data lake. The jars needed to use Delta Lake are available by default on Dataproc image version 1.5+
gcloud dataproc clusters create delta-cluster \--dataproc-metastore=projects/${PROJECT_ID}/locations/us-central1/services/demo-service \--region=${REGION} \--image-version=2.0.0-RC22-debian10
Create a Dataproc cluster with Presto
Create a Dataproc cluster in us-central1 region with the Presto Optional Component and connected to the Dataproc Metastore service.
gcloud dataproc clusters create presto-cluster \--dataproc-metastore=projects/${PROJECT_ID}/locations/us-central1/services/demo-service \--region=${REGION} \--image-version=2.0-debian10 \--optional-components=PRESTO \--enable-component-gateway
Spark Application
Once the clusters are created we can log into the Spark Shell by SSHing into the master node of our Dataproc cluster “delta-cluster”.. Once logged into the master node the next step is to start the Spark Shell with the delta jar files which are already available in the Dataproc cluster. The below command needs to be executed to start the Spark Shell. Then, generate some data.
spark-shell --jars /usr/lib/delta/jars/delta-core.jarimport io.delta.tables._import org.apache.spark.sql.functions._// Simulate application dataval orig_df = Seq((1L, 3.0), (2L, -1.0), (3L, 0.0)).toDF("x", "y")
# Write Initial Delta format to GCS
Write the data to GCS with the following command, replacing the project ID.
orig_df.write.mode("append").format("delta").save("gs://<your-bucket-name>/first-delta-table")
# Ensure that data is read properly from Spark
Confirm the data is written to GCS with the following command, replacing the project ID.
spark.read.format("delta").load("gs://<your-bucket-name>/first-delta-table").show()
Once the data has been written we need to generate the manifest files so that Presto can read the data once the table is created via the metastore service.
# Generate manifest files
val deltaTable = DeltaTable.forPath("gs://<your-bucket-name>/first-delta-table")deltaTable.generate("symlink_format_manifest")
With Spark 3.0 and Delta 0.7.0 we now have the ability to create a Delta table in Hive metastore. To create the table below command can be used. More details can be found here
# Create Table in Hive metastore
spark.sql("CREATE TABLE my_first_table (x bigint,y double) ROW FORMAT SERDE 'org.apache.hadoop.hive.ql.io.parquet.serde.ParquetHiveSerDe' STORED AS INPUTFORMAT 'org.apache.hadoop.hive.ql.io.SymlinkTextInputFormat' OUTPUTFORMAT 'org.apache.hadoop.hive.ql.io.HiveIgnoreKeyTextOutputFormat' LOCATION 'gs://<your-bucket-name>/first-delta-table/_symlink_format_manifest'")
Once the table is created in Spark, log into the Presto cluster in a new window and verify the data. The steps to log into the Presto cluster and start the Presto shell can be found here.
#Verify Data in Presto
presto:default> select * from hive.default.my_first_table;x | y----+------2 | -1.03 | 0.01 | 3.0
Once we verify that the data can be read via Presto the next step is to look at schema evolution. To test this feature out we create a new dataframe with an extra column called “z” as shown below:
# Schema Evolution in Spark
Switch back to your Delta cluster’s Spark shell and enable the automatic schema evolution flag
spark.sql("SET spark.databricks.delta.schema.autoMerge.enabled = true")
Once this flag has been enabled create a new dataframe that has a new set of rows to be inserted along with a new column
val merge_df = Seq((10L, 30.0, "a"), (20L, -10.0, "b"), (30L, 100.0, "c")).toDF("x", "y", "z")
Once the dataframe has been created we leverage the Delta Merge function to UPDATE existing data and INSERT new data
# Use Delta Merge Statement to handle automatic schema evolution and add new rows
deltaTable.alias("o").merge(merge_df.as("n"),"o.x = n.x").whenMatched.updateAll().whenNotMatched.insertAll().execute()
As a next step we would need to do two things for the data to reflect in Presto:
- Generate updated schema manifest files so that Presto is aware of the updated data
- Modify the table schema so that Presto is aware of the new column.
When the data in a Delta table is updated you must regenerate the manifests using either of the following approaches:
- Update explicitly: After all the data updates, you can run the generate operation to update the manifests.
- Update automatically: You can configure a Delta table so that all write operations on the table automatically update the manifests. To enable this automatic mode, you can set the corresponding table property using the following SQL command.
ALTER TABLE delta.<path-to-delta-table> SET TBLPROPERTIES(delta.compatibility.symlinkFormatManifest.enabled=true)
However, in this particular case we will use the explicit method to generate the manifest files again
deltaTable.generate("symlink_format_manifest")
Once the manifest file has been re-created the next step is to update the schema in Hive metastore for Presto to be aware of the new column. This can be done in multiple ways, one of the ways to do this is shown below:
# Promote Schema Changes via Delta to Presto
val schema_evolution = "ALTER TABLE my_first_table ADD COLUMN ( " + merge_df.schema.toDDL.replace(orig_df.schema.toDDL,"").substring(1) + ")"spark.sql(s"$schema_evolution")
Once these changes are done we can now verify the new data and new column in Presto as shown below:
# Verify changes in Presto
presto:default> select * hive.default.from my_first_table;x | y | z----+-------+------20 | -10.0 | b2 | -1.0 | NULL3 | 0.0 | NULL30 | 100.0 | c10 | 30.0 | a1 | 3.0 | NULL
In summary, this article demonstrated:
- Set up the Hive metastore service using Dataproc Metastore, spin up Spark with Delta lake and Presto clusters using Dataproc
- Integrate the Hive metastore service with the different Dataproc clusters
- Build an end to end application that can run on an OSS Datalake platform powered by different GCP services
Next steps
If you are interested in building an Open Data Platform on GCP please look at the Dataproc Metastore service for which the details are available here and for details around the Dataproc service please refer to the documentation available here. In addition, refer to this blog which explains in detail the different open storage formats such as Delta & Iceberg that are natively supported within the Dataproc service.
3198
Of your peers have already watched this video.
32:30 Minutes
The most insightful time you'll spend today!
Accelerating Insights with the Health Analytics Platform
The healthcare industry is beset with a data challenge, specifically clinical data, and challenges around the proliferation of EHR instances and ancillary clinical systems.
In this video, Vivian Neilley, Solution Architect, Google Cloud and Marianne Slight, Product Manager, Google Cloud discuss how some of these challenges can be overcome with the Health Analytics Platform.
The Health Analytics Platform enables companies who have healthcare data in multiple sources on their own infrastructure to harmonize data across systems, monitor analytics, and create compelling visualizations that enable easier decision-making.
This new product suite allows for healthcare and life science organizations to manage data pipelines and run advanced analytics on managed infrastructure with interactive UIs and health data-aware features.
The Health Analytics Platform provides and end-to-end solution, from ingestion of data to harmonization to a common data model, to dashboard visualizations and machine learning.
Whether organizations leverage a data lake or are utilizing a full data warehouse approach, the platform gives users the flexibility to meet customers where they are today. This session will demonstrate how to leverage the health analytics platform to accelerate time to insights in a healthcare or life sciences organization.
More Relevant Stories for Your Company

A Look Back on Google Cloud’s Data Analytics Development Efforts from June
June is the month that holds the summer solstice, and some of us in the northern hemisphere get to enjoy the longest days of sunshine out of the entire year. We used all the hours we could in June to deliver a flurry of new features across BigQuery, Dataflow, Data

AirAsia Flies High With Data Analytics and AI
AirAsia’s vision is simple: allow everyone to fly. Founded in 2001, the airline and sister company AirAsia X have grown to service 150+ destinations in 25 markets, using 274 aircraft to operate 11,000+ weekly flights from 23 hubs across the region. While the airline is known as a provider of

Skyscanner Supercharges Ability to Turn Raw Data into Deep Understanding of Consumer Behaviour, Conversion Jumps 40%
Skyscanner is a leading global travel search company covering flights, hotels, and car hire around the world. Founded in 2003, the company helps over 40 million people each month find the best travel options across its portfolio of websites and mobile apps. Skyscanner wanted to understand the anonymized behaviour of

Google and AI Researchers Work towards Building Data-centric AI
AI researchers and engineers need better data to enable better AI solutions. The quality of an AI solution is determined by both the learning algorithm (such as a deep-neural network model) and the datasets used to train and evaluate that algorithm. Historically, AI research has focused much more on algorithms
